381
Rev Bras Med Esporte – Vol. 18, No 6 – Nov/Dec 2012
BONE MINERAL DENSITY ASSOCIATED WITH
PHYSICAL TRAITS AND LIFESTYLE
IN ADOLESCENTS
ORIGINAL ARTICLE
Romulo Maia Carlos Fonseca1
Ricardo Jacó de Oliveira¹ Rinaldo Wellerson Pereira2,3
Nanci Maria de França2
1. Post-Graduation Program in Physical Education, PPGEF – University of Brasília 2. Post-Graduation Program in Physical Education, PPGEF – Catholic University of Brasília.
3. Post-Graduation Program in Genomic Sciences and Biotechnology – Catholic University of Brasília.
Mailing address:
Nanci Maria de França Universidade Católica de Brasília QS 07, Lote 1, EPCT, Sala G-119 71966-700 Águas Claras – Taguatinga, DF, Brasil
E-mail: [email protected]
EXERCISE AND SPORTS MEDICINE CLINIC
ABSTRACT
Introduction: Just a few studies have evaluated physical traits, lifestyle and bone mineral density (BMD) acquisition in Brazilian female adolescents. Objective: To identify physical traits and lifestyle factors related to BMD in Brazilian female adolescents. Methods: 329 healthy adolescent girls aged between 10 and 20 years participated in this study. The physical characteristics evaluated were: body weight, stature, body mass index, pubertal stage, self-declared ethnicity and skin color. Concerning lifestyle, the following factors were evaluated: socioeconomic status (SES), physical activity level (PAL) and daily calcium intake. Additionally, total body, lumbar spine and femoral neck bone mineral density (BMD) was assessed by bone densitometry. Pearson’s coefficient of correlation (r) and stepwise regression analysis were employed to check dependent and independent variables correlation (p ≤ 0.05). Results: Total body, lumbar spine and femoral neck BMD increase as body weight, height, BMI, age and pubertal stage increase (r ≥ 0.43; p<0.01). On the other hand, only SES (r = 0.14; p<0.05) and PAL (r = 0.12; p<0.05) were correlated. After stepwise regression, body weight, pubertal stage, age, height, calcium intake, SES, and PAL explained around 48-68% for BMD variation in female adolescents. Conclusion: The results suggest body weight, age and pubertal stage should be used as control variables for BMD variations in female adolescents. Furthermore, SES, PAL and daily calcium intake were less important than physical traits for BMD during adolescence.
Keywords: bone mineral density, adolescents, body weight, puberty.
INTRODUCTION
The quantity of bone mineral density (BMD) acquired during childhood and adolescence may be crucial in reducing the risk of osteoporosis in the future1. This fact is related to the peak of bone mass,
which can be reached in the end of adolescence, and the femoral neck bone BMD may reach its peak before the other bone sites1,2. Therefore,
the identification of the mechanisms which optimize BMD gain during adolescence may be the best response for osteoporosis prevention.
Thus, according to Jouanny et al.3, heredity may estimate
between 60 and 80% of BMD and the remaining of this variation is influenced by physical traits and factors related to lifestyle. Many studies have supported the participation of the factors related to lifestyle and physical traits1,2,4-11. Among the physical traits which
directly influence on the acquisition of bone mass we can mention factors related to puberty1, race1,6 and body mass, while among
the factors related to lifestyle are the physical activity levels (PAL), calcium intake and socioeconomic status (SES).
However, the amount of contribution of the physical traits and lifestyle on the gain of BMD may vary according to the studied po-pulation. In Brazil, there are still few studies which present relevant data about these factors related to physical traits or lifestyle and BMD of female adolescents12-14. Moreover, no study which considers
phenotype characteristics of race and/or skin color and BMD in the Brazilian population has been found. Thus, the aim of this study was to identify and verify the contribution of the physical traits and lifestyle related to BMD of female adolescents.
METHODOLOGY
Sample
The population considered for this study includes pairs of sisters, and at least one of them should study in the public educational system of Brasília – Federal District. These adolescents were firstly recruited to participate in a broader study which analyzed the chro-mosome connection of the 1q and 11q regions with the BMD in pairs of sisters. Thus, the convenience sample comprised 329 girls aged between 10 and 20 years. The inclusion criteria adopted in the sample selection were: absence of chronic-degenerative disease; negative history of diseases or use of medication which affected bone development; and absence immobilization of any body seg-ment for a long period in the year previous to the research.
Moreover, for sample characterization, all of the adolescents answered some questions about regular consumption of cigarettes and/or alcohol and use of oral contraceptives. The participants and their parents/legal tutors (for the ones with age below 18 years) filled out and signed a Free and Clarified Consent Form before the participation in the study. The study was approved by the Ethics in Research Committee of the Catholic University of Brasília (CEP/UCB # 078/2006), according to Resolution 196/96 from CONEP.
Anthropometry and sexual maturation
382 Rev Bras Med Esporte – Vol. 18, No 6 – Nov/Dec 2012
on a Plena digital scale with resolution of 100g. Body mass index (BMI) was obtained with the formula: body mass (kg) ÷ height2 (m).
The sexual maturation level was determined by self-evaluation of pubic hair as described by Tanner15.
Skin color self-determination and measurement of skin color Ethnicity was classified by self-evaluation, according to the skin color or race classification system adopted by the home re-search of the Brazilian Institute of Geography and Statistics (IBGE) – white, black, mulatto/mixed, yellow or native. Additionally, skin color was measured by a hand refractometer. This device emits two light beams, one blue and one green, and measures the quantity of light reflected, pointing hence number values for skin color.
Lifestyle factors
Questionnaires
Physical activity level (PAL) was measured by the short Portu-guese version of the International Physical Activity Questionnaire (IPAQ). Estimation of daily calcium intake was based on food record of one day. Calcium consumption analysis was performed with the nutritional software Diet pro, version 5.1i.
The socioeconomic status of the participants was identified using the Brazil Classification Criteria of the Brazilian Association of Statistics Enterprises (ABEP, 2009 – www.abep.org). This questionnaire is based on the possession of appliances and rooms in the household as well as educational level of the head of the family. The quantity of items corresponds to a punctuation and the sum of the points classifies the subjects in A (highest class – monthly income ≥ R$ 4,648), B (monthly income ≥ R$ 1,669), C (monthly income ≥ R$ 927), D (monthly income ≥ R$ 424) and E (monthly income ≥ R$ 207).
Bone mineral density and bone mineral content (BMD / BMC) Lumbar spine, total and femoral neck bone BMD were measured by a Lunar, model DPX-IQ (software version 4.7e) double energy X-ray absorptiometry device (DXA). The variation coefficient found in the evaluations for all boné sites was within 0.7% and 2.4%12.
Statistical Analysis
Firstly, the variables were analyzed in a descriptive way in means and standard deviations. Normality was verified by Skewness and Kurtosis. Estimation of daily calcium intake was positively biased and was corrected by its own square root (√x) before being used in the subsequent analyses. The Pearson (r) correlation coefficient was used for verification of correlations with the physical traits, lifestyle and lumbar spine, femoral neck bone and total BMD. A stepwise multiple regression model was used with lumbar spine, femoral neck bone and total BMD as independent variables and body weight, height puberty stage, age, self-reported skin color, skin color, physical activity level, calcium intake and socioeconomic status were used to identify the prediction factors for BMD. Since BMI is established by body weight and height, it was not used in the analyses to avoid co-linearity. Data analysis was performed in the SPSS statistical package for Windows, version 16. Significance level adopted was p ≤ 0.05.
RESULTS
The main traits of all participants are found in table 1. None of the adolescents smoked and only four have reported weekly alcohol intake. Moreover, 23 girls reported use of oral contraceptive; however, their bone parameters were similar to the ones of the other girls. Mean menarche age was 12.2 ± 1.28 (mean ± standard deviation).
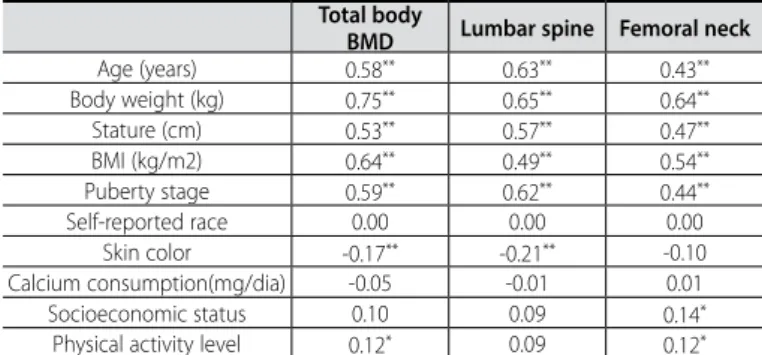
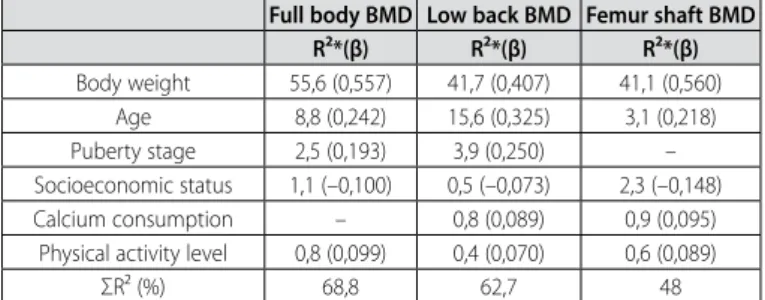
Table 2 presents the results of the correlation matrix between dependent and independent variables. The results demonstrate that the BMD of the adolescents tend to increase according to body weight gain, stature, BMI, age and puberty stage. On the other hand, among the factors related to lifestyle, only the PAL and SES positively correlated with BMD (table 2). Body weight, puberty stage, age, calcium intake, SES and PAL explained from 48 to 68% of the BMD variation of the adolescents (table 3).
Table 1. General traits of the participants (mean± standard deviation).
Girls (n = 329)
Age (years) 14.8 ± 2.5 Body weight (kg) 50.4 ± 10.0
Stature (cm) 158.1 ± 7.9 BMI (kg/m2) 20 ± 3.28
Skin color 37.9 ± 4.8 Total body BMD (g/cm2) 1.086 ± 0.105 Lumbar spine BMD (g/cm2) 1.015 ± 0.176 Femoral neck bone BMD (g/cm2) 1.019 ± 0.150 Calcium consumption (mg/dia) 446.8 ± 306.6
Puberty stage
I 32 (9.7%) II 25 (7.6%) III 49 (14.9%) IV 86 (26.1%) V 137 (41.6%)
Socioeconomic status
A (≥ R$ 8.295) 16 (4.9%) B (≥ R$ 2.656) 136 (41.3%) C (≥ R$ 1.459) 145 (44.1%) D (≥ R$ 680) 32 (9.7%)
Physical activity level
Low (< 600 MET – min/week) 118 (35.9%) Moderate (≥ 600 MET – min/week) 129 (39.2%) High (≥ 3.000 MET – min/week) 82 (24.9%)
Self-reported race
White 108 (32.8%) Black 24 (7.3%) Mulatto (mixed) 185 (56.2%)
Yellow 5 (1.5%) Native 7 (2.1%)
Table 2. Correlation matrix between physical traits, lifestyle factors and bone para-meters of the girls.
Total body
BMD Lumbar spine Femoral neck
Age (years) 0.58** 0.63** 0.43**
Body weight (kg) 0.75** 0.65** 0.64**
Stature (cm) 0.53** 0.57** 0.47**
BMI (kg/m2) 0.64** 0.49** 0.54**
Puberty stage 0.59** 0.62** 0.44**
Self-reported race 0.00 0.00 0.00 Skin color -0.17** -0.21** -0.10
Calcium consumption(mg/dia) -0.05 -0.01 0.01 Socioeconomic status 0.10 0.09 0.14*
Physical activity level 0.12* 0.09 0.12*
383
Rev Bras Med Esporte – Vol. 18, No 6 – Nov/Dec 2012 DISCUSSION
Physical traits
The mean stature, body weight and BMI values of the sample evaluated are according to the data found in a national sample with students from the five Brazilian regions16. However, the BMD
values found may present differences when compared with re-gional studies14.
Pearson correlation analysis demonstrated that BMD of the ado-lescents tends to increase according to increase in body weight, sta-ture, BMI, age and puberty stage (table 2). Additionally, bod weight was the main explanation factor for the BMD in all sites evaluated, being responsible for almost 56% of total BMD variation (table 3). Other studies also found associations between body weight and BMD, both in girls17 and young women18. Bone mineralization and
resistance, both in adults and children, constitute in stress which produces compression on the skeleton and since body weight provides the most constant mechanical stress to bones19, the
cor-relation of BMD and body weight is understandable.
Age was the second explanation factor for BMD, followed by sexual maturation stage. Besides being correlated with BMD in all bone sites, these two variables together could add up almost 20% in the lumbar spine BMD explanation. However, only age was an explanation factor for the femoral neck bone BMD. In a previous study14, BMD of adolescents was compared concerning age and
sexual maturation and significant increase of BMD between 10 and 14 years of age and sexual maturation stages (classified as pre--puberty, puberty and post-puberty) was observed. This fact was also observed in adolescents from other countries1,2,7. Concerning
the femoral neck bone BMD, sexual maturation did not present any contribution for the regression model, which must be related to the effect of the sexual hormones being more pronounced in the trabecular bones than in the cortical ones7. Therefore, the factors
which can influence mechanical stress on the femoral neck bone BMD are possibly more important for its acquisition/maintenance.
Conversely, other studies which demonstrated differences in BMD of subjects of different races1,6, both self-reported and skin
co-lor, were not explanation factors for BMD of adolescents. Moreover, only skin color presented a weak association with BMD and it was a negative association. Such fact caused a clue which can only be explained by the understanding about genetic heredity of the Bra-zilian population. The BraBra-zilian population was composed of mixing of Europeans, Africans and native Brazilians, where an individual classified as white, according to many phenotype characteristics, presents African heredity, while another classified as black, presents
Table 3. Beta coefficient and cumulative R²*, derived from the Stepwise of multiple regression models.
Full body BMD Low back BMD Femur shaft BMD
R²*(β) R²*(β) R²*(β)
Body weight 55,6 (0,557) 41,7 (0,407) 41,1 (0,560) Age 8,8 (0,242) 15,6 (0,325) 3,1 (0,218) Puberty stage 2,5 (0,193) 3,9 (0,250) – Socioeconomic status 1,1 (–0,100) 0,5 (–0,073) 2,3 (–0,148) Calcium consumption – 0,8 (0,089) 0,9 (0,095)
Physical activity level 0,8 (0,099) 0,4 (0,070) 0,6 (0,089) ΣR² (%) 68,8 62,7 48
*R² cumulative: The R² on each line presents the percentage of contribution which the variable added to the model.
European heredity20. Moreover, the genes related to the BMD
varia-tion usually specifically act according to race, age and sex21 and the
BMD variation may be influenced by genetic heredity22.
Thus, the results found in the present study suggest that the BMD stratification of Brazilian girls by race, simply considering phe-notype traits, may present inaccurate results, and while studies comparing the BMD of girls and women stratified according to genetic heredity markers are not conducted, it will be impossible to understand the correlation between race and BMD in the Bra-zilian population. Furthermore, it is possible to suggest that the use of criteria such as body weight, age and sexual maturation are the best recommendation to control the BMD variations of female adolescents.
Factors related to lifestyle
The socioeconomic status (SES) of the evaluated sample is in agreement with the expectation for the population of the Federal District, since the majority of the female adolescents was classified in classes C and B, which despite agreeing with the national mean, is different from other capitals, such as Fortaleza, Recife and Salvador which present the majority of the population in classes D and C (ABEP, 2009 – www.abep.org). Regarding the daily calcium intake, the mean values found in this study represent only 34% of the recommendation for adolescents (1,300mg/day)23. On the
other hand, 64% of the adolescents practiced physical activities in moderate to high levels. These three factors related to lifestyle presented low correlation with BMD of the bone sites analyzed; however, the three together could add up to 4.4% of explanation for the BMD in the regression models used, with the greatest contribution for the femoral neck bone BMD.
In the present study, the SES was an explanation factor for all the bone sites analyzed. Other studies presented association between SES and BMD of children and adolescents from the United Kingdom8, South Africa9 and Lebanon7. These results as a whole
suggest that the influence of the SES in the BMD is a consequence of the correlation between SES and longitudinal growth. The adolescents from the higher social classes would have BMD gain related to higher dimensions of stature and bone size, while those form lower classes, even with lower stature, would present increase of BMD provided by the greater quantity of body fat8 which directly
influences on body weight gain and its osteogenic effects, as previously mentioned in the present study.
Daily calcium intake did not present any significant association with BMD of the three bone sites analyzed; however, it was an explanation factor for lumbar spine and femoral neck bone BMD. Approximately 99% of the body calcium is stored in the bones4 and
about 26% of the calcium of an adult is acquired two year after the growth peak24, which denotes the importance of this nutrient for
384 Rev Bras Med Esporte – Vol. 18, No 6 – Nov/Dec 2012
suggest that the calcium consumption/supplementation acts in a specific manner for each bone site5,11.
In addition to that, the insufficient calcium quantity must be also contributing to the weak associations found in the PAL and BMD, since the benefits induced by physical activity in the bone tissue during growth are only seen when the calcium intake is around 1,300mg per day10. Despite of that, the PAL was an explanation
fac-tor for all bone sites and their osteogenic effects may be explained by the mechanostat theory proposed by Frost25, in which workload
and tension intensity may influence bone gain or loss. When the activity is below the minimum tension physiological values, bone mass loss occurs; within the physiological workload zone, the bone is kept and gain will occur only when the load intensity is increased. Thus, the results suggest that the SES, the PEL and daily calcium in take play a small role in the BMD variation during adolescence when compared with physical traits as body weight, age and sexual maturation stage. However, they were never unimportant, since this part of contribution may be the difference between the early onset of osteoporosis or not. Furthermore, it is worth mentioning the importance of the replication of this study with women in other age groups so that the contribution of each factor, physical feature or lifestyle during all phases of life can be determined.
The present study had some important limitations. The effects of the calcium intake in the bone metabolism were only evaluated by the analysis of its consumption, whereas the best way would be the analysis of calcium absorption and excretion rates5 which
could not be performed in this study. Besides that, stratification by race was performed only with phenotype characteristics, when for the Brazilian population the most suitable method would be the use of genetic heredity markers. However, these limitations do not make the found conclusions impossible and present new aspects which should be considered in future research.
To sum it up, the present study identified the physical traits and lifestyle related to BMD of female adolescents. Among all the factors analyzed in the present study, body weight, age and sexual maturation were the main factors related to BMD of adolescents, which suggests that the future studies should consider these factors to control the BMD variations of female adolescents. Furthermore, the factors related to lifestyle, despite presenting low contribution concerning the physical traits, can also influence the BMD gain during adolescence; however, new studies should be conducted to identify if the contribution of these factors can be altered in other phases of life.
ACKNOWLEDGEMENTS
This study received financial support from the National Council for Scientific and Technological Development (CNPq) (file number MCT/CNPq – 02/2006 – Universal – 475438/2006-0) and the Coordi-nation for the Improvement of Higher Education Personnel (CAPES).
All authors have declared there is not any potential conflict of interests concerning this article.
REFERENCES
1. Bachrach LK, Hastie T, Wang MC, Narasimhan B, R M. Bone mineral acquisition in healthy Asian, Hispanic, black, and Caucasian youth: a longitudinal study. J Clin Endocrinol Metab 1999;84:4702-12. 2. Bailey DA, McKay HA, Mirwald RL, Crocker PR, Faulkner RA. A six-year longitudinal study of the
relationship of physical activity to bone mineral accrual in growing children: the university of Saska-tchewan bone mineral accrual study. J Bone Miner Res 1999;14:1672-9.
3. Jouanny P, Guillemin F, Kuntz C, Jeandel C, Pourel J. Environmental and genetic factors affecting bone mass: similarity of bone density among members of health families. Arthritis Rheum 1995;38:61-7. 4. Kemper HC. Skeletal development during childhood and adolescence and the effects of physical
activity. Pediatr Exerc Sci 2000;12:198-216.
5. Bachrach LK. Acquisition of optimal bone mass in childhood and adolescence. Trends Endocrinol Metab 2001;12:22-8.
6. Hui S, Dimeglio L, Longcope C, Peacock M, McClintock R, Perkins A, et al. Difference in bone mass between black and white American children: attributable to body build, sex hormone levels, or bone turnover? J Clin Endocrinol Metab 2003;88:642-9.
7. Arabi A, Nabulsi M, Maalouf J, Choucair M, Khalifé H, Vieth R, et al. Bone mineral density by age, gender, pubertal stages, and socioeconomic status in healthy Lebanese children and adolescents. Bone 2004;35:1169-79.
8. Clark EM, Ness A, JH; T, ALSPAC ST. Social position affects bone mass in childhood through opposing actions on height and weight. J Bone Miner Res 2005;20:2082-9.
9. Norris SA, Sheppard ZA, Griffiths PL, Cameron N, JM. P. Current socio-economic measures, and not those measured during infancy, affect bone mass in poor urban South african children. J Bone Miner Res 2008;23:1409-16.
10. Karlsson MK, Nordqvist A, C. K. Physical activity increases bone mass during growth. Food Nutr Res 2008;52. 11. Rizzoli R, Bianchi ML, Garabédian M, McKay HA, LA. M. Maximizing bone mineral mass gain during growth for the prevention of fractures in the adolescents and the elderly. Bone 2010;46:294-305. 12. Fonseca RMC, França NM, Van Praagh E. Relationship Between Indicators of Fitness and Bone Density
in Adolescent Brazilian Children. Pediatr Exerc Sci 2008;20:40-9.
13. Santos LC, Cintra IP, Fisberg M, Castro ML, Martini LA. Associação entre a perda de peso, a massa óssea, a composição corporal e o consumo alimentar de adolescentes obesos pós-púberes. Arq Bras Endocrinol Metab 2008;52:1001-8.
14. Fonseca RMC, Pereira RW, França NMd. Conteúdo e densidade mineral óssea de adolescentes do sexo feminino. Revista Brasileira de Cineantropometria & Desempenho Humano (Online) 2011;13:359-60. 15. Tanner J. Growth at Adolescence. Oxford, UK: Blackwell Scientific, 1962.
16. Silva DAS, Pelegrini A, Petroski EL, Gaya ACA. Comparação do crescimento de crianças e adolescentes brasileiros com curvas de referência para crescimento físico: dados do Projeto Esporte Brasil. Jornal de Pediatria 2010;86:115-20.
17. El Hage R, Jacob C, Moussa E, Groussard C, Pineau JC, Benhamou CL, et al. Influence of the weight status on bone mineral content and bone mineral density in a group of Lebanese adolescent girls. Joint Bone Spine 2009;76:680-4.
18. Wang MC, Bachrach LK, Van Loan M, Hudes M, Flegal KM, PB. C. The relative contributions of lean tissue mass and fat mass to bone density in young women. Bone 2005;37:474-81.
19. Hall SJ. Biomecânica Básica. 4 ed. Rio de Janeiro: Guanabara Koogan, 2000.
20. Parra F, Amado R, Lambertucci J, Rocha J, Antunes C, Pena S. Color and genomic ancestry in Brazilians. Proc Natl Acad Sci U S A 2003;100:177-82.
21. Ralston SH, Galwey N, MacKay I, Albagha OM, Cardon L, Compston JE, et al. Loci for regulation of bone mineral density in men and women identified by genome wide linkage scan: the FAMOS study. Hum Mol Genet 2005;14:943-51.
22. Shaffer JR, Kammerer CM, Reich D, McDonald G, Patterson N, Goodpaster B, et al. Genetic markers for ances-try are correlated with body composition traits in older African Americans. Osteoporos Int 2007;18:733-41. 23. National Institute Health. Optimal calcium intake. Journal of the American Medical Association
1994;272:1942-8.
24. Bailey DA, Martin AD, McKay HA, Whiting S, Mirwald R. Calcium accretion in girls and boys during puberty: a longitudinal analysis. J Bone Miner Res 2000;15:2245-50. Epub 2000/11/25.