Rev Odontol UNESP. 2016 May-June; 45(3): 139-145 © 2016 - ISSN 1807-2577 ORIGINAL ARTICLE
Doi: http://dx.doi.org/10.1590/1807-2577.19615
Facial anthropometric analysis of a healthy group of young
Brazilian adults by means of stereophotogrammetry technique
Análise antropométrica facial de um grupo de jovens adultos brasileiros saudáveis por meio da
técnica da estereofotogrametria
Alvaro Augusto JUNQUEIRA JÚNIOR
a*, Laís Valencise MAGRI
a, Melissa de Oliveira MELCHIOR
a,
Ana Maria Bettoni RODRIGUES DA SILVA
a, Marco Antônio Moreira RODRIGUES DA SILVA
aaFaculdade de Odontologia de Ribeirão Preto, USP – Universidade de São Paulo, Ribeirão Preto, SP, Brasil
Resumo
Introdução: Antropometria é a ciência responsável por medir o peso, tamanho e proporções do corpo humano,
fornecendo informações objetivas e confiáveis para caracterizar variações e dismorfismos fenotípicos. Entre os novos métodos de análise facial, a técnica da estereofotogrametria tem mostrado excelentes resultados devido o uso de um grupo de câmeras capazes de fotografar sujeitos em múltiplos ângulos. Objetivo: Os objetivos deste estudo foram: (1) analisar o perfil facial de um grupo de jovens adultos saudáveis brasileiros, entre 18 e 30 anos, (2) definir valores comuns entre os sujeitos, (3) criar uma base de dados de medidas faciais de uma porção desta população jovem adulta de brasileiros para ser utilizada em trabalhos futuros, e (4) testar a precisão e repetibilidade do equipamento Vectra
M3. Material e método: Sessenta jovens adultos brasileiros participaram deste estudo, 30 homens e 30 mulheres.
Pontos de referência craniométricos temporários foram realizados em tecido mole, e estes sujeitos foram fotografados pela técnica da estereofotogrametria. Trinta pontos de referência foram usados para realizar as medições (em mm) de 35 distâncias. A repetibilidade do equipamento foi testada em 20% da amostra (12 sujeitos). Resultado: Os valores entre a primeira e a segunda aquisição foram estatisticamente (p<0,05) similares para todas as 35 distancias analisadas. Os achados possibilitaram a criação de um banco de dados confiável contendo distâncias de uma porção da população jovem adulta saudável brasileira. Além disso, as distâncias Tr-N, N-Sn, Ls-Sto, Sto-Li, En[r]-En[l] e Prn-Sn não foram estatisticamente diferentes entre o grupo de homens (GM) e o grupo de mulheres (GW), enquanto as outras 29 distâncias foram significativamente maiores em GM. Conclusão: A técnica e os métodos empregados neste estudo possibilitaram análise objetiva do perfil facial de um grupo de jovens adultos saudáveis brasileiros, e o equipamento Vectra M3 mostrou alto nível de precisão e reprodutibilidade.
Descritores: Estereofotogrametria; antropometria; face; população brasileira.
Abstract
Introduction: Anthropometry is the science responsible for measuring the weight, size, and proportions of the human
body, providing valuable and objective insights into how to characterize phenotypic variation and dysmorphology. Among the newer methods for facial analysis, the stereophotogrammetry technique has shown excellent results given its use of a group of fast cameras that photograph subjects from multiple angles. Objective: The aims of the present study were: (1) to analyze the facial profile of a group of healthy young Brazilian adults, between 18 and 30 years of age, (2) to define common facial values among the subjects, (3) to create a database of facial measurements of a portion of this young healthy Brazilian population to be used in future works, and (4) to test the precision and repeatability of the Vectra M3 equipment. Material and method: Sixty healthy young Brazilian adults participated
in the study, 30 males and 30 females. Temporary craniometrical landmarks were performed in soft tissue, and those subjects underwent image capturing by the stereophotogrammetry technique. Thirty landmarks were used to take the measurements (in mm) of 35 distances. The equipment repeatability was tested in 20% of the sample (i.e., 12 subjects). Result: The values between the first and second acquisitions were statistically (p<0.05) similar for all 35 distances analyzed. The findings allowed the creation of a reliable database containing facial distances of a portion of the young healthy Brazilian population. In addition, the distances Tr-N, N-Sn, Ls-Sto, Sto-Li, En[r]-En[l] and Prn-Sn were not statistically different for the group of men (GM) and the group of women (GW), while the other 29 distances were significantly greater in GM. Conclusion: The technique and methods employed in the study yielded objective analyses of the facial profile of this group of healthy young Brazilian adults, and the equipment Vectra M3
showed a high level of precision and repeatability.
INTRODUCTION
Anthropometry is the science responsible for measuring the weight, size, and proportions of the human body, providing valuable and objective insights into how to characterize phenotypic variation and dysmorphology**. It provides precise diagnoses to several syndromes and allows the evaluation and planning of orthodontic and surgical treatments, calculating normal and abnormal growths1. Traditionally, anthropometric measurements
have been acquired through direct techniques from a subject in a clinical set by using calipers and metric tapes to measure distances or arches between landmarks**.
Along with other scientific and technological advances, newer techniques, such as laser scans, magnetic resonance imaging, ultrasounds*, contact digitalization, and stereophotogrammetry,
provide significant changes on the diagnosis process, as these are considered to be non-invasive methods of facial analysis1-3.
Furthermore, analogic data have become digital, opening the possibility for quick, precise, and non-radioactive image captures, which can be simultaneously stored for future analysis as well as shared with patients and colleagues1,2,4-10. Among the
newer methods for facial analysis, the stereophotogrammetry technique has shown excellent results given its use of a group of fast cameras that photograph subjects from multiple angles. These high-speed image captures, which occur simultaneously, reduce the movement effect of the subject. Moreover, there is no modification in the soft tissue position because there is no need for direct contact with the subject during the image capturing. This way, distortions and measurement errors secondary to soft tissue manipulation can be avoided, making this a reliable, non-invasive technique2,7,11-13.
The various ethnic peculiarities of hard and soft tissues of the human face (i.e., facial morphology) characterize different populations and can be determined through 3D images. The average of these measurements from facial 3D images represents the facial morphology of soft tissue from adults and can be used to assist with diagnoses and the treatment regimens of patients from different countries, as it shows population’s singularities and soft tissue structures10. Several studies have, in fact, also
aimed at creating facial profiles of different racial groups14-19.
In Brazil, such mapping of facial profiles has not been conducted, and stereophotogrammetry techniques could certainly provide accurate measurements of the populations’ facial traits for comparison between the country’s different regions as well as to other international studies. Accordingly, the aim of this study was to analyze the facial profile of two groups consisting of healthy young Brazilian adults through the stereophotogrammetric technique in order to compare male and female subjects, define facial common values between them, as well as to test the reliability of the Vectra M3 stereophotogrammetry equipment.
** Farkas L. Examination. In: Farkas L, editor. Anthropometry of the head and face. 2nd ed. New York: Raven Press; 1994. p. 3-56.
MATERIAL AND METHOD
The present study was conducted at the Laboratory of Electromyographic Research of the Stomatognathic System at the Restorative Department of the School of Dentistry of Ribeirão Preto, University of São Paulo (Ribeirão Preto, SP, Brazil), being approved by the local Ethic Committee (CAAE number: 08874612.3.0000.5419). Sixty-four subjects were evaluated at the beginning of the study, and 60 of them were selected for facial analysis (the criteria used to select participants are described below). Two groups were created: the Group of Men (GM) and the Group of Women (GW), each one with 30 volunteers. he subjects were selected independently of their birthplace, and their participation was voluntary. All participants were informed of the objectives and methods of the study and signed the study’s informed consent following the Brazilian human research ethics committee.
In order to participate in the study, the subjects had to be Brazilian, healthy, and between 18 and 30 years of age. he following individuals were excluded from the study: subjects who had missing teeth (except for extractions due to orthodontic planning), peripheral and/or central neurologic disorders, prior major trauma and/or tumors in the craniofacial area, partial or total removable dental prosthesis, severe horizontal or vertical trespasses (> 5mm), evident craniofacial discrepancies, and clear presence of temporomandibular disorders, as well as patients who were undergoing orthodontic treatment.
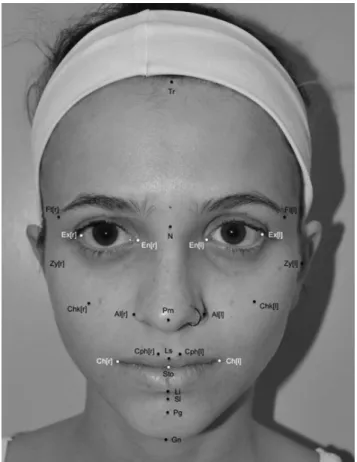
he established landmarks used in the measurements were suggested by Farkas* in 1994, except for landmarks Chk[r] and
Chl[l], positioned according to Ferrario20, and the landmark Gn
(Gnation).he marking of the landmarks was performed with a black liner (O Boticário, Brazil) in all 60 subjects. his stage
lasted, in average, 5 minutes per subject.
he landmarks Ex[r], Ex[l], En[r], En[l], Ch[r], Ch[l] and Sto were not marked with the liner. hose landmarks were positioned directly in the sotware ater the image was captured since they are well delimited by facial anatomy and their reproducibility is reliable21.
Figures 1 and 2 show the landmarks and their positions. he black dots are the landmarks where the liner was used, and the white ones are the landmarks that were entered directly on the computer.
he equipment used for the image capture was the Vectra M3
(Canield, NY, USA). Ater the correct positioning of the subject, he/she was asked to relax the facial musculature to avoid positioning alterations of the sot tissue. Once the quality of the image had been veriied, another capture was made in order to perform a repeatability test and verify the reliability of the equipment. he distances between the landmarks were measured in straight lines, and the values were expressed in millimeters.
deinitions were described by Farkas1. For the comparison between
the GM and GW groups, the T-student Test was used, considering p<0.05 as statistical signiicance.
In the repeatability test, parametrical statistics were applied for the distances with normal distribution: T-student Tests, considering 5% as signiicance level. For the distances with non-normal distribution (A[r]-Al[l], Sn-Sto, Tr-Gn and Chk[r]-Chk[l]), a non-parametrical statistic, Mann-Whitney Test, was employed.
RESULT
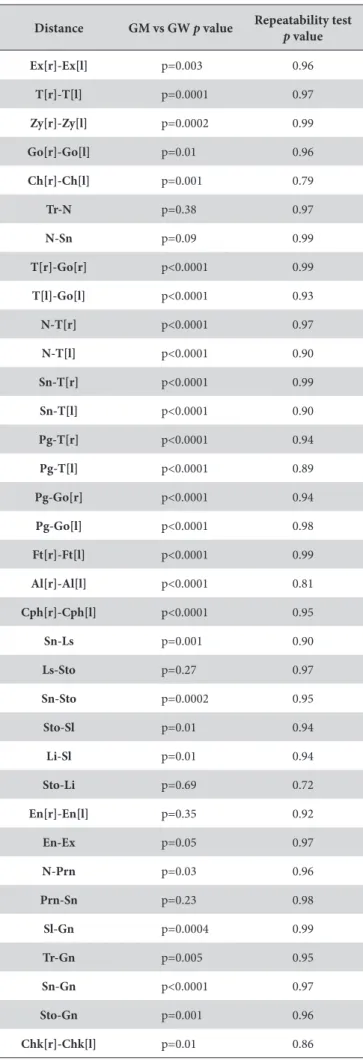
he statistical results (average, standard deviation [S.D.], median, maximum and minimum) are listed in Tables 1 and 2 (men, women). When the measurements were compared between the groups GM and GW, only the distances Tr-N, N-Sn, Ls-Sto, En[r]-En[l] and Prn-Sn were very similar between subjects for both genders, as they did not reach signiicant statistical diferences (Table 3). Further, Table 3 shows the results of the repeatability test, which include two images that were made with 12 subjects (i.e., the irst and second images of each individual). All distances had high p values, indicating that the equipment reliability was high.
DISCUSSION
Several works10,14-18,22 have anthropometrically analyzed facial
features of diferent populations. However, discussions between those studies and the present work are somewhat diicult to make due to the notable genotypic (and thereby phenotypic) variation between races. In other words, given the ethnic diversity of Brazilians, comparisons between the present indings and studies of other populations around the world would be pointless. An interesting comparison could be done ater studying other Brazilian groups (from North, Northeast, South, Central West), what is the aim of future works.
he Brazilian population is extremely diverse as Italian, German, Japanese, and Portuguese groups, among other nationalities, immigrated to Brazil in the beginning of its colonization in the 16th century and ater World Wars I and II. he number of African descendants is also representative since slavery was present in Brazil during colonial times, and slave traicking of African populations was a common and legal practice until 1850.
When both experimental groups (GM and GW) were compared, only six distances did not show statistical diferences between them: Tr-N (upper third of the face), N-Sn (middle third of the face), Ls-Sto (upper vermilion height), Sto-Li (lower vermilion height), En[r]-En[l] (intercanthal width), and Prn-Sn (nose protrusion). hese indings suggest that most landmark distances between GM and GW have clear diferences between those groups, and these diferences are partially responsible for male and female characteristics. he lower third of the face (Sn-Gn) was the only third of the face with statistical diferences between GM and GW, being the primary reason for the discrepancy in facial height (Tr-Gn) between both groups. he distances Go[r]-Go[l] (width of the mandible), T-Go (height of the mandible ramus, for both
Figure 2. Lateral view of the face, showing the used landmarks.
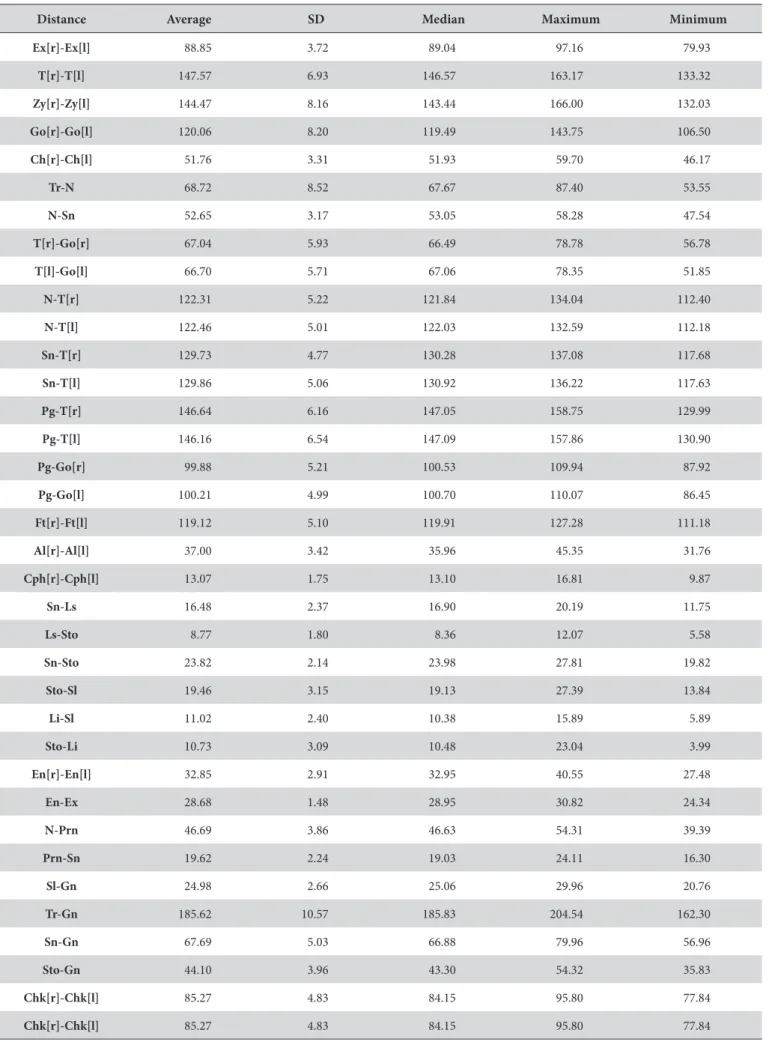
Table 1. Average, standard deviation (S.D.), median, maximum and minimum values of each distance (in mm). Men group (n=30)
Distance Average SD Median Maximum Minimum
Ex[r]-Ex[l] 88.85 3.72 89.04 97.16 79.93
T[r]-T[l] 147.57 6.93 146.57 163.17 133.32
Zy[r]-Zy[l] 144.47 8.16 143.44 166.00 132.03
Go[r]-Go[l] 120.06 8.20 119.49 143.75 106.50
Ch[r]-Ch[l] 51.76 3.31 51.93 59.70 46.17
Tr-N 68.72 8.52 67.67 87.40 53.55
N-Sn 52.65 3.17 53.05 58.28 47.54
T[r]-Go[r] 67.04 5.93 66.49 78.78 56.78
T[l]-Go[l] 66.70 5.71 67.06 78.35 51.85
N-T[r] 122.31 5.22 121.84 134.04 112.40
N-T[l] 122.46 5.01 122.03 132.59 112.18
Sn-T[r] 129.73 4.77 130.28 137.08 117.68
Sn-T[l] 129.86 5.06 130.92 136.22 117.63
Pg-T[r] 146.64 6.16 147.05 158.75 129.99
Pg-T[l] 146.16 6.54 147.09 157.86 130.90
Pg-Go[r] 99.88 5.21 100.53 109.94 87.92
Pg-Go[l] 100.21 4.99 100.70 110.07 86.45
Ft[r]-Ft[l] 119.12 5.10 119.91 127.28 111.18
Al[r]-Al[l] 37.00 3.42 35.96 45.35 31.76
Cph[r]-Cph[l] 13.07 1.75 13.10 16.81 9.87
Sn-Ls 16.48 2.37 16.90 20.19 11.75
Ls-Sto 8.77 1.80 8.36 12.07 5.58
Sn-Sto 23.82 2.14 23.98 27.81 19.82
Sto-Sl 19.46 3.15 19.13 27.39 13.84
Li-Sl 11.02 2.40 10.38 15.89 5.89
Sto-Li 10.73 3.09 10.48 23.04 3.99
En[r]-En[l] 32.85 2.91 32.95 40.55 27.48
En-Ex 28.68 1.48 28.95 30.82 24.34
N-Prn 46.69 3.86 46.63 54.31 39.39
Prn-Sn 19.62 2.24 19.03 24.11 16.30
Sl-Gn 24.98 2.66 25.06 29.96 20.76
Tr-Gn 185.62 10.57 185.83 204.54 162.30
Sn-Gn 67.69 5.03 66.88 79.96 56.96
Sto-Gn 44.10 3.96 43.30 54.32 35.83
Chk[r]-Chk[l] 85.27 4.83 84.15 95.80 77.84
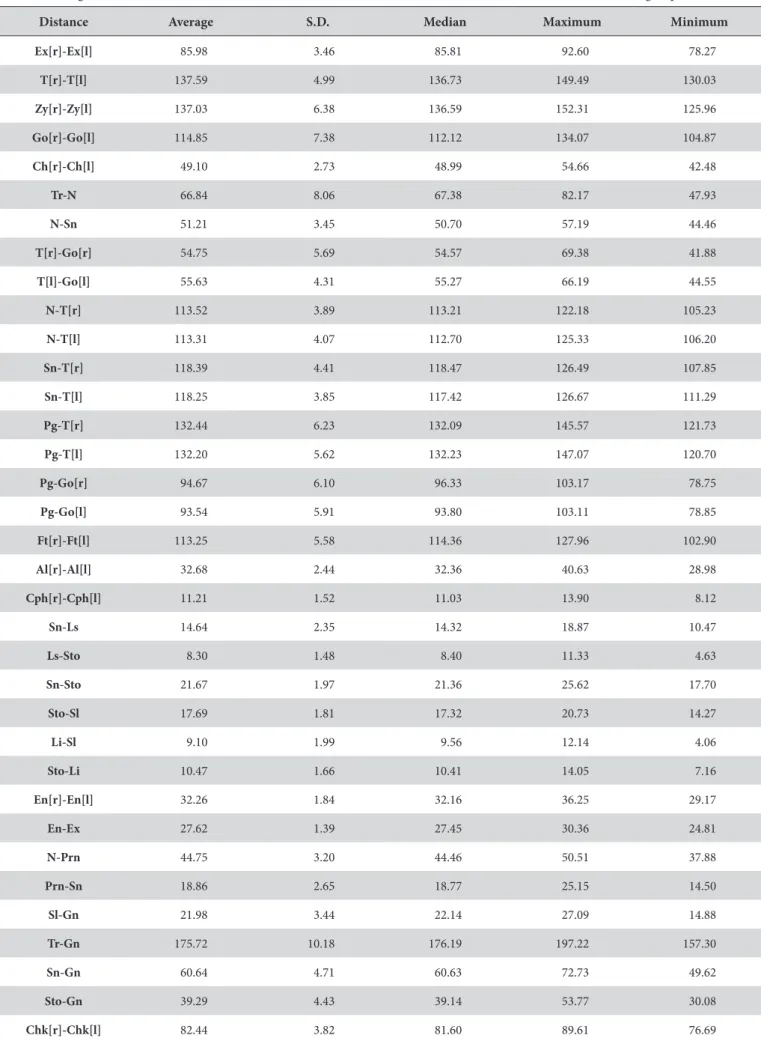
Table 2. Average, standard deviation (S.D.), median, maximum and minimum values of each distance (in mm). Women group (n=30)
Distance Average S.D. Median Maximum Minimum
Ex[r]-Ex[l] 85.98 3.46 85.81 92.60 78.27
T[r]-T[l] 137.59 4.99 136.73 149.49 130.03
Zy[r]-Zy[l] 137.03 6.38 136.59 152.31 125.96
Go[r]-Go[l] 114.85 7.38 112.12 134.07 104.87
Ch[r]-Ch[l] 49.10 2.73 48.99 54.66 42.48
Tr-N 66.84 8.06 67.38 82.17 47.93
N-Sn 51.21 3.45 50.70 57.19 44.46
T[r]-Go[r] 54.75 5.69 54.57 69.38 41.88
T[l]-Go[l] 55.63 4.31 55.27 66.19 44.55
N-T[r] 113.52 3.89 113.21 122.18 105.23
N-T[l] 113.31 4.07 112.70 125.33 106.20
Sn-T[r] 118.39 4.41 118.47 126.49 107.85
Sn-T[l] 118.25 3.85 117.42 126.67 111.29
Pg-T[r] 132.44 6.23 132.09 145.57 121.73
Pg-T[l] 132.20 5.62 132.23 147.07 120.70
Pg-Go[r] 94.67 6.10 96.33 103.17 78.75
Pg-Go[l] 93.54 5.91 93.80 103.11 78.85
Ft[r]-Ft[l] 113.25 5.58 114.36 127.96 102.90
Al[r]-Al[l] 32.68 2.44 32.36 40.63 28.98
Cph[r]-Cph[l] 11.21 1.52 11.03 13.90 8.12
Sn-Ls 14.64 2.35 14.32 18.87 10.47
Ls-Sto 8.30 1.48 8.40 11.33 4.63
Sn-Sto 21.67 1.97 21.36 25.62 17.70
Sto-Sl 17.69 1.81 17.32 20.73 14.27
Li-Sl 9.10 1.99 9.56 12.14 4.06
Sto-Li 10.47 1.66 10.41 14.05 7.16
En[r]-En[l] 32.26 1.84 32.16 36.25 29.17
En-Ex 27.62 1.39 27.45 30.36 24.81
N-Prn 44.75 3.20 44.46 50.51 37.88
Prn-Sn 18.86 2.65 18.77 25.15 14.50
Sl-Gn 21.98 3.44 22.14 27.09 14.88
Tr-Gn 175.72 10.18 176.19 197.22 157.30
Sn-Gn 60.64 4.71 60.63 72.73 49.62
Sto-Gn 39.29 4.43 39.14 53.77 30.08
Table 3.p values for each distance comparing men and women
measurements (n=60) and p value ater repeatability test (n=12)
Distance GM vs GW p value Repeatability test
p value
Ex[r]-Ex[l] p=0.003 0.96
T[r]-T[l] p=0.0001 0.97
Zy[r]-Zy[l] p=0.0002 0.99
Go[r]-Go[l] p=0.01 0.96
Ch[r]-Ch[l] p=0.001 0.79
Tr-N p=0.38 0.97
N-Sn p=0.09 0.99
T[r]-Go[r] p<0.0001 0.99
T[l]-Go[l] p<0.0001 0.93
N-T[r] p<0.0001 0.97
N-T[l] p<0.0001 0.90
Sn-T[r] p<0.0001 0.99
Sn-T[l] p<0.0001 0.90
Pg-T[r] p<0.0001 0.94
Pg-T[l] p<0.0001 0.89
Pg-Go[r] p<0.0001 0.94
Pg-Go[l] p<0.0001 0.98
Ft[r]-Ft[l] p<0.0001 0.99
Al[r]-Al[l] p<0.0001 0.81
Cph[r]-Cph[l] p<0.0001 0.95
Sn-Ls p=0.001 0.90
Ls-Sto p=0.27 0.97
Sn-Sto p=0.0002 0.95
Sto-Sl p=0.01 0.94
Li-Sl p=0.01 0.94
Sto-Li p=0.69 0.72
En[r]-En[l] p=0.35 0.92
En-Ex p=0.05 0.97
N-Prn p=0.03 0.96
Prn-Sn p=0.23 0.98
Sl-Gn p=0.0004 0.99
Tr-Gn p=0.005 0.95
Sn-Gn p<0.0001 0.97
Sto-Gn p=0.001 0.96
Chk[r]-Chk[l] p=0.01 0.86
sides), and Pg-T (protrusion of the inferior portion of the lower third of the face, for both sides) were statistically greater in GM. This shows that mandibular growth is more pronounced among men, a characteristic commonly linked to masculine facial features.
It is interesting to point out that as the average values of facial size in men are higher that in women in coronal, transversal, and sagittal planes (Tr-Gn, Zy[r]-Zy[l] and T[r-l]-Sn), distances that did not show statistical differences between groups, like Ls-Sto, Sto-Li, En[r]-En[l] and Prn-Sn, may appear to be more prominent in women. In other words, as GM shows higher average values for facial size, the equivalent distances for GW tend to present a range proportionally higher in women’s faces.
Other characteristics linked to specific areas of the face, such as nose length and width, mouth width, eye fissure length, distance between the external corners of the eyes, among others, showed significant differences between both groups, suggesting that higher values for those measurements are commonly related to masculine faces.
CONCLUSION
Even though the findings from the present study as well as the comparisons to previous research presented in the discussion are certainly important, they should be treated with caution since the groups studied here do not exhaustively represent the entire Brazilian population. Future studies, seeking data from populations from other regions of Brazil, need to be conducted so that more anthropometric data can be mapped, and thus allow for facial values for the Brazilian population to begin to be represented in a more comprehensive manner.
Nonetheless, despite the limitations of this study, it was possible to analyze objectively the facial profile of a group of healthy young Brazilian adults. Of all 35 distances analyzed in both groups included in the study (i.e., one male and one female group), only six of them were not statistically different between men and women. These were: the upper third of the face (Tr-N), middle third of the face (N-Sn), upper vermilion height (Ls-Sto), the lower vermilion height (Sto-Li), intercanthal width (En[r]-En[l]), and nose protrusion (Prn-Sn). This suggests that those distances appear to be more prominent in women, not because of their size (which is relatively statistically equal to men’s), but because they are proportionally greater in women due to females’ overall smaller facial distances. Theother 29 distances examined were statistically greater in men. Finally, the Vectra M3 proved to be highly reliable, as none of the 35 distances presented any significant differences between the first and second image capturing in all 12 analyzed subjects (20% of the sample). This finding corroborates previous research that indicates the equipment reliability.1
REFERENCES
1. Menezes M, Rosati R, Ferrario VF, Sforza C. Accuracy and reproducibility of a 3-dimensional stereophotogrammetric imaging system. J Oral Maxillofac Surg. 2010 Sep;68(9):2129-35. http://dx.doi.org/10.1016/j.joms.2009.09.036. PMid:20646812.
2. Weinberg SM, Scott NM, Neiswanger K, Brandon CA, Marazita ML. Digital three-dimensional photogrammetry: evaluation of anthropometric precision and accuracy using a Genex 3D camera system. Cleft Palate Craniofac J. 2004 Sep;41(5):507-18. http://dx.doi.org/10.1597/03-066.1. PMid:15352857.
3. Sforza C, Laino A, D’Alessio R, Dellavia C, Grandi G, Ferrario VF. Three-dimensional facial morphometry of attractive children and normal children in the deciduous and early mixed dentition. Angle Orthod. 2007 Nov;77(6):1025-33. http://dx.doi.org/10.2319/100206-400.1. PMid:18004919.
4. Aldridge K, Boyadjiev SA, Capone GT, DeLeon VB, Richtsmeier JT. Precision and error of three-dimensional phenotypic measures acquired from 3dMD photogrammetric images. Am J Med Genet A. 2005 Oct;138A(3):247-53. http://dx.doi.org/10.1002/ajmg.a.30959. PMid:16158436. 5. Ferrario VF, Sforza C, Miani A, Tartaglia G. Craniofacial morphometry by photographic evaluations. Am J Orthod Dentofacial Orthop. 1993
Apr;103(4):327-37. http://dx.doi.org/10.1016/0889-5406(93)70013-E. PMid:8480698.
6. Lane C, Harrell W Jr. Completing the 3-dimensional picture. Am J Orthod Dentofacial Orthop. 2008 Apr;133(4):612-20. http://dx.doi. org/10.1016/j.ajodo.2007.03.023. PMid:18405826.
7. Wong JY, Oh AK, Ohta E, Hunt AT, Rogers GF, Mulliken JB, et al. Validity and reliability of craniofacial anthropometric measurement of 3D digital photogrammetric images. Cleft Palate Craniofac J. 2008 May;45(3):232-9. http://dx.doi.org/10.1597/06-175. PMid:18452351.
8. Germec-Cakan D, Canter HI, Nur B, Arun T. Comparison of facial soft tissue measurements on three-dimensional images and models obtained with different methods. J Craniofac Surg. 2010 Sep;21(5):1393-9. http://dx.doi.org/10.1097/SCS.0b013e3181ec6976. PMid:20856027. 9. Deli R, Di Gioia E, Galantucci LM, Percoco G. Automated landmark extraction for orthodontic measurement of faces using the 3-camera
photogrammetry methodology. J Craniofac Surg. 2010 Jan;21(1):87-93. http://dx.doi.org/10.1097/SCS.0b013e3181c3ba74. PMid:20072024. 10. Gor T, Kau CH, English JD, Lee RP, Borbely P. Three-dimensional comparison of facial morphology in white populations in Budapest, Hungary,
and Houston, Texas. Am J Orthod Dentofacial Orthop. 2010 Mar;137(3):424-32. http://dx.doi.org/10.1016/j.ajodo.2008.12.022. PMid:20197183. 11. Weinberg SM, Naidoo S, Govier DP, Martin RA, Kane AA, Marazita ML. Anthropometric precision and accuracy of digital three-dimensional
photogrammetry: comparing the Genex and 3dMD imaging systems with one another and with direct anthropometry. J Craniofac Surg. 2006 May;17(3):477-83. http://dx.doi.org/10.1097/00001665-200605000-00015. PMid:16770184.
12. See MS, Roberts C, Nduka C. Age- and gravity-related changes in facial morphology: 3-dimensional analysis of facial morphology in mother-daughter pairs. J Oral Maxillofac Surg. 2008 Jul;66(7):1410-6. http://dx.doi.org/10.1016/j.joms.2007.12.041. PMid:18571025.
13. Ladeira PRS, Bastos EO, Vanini JV, Alonso N. Use of stereophotogrammetry for evaluating craniofacial deformities: a systematic review. Rev Bras Cir Plást. 2013 Mar;28(1):147-55. http://dx.doi.org/10.1590/S1983-51752013000100025.
14. Choe KS, Sclafani AP, Litner JA, Yu GP, Romo T 3rd. The Korean American woman’s face: anthropometric measurements and quantitative analysis of facial aesthetics. Arch Facial Plast Surg. 2004 Jul-Aug;6(4):244-52. http://dx.doi.org/10.1001/archfaci.6.4.244. PMid:15262719. 15. Porter JP. The average African American male face: an anthropometric analysis. Arch Facial Plast Surg. 2004 Mar-Apr;6(2):78-81. http://dx.doi.
org/10.1001/archfaci.6.2.78. PMid:15023793.
16. Farkas LG, Katic MJ, Forrest CR, Alt KW, Bagic I, Baltadjiev G, et al. International anthropometric study of facial morphology in various ethnic groups/races. J Craniofac Surg. 2005 Jul;16(4):615-46. http://dx.doi.org/10.1097/01.scs.0000171847.58031.9e. PMid:16077306.
17. Baik HS, Jeon JM, Lee HJ. Facial soft-tissue analysis of Korean adults with normal occlusion using a 3-dimensional laser scanner. Am J Orthod Dentofacial Orthop. 2007 Jun;131(6):759-66. http://dx.doi.org/10.1016/j.ajodo.2005.08.038. PMid:17561054.
18. Farkas LG, Katic MJ, Forrest CR. Comparison of craniofacial measurements of young adult African-American and North American white males and females. Ann Plast Surg. 2007 Dec;59(6):692-8. http://dx.doi.org/10.1097/01.sap.0000258954.55068.b4. PMid:18046155.
19. Ozdemir ST, Sigirli D, Ercan I, Cankur NS. Photographic facial soft tissue analysis of healthy Turkish young adults: anthropometric measurements. Aesthetic Plast Surg. 2009 Mar;33(2):175-84. http://dx.doi.org/10.1007/s00266-008-9274-z. PMid:19089493.
20. Ferrario VF, Sforza C, Poggio CE, Tartaglia G. Distance from symmetry: a three-dimensional evaluation of facial asymmetry. J Oral Maxillofac Surg. 1994 Nov;52(11):1126-32. http://dx.doi.org/10.1016/0278-2391(94)90528-2. PMid:7965306.
21. Douglas TS. Image processing for craniofacial landmark identification and measurement: a review of photogrammetry and cephalometry. Comput Med Imaging Graph. 2004 Oct;28(7):401-9. http://dx.doi.org/10.1016/j.compmedimag.2004.06.002. PMid:15464879.
22. Jayaratne YSN, Deutsch CK, Zwahlen RA. Normative findings for periocular anthropometric measurements among Chinese young adults in Hong Kong. Biomed Res Int. 2013, (821428):1-5. http://dx.doi.org/10.1155/2013/821428.
CONFLICTS OF INTERESTS
he authors declare no conlicts of interest.
*CORRESPONDING AUTHOR
Alvaro Augusto Junqueira Júnior, FORP – Faculdade de Odontologia de Ribeirão Preto, USP – Universidade de São Paulo, Avenida Maria de Jesus Condeixa, 655, Apto. 603, Bloco 1, Jardim Pala Travassos, 14091-230 Ribeirão Preto - SP, Brasil, e-mail: [email protected]