Article
J. Braz. Chem. Soc., Vol. 27, No. 1, 54-61, 2016. Printed in Brazil - ©2016 Sociedade Brasileira de Química 0103 - 5053 $6.00+0.00
A
*e-mail: [email protected]
Development of a Molecularly Imprinted Modified Electrode to Evaluate
Phenacetin Based on the Preconcentration of Acetaminophen
Maiara O. Salles, William R. Araujo and Thiago R. L. C. Paixão*
Instituto de Química, Universidade de São Paulo, 05508-000 São Paulo-SP, Brazil
A glassy carbon electrode modiied with a molecularly imprinted polymer (MIP) containing phenacetin recognition sites is introduced. The phenacetin-selective MIP was synthesised based on the electropolymerisation of pyrrole in a 1:1 (v/v) water/ethanol with HClO4 solution. The MIP-modiied electrode showed higher recognition ability in comparison with a bare electrode for procaine and aminopyrine, reported to electrochemically interfere in the quantiication of phenacetin in cocaine samples. In addition, the MIP was able to preconcentrate one of the intermediates of the phenacetin electrochemical oxidation, acetaminophen, indicating the possibility of monitoring phenacetin based on the acetaminophen oxidation. The acetaminophen oxidation peak is 15 times more detectable compared to the signal obtained by the non-molecularly imprinted polymer (NIP), and it occurs 450 mV below the phenacetin electrochemical oxidation signal. These achieved characteristics decrease the possibility of interference from other electrochemical reactions that may occur in the same potential range as phenacetin electrochemical process.
Keywords: electrochemical sensor, molecularly imprinted polymer, cocaine samples,
paracetamol, forensic application
Introduction
Phenacetin [(Phen), N-(4-ethoxyphenyl)ethanamide, or p-acetophenetidide, Scheme 1] is of considerable commercial interest to the pharmaceutical industry because of its broad activity as an antipyretic and analgesic agent.1
Phenacetin was widely used in the form of an aspirin-phenacetin-caffeine (‘A.P.C.’) compound analgesic for the treatment of fever and pain. However, due to its carcinogenic and kidney-damaging properties,2-4 the
U.S. Food and Drug Administration (USFDA) ordered the withdrawal of pharmaceutical formulations containing phenacetin in 1983. Despite this regulatory ban against the commercial use of phenacetin, it is a common adulterant
found in seized samples of street cocaine5-8 due to its similar
analgesic properties. Other pharmaceutical compounds are used as adulterants in illicit drugs such as cocaine, to potentiate their organoleptic effects or to mask the dilutions made by drug dealers in an effort to increase drug volumes and, accordingly, proits.
Since the compounds used to adulterate illicit drugs are individual to each drug dealer, like a fingerprint, the development of new analytical methods for the quantitation of cocaine adulterants is important not only from toxicological and clinical perspectives, but also forensically. Methods able to determine the geographical origins of seized samples may be useful for police intelligence purposes.9-11 Hence, suitable on-site analysis by
a simple, rapid detection technique for phenacetin with high sensitivity and excellent selectivity is warranted. Based on these criteria, electrochemically modiied sensors achieve all of these objectives.
Molecular imprinting is a technique for producing highly chemically selective binding sites in a polymer matrix for speciic molecular recognition, and can be easily used to fabricate electrochemical sensors.12-14 Molecularly
imprinted polymers (MIPs), with excellent selectivity, can be focused as antibody-like molecular recognition elements.12-15 The technique typically involves the following
three steps: (i) assembling a functional monomer around a template molecule in a solution containing a high percentage of cross-linker; (ii) polymerising the mixture to fabricate a stable polymer; and (iii) removing the template to afford the imprinted polymer, the recognition sites, or the recognition cavity.12,14 The MIPs offer a three-dimensional
structure for the recognition of template molecules due to shape complementarity and the interactions between the template cavity and the functional monomers. As antibody-like elements, MIPs combined with chemical sensors can be stored for long periods and reused many times without loss of activity, as compared to biosensors. This stability is due to their highly cross-linked polymeric structures, which impart physical robustness, high mechanical strength, durability toward heat and pressure, and tolerance of extreme chemical environments.12,14
MIPs can be powerful tools in the development of selective sensors. The formation of the proposed MIP sensor is based on the polymerisation of monomers in the presence of a target (or template) molecule. The template is then removed from the polymer network, leaving cavities to which the target can speciically rebind. Different types of polymers can be applied to molecular imprinting; for instance, polypyrrole, a polymer easily obtained through electrochemical reactions and with an almost constant conductivity in different media, was applied as the polymeric matrix for our MIP.16-19
Polypyrrole is a well-studied material owing to its convenient preparation, high stability, and wide range of applications.16 One of the main advantages of this type
of polymer is the possibility of fabricating MIPs using an electropolymerisation process, since this method of synthesis can simply and rapidly afford control over the thickness of the conductive polymer ilm grown at the surface of the transducer. Other types of electrosynthesised polymers based on molecular imprinting have been reported in the literature.16-18 An important advantage of polypyrrole
compared with the other polymeric layers is that they can be electropolymerised under neutral conditions, which can be useful for the entrapment of biocatalysts and biomolecules.19
This paper demonstrates a proof-of-concept for the use of a MIP to monitor phenacetin. The detection is based on the preconcentration of an intermediary species (acetaminophen) generated from phenacetin oxidation inside the speciic cavities of the MIP. To the best of our knowledge, the application of MIPs with phenacetin recognition sites using the described preconcentration approach has not been reported. Nevertheless, there is a report that uses phenacetin as an imprinted molecule with methacrylic acid (via a chemical polymerisation) as the functional monomer and acoustic wave measurements, however, preconcentration feature it is not explored.15 We also demonstrate the
electrochemical mechanism of the sensor response and the selectivity for phenacetin when compared to procaine and 4-dimethylaminoantipyrine (aminopyrine, Scheme 1) that are commonly found as adulterants of street cocaine samples seized by the police.7,11,20-22
Experimental
Reagents
All chemicals were of analytical grade and used without additional puriication. Solutions were obtained by dissolving the reagents in 1:1 (v/v) water/ethanol with 0.1 mol L−1 HClO
4 as the supporting electrolyte.
HClO4, NaNO3, KCl, and ethanol were obtained from
Merck (Darmstadt, Germany). Pyrrole, phenacetin, methyl viologen, acetaminophen (or paracetamol), and procaine were obtained from Sigma-Aldrich (Steinheim, Germany). 4-(Dimethylamino)antipyrine was obtained from Alfa Aesar, a Johnson Matthey Company (Ward Hill, USA).
Electrodes and instrumentation
A µAutolabIII potentiostat (Eco Chemie, Utrecht, Netherlands) with built-in data acquisition software (GPES v. 4.9.007) was used for the electrochemical measurements. Homemade Ag/AgCl (saturated KCl)23
and platinum wires were used as reference and counter electrodes, respectively. Glassy carbon (GC) working electrodes were modiied with a pyrrole-based MIP and a non-molecularly imprinted polymer (NIP).
USA). The tip was positioned at 50 µm from the substrate using a 20 mmol L−1 methyl viologen solution as redox
mediator. The deposition of the MIP and the NIP and the removal of phenacetin from the interior of the polymer were performed exactly as described below. For the analysis of phenacetin, the microelectrode was polarised at 1.2 V.
Preparation of MIP and NIP electrodes
The MIP and NIP were synthesised via the electropolymerisation of the pyrrole monomers. Prior to the electropolymerisation, the surface of the GC electrode was polished with an alumina suspension (1 µm, Alfa Aesar) on a microcloth polishing pad and was thoroughly washed with deionised water. The molecularly imprinted polypyrrole-modified electrode was fabricated by the electropolymerisation of pyrrole on the surface of the GC electrode in the presence of the template molecule (phenacetin) using cyclic voltammetry (CV) in the potential range between −0.60 and 1.80 V over ive cycles (scan rate: 50 mV s−1). A 1:1 (v/v) water/ethanol solution containing
0.1 mol L−1 HClO
4, 12.5 mmol L−1 pyrrole, and 25 mmol L−1
phenacetin was the solution used to polymerise the MIP with template molecules bonded to the recognition sites.
After the electropolymerisation process, the bonded phenacetin was removed by immersing the modified electrode into 1 mol L−1 NaNO
3 solution and using a
potential cleaning program (ive CVs between −0.6 and 1.8 V at a scan rate of 50 mV s−1). After this procedure,
we obtained the MIP electrode containing phenacetin recognition sites. The NIP was prepared similarly to the MIP, except that the template molecule was not present during the electropolymerisation process.
Electrochemical measurements
Cyclic voltammetric measurements were carried out in 25 mmol L−1 phenacetin solution in 1:1 (v/v) water/ethanol
medium containing 0.1 mol L−1 HClO
4. For each analysis,
15 successive CVs were recorded in a potential range from −1.0 V to 1.8 V at a scan rate of 50 mV s−1. The evaluation
of interference in the phenacetin electrochemical signal was performed using the same experimental conditions reported for phenacetin measurements, with each isolated interferent (procaine and aminopyrine) at a concentration of 25 mmol L−1.
Results and Discussion
The polymerisation of pyrrole, as described in Experimental section, can be performed by scanning the
potential by CV using a GC electrode as a substrate in 0.1 mol L−1 HClO
4 electrolyte in 1:1 (v/v) water/ethanol
solution containing 12.5 mmol L−1 pyrrole and 25 mmol L−1
phenacetin (Supplementary Information, Figure S1). Two electrochemical processes are exhibited in both presence (Figure S1) and absence (data not shown) of a template molecule at 0.95 and 1.65 V vs. Ag/AgCl(sat. KCl),
corresponding to the oxidations of pyrrole. After the irst cycle, the oxidation currents decreased due to the coverage of the electrode surface by the polymer.
To evaluate the recognition ability of the pyrrole/ phenacetin MIP, the modiied GC electrode containing the phenacetin incorporated in the polymer matrix during the electropolymerisation process was immersed in 1 mol L−1
NaNO3 solution and the potential was swept in the same
potential window as used in the modiication step for ive consecutive cycles. This process removed the phenacetin from the polymeric matrix and created phenacetin recognition sites. The CV cleaning program was evaluated with the following results. Subsequent to the removal process, the modiied electrode was placed in a solution of 25 mmol L−1 phenacetin in an appropriate supporting
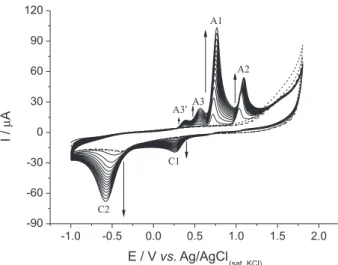
electrolyte. Figure 1 shows 15 CVs recorded under these conditions. Six peaks can be observed in the traces, four related to the oxidation process and the other two in the reduction scan. As shown by the arrows, the currents of all six peaks increase with the number of consecutive cycles recorded, indicating that some of the molecules present in solution or produced through chemical and electrochemical reactions can be accumulated inside the polymer.
The electrochemical behavior of phenacetin has been previously reported.24-26 It undergoes a series of
reactions that can result in different products, including acetaminophen and p-benzoquinone. Scheme 2 shows the electrochemical and chemical reactions that occur during phenacetin oxidation.
Initially (step 1, Scheme 2), an intermediate species (b) is formed after phenacetin (a) undergoes a sequence of reactions involving loss of an electron, a proton, and a second electron. The intermediate species (b) suffers nucleophilic attack by water, forming ethanol (c) and
2, is reversible, and the oxidation of hydroquinone to
p-benzoquinone is observed in two steps at 0.38 and 0.58 V (Figure 1A, peaks A3' and A3, respectively). To complete the process, the peak at 0.8 V (Figure 1A, peak A1) corresponds to the oxidation of acetaminophen to NAPQI, which is also reversible. It is important to highlight that peak A1 only appears from the second cycle (Figure 1B), since acetaminophen is only formed after the irst cycle, when NAPQI is electrochemically reduced.
The same electrochemical behavior of phenacetin is observed when, instead of modifying the GC surface with the MIP, the electrode is coated with a NIP, which has no speciic cavities and can be considered as the blank of the MIP. Figure 2 shows the CVs obtained with the NIP in the presence of phenacetin. It is important to state that to properly compare the NIP and MIP results, the NIP-coated electrode was also subjected to the process for the removal of the target molecule, even though phenacetin was not present in the polymer network.
The same six peaks observed with the MIP are observed with the NIP, indicating that the chemical and electrochemical processes described previously also Figure 1. (A) CVs obtained with a GC electrode modiied with the pyrrole/
phenacetin MIP in the absence (dashed lines, ive cycles) and presence (solid lines, ifteen cycles) of 25 mmol L−1 phenacetin. The solution used
for electrode modiication was 0.1 mol L−1 HClO
4 1:1 (v/v) water/ethanol,
12.5 mmol L−1 pyrrole, and 25 mmol L−1 phenacetin. The modiication
potential window ranged from −0.6 to 1.8 V at 50 mV s−1, and the analysis
potential window was from −1.0 to 1.8 V at 50 mV s−1. (B) Emphasis on
the voltammograms obtained in the absence of 25 mmol L−1 phenacetin
(dashed line), and the (a) irst and (b) second voltammograms obtained in the presence of 25 mmol L−1 phenacetin.
-1 0 1 2
-40 0 40 80
-1.0 -0.5 0.0 0.5 1.0 1.5 2.0 -150
-100 -50 0 50 100 150 200
(b)
I
/
µ
A
E / Vvs.Ag/AgCl(sat. KCl) (a)
(B)
A3'
C2
C1 A3
A2
I
/
µ
A
E / Vvs.Ag/AgCl (sat. KCl) A1
(A)
occur with the NIP electrode. In the same way, the current increases as more CVs are registered, probably due to interstices formed within the polymer itself. However, this increment in current is not as signiicant as the one observed with the MIP. For instance, the oxidation peak of acetaminophen to NAPQI (peak A1) increases 26 times for the MIP and only 1.7 times for the NIP (with respect to the difference between the irst and ifteenth cycles).
The current increases for all six peaks for both MIP and NIP could be explained by the fact that, initially, phenacetin has to diffuse to the electrode surface through the polymer ilm so the electrochemical reaction can occur. During this process, some molecules can become trapped in the cavities of the polymer, creating a microenvironment where more molecules are retained and the reactions shown in Scheme 2 can occur. This results in an apparent increase in the concentration of these species. Thus, it can be said that, when using the MIP or the NIP, a preconcentration of the analyte is effected, since as more cycles are registered, the greater the peak current observed. However, apart from the interstices of the polymer itself, MIP cavities are formed by the molecular template (in this case phenacetin) which are more suitable for the accumulation of the target molecules and thus, result in higher currents.
Both Figures 1 and 2 show that peak A1, which corresponds to the oxidation of acetaminophen to NAPQI, has a much higher current when compared to the oxidation of phenacetin to NAPQI (peak A2). This indicates that these sensors are more sensitive to the oxidation of acetaminophen, and therefore, lower concentrations of this specie could be detected. In addition, the potential of peak A1 is less positive than that of peak A2; other reactions are
less likely to occur at the same potential as the oxidation of acetaminophen to NAPQI than at the potential where phenacetin is oxidised to NAPQI. In light of these results, an indirect analysis of phenacetin by measuring the current of acetaminophen oxidation could be performed, for which lower concentrations could be detected at a potential less suited to undesired reactions.
A SECM experiment was conducted to evaluate the process of target molecule removal. The SECM technique is based on the measurement of the current of a microelectrode close to a substrate, and provides different kinds of information, such as reactivity, topography, and modiications of the substrate.27 The SECM was operated in
the generator/collector mode27 so that the phenacetin being
released from the polymer matrix and electrodeposited at the substrate (in this case, the GC electrode) could be detected with the microelectrode.
Initially, the microelectrode has to be proximal to the electrode surface, which is placed into the reaction cell with its electroactive surface upwards. The microelectrode approximation is performed using a solution containing a redox mediator. In this experiment, a platinum microelectrode with a radius of 12.5 µm and methyl viologen as the redox mediator (MV2+) were used. At the
beginning of the experiment, a bulk current was observed as a result of the reduction of the methyl viologen to a radical (MV+•).28 As the microelectrode approaches the substrate,
the observed current increases due to the increase in methyl viologen concentration resulting from the reverse reaction (oxidation of MV+• to MV2+) taking place at the substrate.
Since there is a correlation between the current measured by the microelectrode and its distance from the substrate,27 the
microelectrode was positioned 50 µm from the substrate. Thereafter, with the MIP- or NIP-modified GC electrode, a 1 mol L−1 NaNO
3 solution was added into the
reaction cell and the CV cleaning program was applied to the substrate. The microelectrode potential was polarised at the potential of phenacetin oxidation (1.2 V).
Figure 3 shows the microelectrode experimental results, and the inset shows the CVs obtained with the MIP-modiied GC electrode. When the substrate was modified with MIP, the current recorded by the microelectrode was larger (in magnitude), indicating that more species from the polymeric layer modifying the substrate were being collected at the microelectrode. This current, in both results, becomes constant after 100 s (the duration of the irst CV), thus indicating that most of the phenacetin present in the polymers is removed in the irst cycle.
The stability of the ilm toward repeated sensing cycles of the ilm was evaluated. To accomplish this, the process of MIP electrodeposition, phenacetin removal from the Figure 2. Fifteen CVs obtained with a GC electrode modiied with the
pyrrole NIP in the absence (dashed lines) and presence (solid lines) of 25 mmol L−1 phenacetin. The electrode was modiied in 0.1 mol L−1 HClO
4
in 1:1 (v/v) water/ethanol with 12.5 mmol L−1 pyrrole. The modiication
potential window ranged from −0.6 to 1.8 V at 50 mV s−1, and the analysis
potential window was from −1.0 to 1.8 V at 50 mV s−1.
-1.0 -0.5 0.0 0.5 1.0 1.5 2.0
-90 -60 -30 0 30 60 90 120
I
/
µ
A
E / Vvs.Ag/AgCl
(sat. KCl)
C2
C1 A3'
A3 A1
polymer ilm, insertion of the sensor into the phenacetin-containing solution, and recording of 15 voltammetric cycles, as described in Experimental, was repeated four times. A standard deviation of 4% was observed.
Finally, a study with three potential interferents was conducted: procaine, aminopyrine, and acetaminophen. These three species are commonly present as adulterants in cocaine29 and can be oxidised at potentials close to the
phenacetin oxidation potential (see Figures 4, S2, and 5). An erroneous result if one or more of these compounds were present in the reaction medium could happen. The interference study was conducted as follows: an MIP was electrodeposited on a clean GC electrode and phenacetin was removed from the polymer cavities. Then, the potential interferent was added to the electrolyte at a concentration of 25 mmol L–1, along with phenacetin, and ifteen cycles
were swept at 50 mV s−1 over the potential range −1.0 to
1.8 V. The results obtained were compared with three CVs obtained with each interferent on a clean GC electrode. Figure 4 shows the results for aminopyrine; the results for procaine and acetaminophen are provided in Figures S2 and 5, respectively.
For both aminopyrine (Figure 4) and procaine (Figure S2), no oxidation current can be observed when the GC electrode is coated with the pyrrole/phenacetin MIP (voltammograms B in both Figures), showing that the MIP successfully blocked the approach of these species to the electrode surface, thus eliminating their potential interference.
As expected, acetaminophen could be oxidised on the pyrrole/phenacetin MIP-modiied electrode, as shown in Figure 5. Initially, we concluded that it is not possible to analyse phenacetin in the presence of acetaminophen. However, in the presence of this interferent, the first recorded cycle would display the individual currents for the oxidation of both phenacetin and acetaminophen to NAPQI. This would indicate an initial acetaminophen contamination because it would not normally be present until after the irst voltammetric cycle. Although we cannot indirectly monitor the presence of phenacetin by the measurement of Figure 3. Currents registered by a platinum microelectrode (r = 12.5 µm)
at 50 µm from substrates modiied with pyrrole NIP or pyrrole/phenacetin MIP in 1 mol L−1 NaNO
3 solution. Inset: CVs obtained with a GC electrode
modiied with pyrrole/phenacetin MIP in a solution containing 1 mol L−1
NaNO3. The electrodes were modiied in 0.1 mol L−1 HClO4 in 1:1 (v/v)
water/ethanol, and 12.5 mmol L−1 pyrrole (NIP); or 0.1 mol L−1 HClO 4
in 1:1 (v/v) water/ethanol, 12.5 mmol L−1 pyrrole, and 25 mmol L−1
phenacetin (MIP). The modiication potential window was from −0.6 to 1.8 V at 50 mV s−1, and the analysis potential window was from −0.6 to
1.8 V at 50 mV s−1.
-1.0 -0.5 0.0 0.5 1.0 1.5 2.0
0 50 100 150
0 100 200 300 400 500
-0.16 -0.12 -0.08 -0.04
0.00 I/
µ
A
E / Vvs.Ag/AgCl(sat. KCl)
MIP
I
/
µ
A
time / s
NIP
Figure 4. CVs obtained with a GC electrode (a) uncoated and (b) coated with pyrrole/phenacetin MIP in the absence (dashed lines) and presence (solid lines) of aminopyrine. The electrode was modiied in 0.1 mol L−1
HClO4, 1:1 (v/v) water/ethanol, 12.5 mmol L−1 pyrrole, and 25 mmol L−1
phenacetin. The modiication potential window ranged from −0.6 to 1.8 V at 50 mV s−1, and the analysis potential window was from −1.0 to
1.8 V at 50 mV s−1.
-1.0 -0.5 0.0 0.5 1.0 1.5 2.0
0 200 400 600
-1.0 -0.5 0.0 0.5 1.0 1.5 2.0
-40 0 40 80 I / µ A
E / Vvs.Ag/AgCl
(sat. KCl) (a) (b) I / µ A
E / Vvs.Ag/AgCl
(sat. KCl)
Figure 5. CVs obtained with a GC electrode (a) uncoated and (b) coated with pyrrole/phenacetin MIP in the absence (dashed lines) and presence (solid lines) of acetaminophen. The electrode was modiied in 0.1 mol L−1
HClO4, 1:1 (v/v) water/ethanol, 12.5 mmol L−1 pyrrole, and 25 mmol L−1
phenacetin. The modiication potential window ranged from −0.6 to 1.8 V at 50 mV s−1, and the analysis potential window was from −1.0 to
1.8 V at 50 mV s−1.
-1.0 -0.5 0.0 0.5 1.0 1.5 2.0
-200 0 200 400
-1.0 -0.5 0.0 0.5 1.0 1.5 2.0
-80 0 80 160 I / µ A
E / Vvs.Ag/AgCl
(sat. KCl) (a) (b) I / µ A
E / Vvs.Ag/AgCl
acetaminophen preconcentrated. Hence, if both compounds are present in the sample we will need to directly monitor phenacetin using its oxidation current signal at 1.2 V instead of the preconcentrated acetaminophen oxidation process.
Conclusions
We demonstrated the applicability of a polypyrrole/ phenacetin MIP-modiied GC electrode for monitoring phenacetin. A three-step procedure that included electropolymerisation in the presence of the template molecule, template removal, and electrochemical measurement was demonstrated, based on an intermediate species trapped in the polymeric matrix, acetaminophen, formed during the electrochemical oxidation of phenacetin. Based on this preconcentration measurement, we achieved increased detectability by a factor of 15 compared to the signal obtained with the NIP, and the signal was detected 450 mV below that of the phenacetin electrochemical oxidation, decreasing the possibility of interference due to other electrochemical reactions that occur in the same potential range of the phenacetin electrochemical process. Hence, this study shows the possibility of using this polypyrrole/phenacetin MIP-modiied GC electrode for phenacetin detection/quantiication, however, further studies are needed to evaluate the analytical features (limit of detection, limit of quantiication, linear range, sensitivity) and the behavior of this sensor in real samples.
Supplementary Information
Supplementary information (cyclic voltammograms obtained during the modiication process of a glassy carbon electrode surface with the pyrrole/phenacetin MIP; cyclic voltammograms obtained with a GC electrode uncoated and coated with pyrrole/phenacetin MIP in the absence and presence of procaine) is available free of charge at http://jbcs.sbq.org.br as PDF ile.
Acknowledgements
The authors are grateful to Fundação de Amparo à Pesquisa do Estado de São Paulo (FAPESP; grant numbers 2012/12106-5, 2011/11115-8, and 2011/19903-5), Coordenação de Aperfeiçoamento de Pessoal de Nível Superior (Edital Programa Ciências Forenses number 25/2014 “Pró-Forenses”), and Conselho Nacional de Desenvolvimento Cientíico e Tecnológico (CNPq; grant numbers 470919/2011-6 and 302700/2011-0) for inancial support.
References
1. Koleva, B. B.; Kolev, T. M.; Tsalev, D. L.; Spiteller, M.; J. Pharm. Biomed. Anal.2008, 46, 267.
2. Jeffrey, A. M.; Iatropoulos, M. J.; Williams, G. M.; Toxicol. Pathol.2006, 34, 827.
3. Luijten, M.; Speksnijder, E. N.; van Alphen, N.; Westerman, A.; Heisterkamp, S. H.; van Benthem, J.; van Kreijl, C. F.; Beems, R. B.; van Steeg, H.; Mutat. Res., Fundam. Mol. Mech. Mutagen. 2006, 596, 143.
4. Castelao, J. E.; Yuan, J. M.; Gago-Dominguez, M.; Yu , M. C.; Ross, R. K.; Br. J. Cancer2000, 82, 1364.
5. Fucci, N.; De Giovanni, N.; Forensic Sci. Int.1998, 95, 247. 6. Magalhaes, E. J.; Nascentes, C. C.; Pereira, L. S. A.; Guedes,
M. L. O.; Lordeiro, R. A.; Auler, L.; Augusti, R.; de Queiroz, M.; Sci. Justice2013, 53, 425.
7. Brunt, T. M.; Rigter, S.; Hoek, J.; Vogels, N.; van Dijk, P.; Niesink, R. J. M.; Addiction2009, 104, 798.
8. Evrard, I.; Legleye, S.; Cadet-Tairou, A.; Int. J. Drug Policy 2010, 21, 399.
9. Maietti, S.; Castagna, F.; Molin, L.; Ferrara, S. D.; Traldi, P.; J. Mass Spectrom.2009, 44, 1124.
10. Pagano, B.; Lauri, I.; De Tito, S.; Persico, G.; Chini, M. G.; Malmendal, A.; Novellino, E.; Randazzo, A.; Forensic Sci. Int. 2013, 231, 120.
11. Botelho, E. D.; Cunha, R. B.; Campos, A. F. C.; Maldaner, A. O.; J. Braz. Chem. Soc.2014, 25, 611.
12. Sharma, P. S.; D’Souza, F.; Kutner, W.; TrAC, Trends Anal. Chem.2012, 34, 59.
13. Reddy, S. M.; Sette, G.; Phan, Q.; Electrochim. Acta2011, 56, 9203.
14. Diaz-Garcia, M. E.; Laino, R. B.; Microchim. Acta2005, 149, 19.
15. Tan, Y. G.; Peng, H.; Liang, C. D.; Yao, S. Z.; Sens. Actuators, B 2001, 73, 179.
16. Ozcan, L.; Sahin, M.; Sahin, Y.; Sensors2008, 8, 5792. 17. Kong, Y.; Zhao, W.; Yao, S. P.; Xu, J.; Wang, W. C.; Chen, Z.
D.; J. Appl. Polym. Sci.2010, 115, 1952.
18. Jara-Ulloa, P.; Salgado-Figueroa, P.; Moscoso, R.; Squella, J. A.; J. Electrochem. Soc.2013, 160, H243.
19. Wang, J.; Musameh, M.; Anal. Chim. Acta2005, 539, 209. 20. Shesser, R.; Jotte, R.; Olshaker, J.; Am. J. Emerg. Med.1991,
9, 336.
21. Atay, O.; Oztop, F.; Anal. Lett.1997, 30, 565.
22. Nordegren, T.; The A-Z Encyclopedia of Alcohol and Drug Abuse; Brown Walker Press: Parkland, 2002.
23. Pedrotti, J. J.; Angnes, L.; Gutz, I. G. R.; Electroanalysis1996, 8, 673.
25. Nouri-Nigjeh, E.; Bischoff, R.; Bruins, A. P.; Permentier, H. P.; Analyst2011, 136, 5064.
26. Nematollahi, D.; Shayani-Jam, H.; Alimoradi, M.; Niroomand, S.; Electrochim. Acta2009, 54, 7407.
27. Bard, A. J.; Mirkin, M. V.; Scanning Electrochemical Microscopy; Marcel Dekker, Inc.: New York, 2001.
28. Sheffer, M.; Mandler, D.; J. Electroanal. Chem.2008, 622, 115. 29. Schneider, S.; Meys, F.; Forensic Sci. Int.2011, 212, 242.
Submitted: June 9, 2015
Published online: September 18, 2015