*Corresponding author: Saeed Rezaee, Tel: +98 241 4273638, Fax: +98 241 4273639, Email: [email protected] ©
2014 The Authors. This is an Open Access article distributed under the terms of the Creative Commons Attribution (CC BY), which permits Adv Pharm Bull, 2014, 4(4), 351-358
doi: 10.5681/apb.2014.051 http://apb.tbzmed.ac.ir
Advanced
Pharmaceutical
Bulletin
High-Performance Liquid Chromatographic Determination of Propofol
in Human Plasma: Comparison of Different Heteroscedastic Calibration
Curve Models
Pooria Taghavi Moghaddam1, Mohammad Reza Pipelzadeh2, Sholeh Nesioonpour2, Nader Saki3, Saeed Rezaee1,4,5*
1
Department of Pharmaceutics, School of Pharmacy, Ahvaz Jundishapur University of Medical Sciences, Ahvaz, Iran. 2
Anesthesia Department, Ahvaz Jundishapur University of Medical Sciences, Ahvaz, Iran. 3
Department of Otolaryngology, Ahvaz Jundishapur University of Medical Sciences, Ahvaz, Iran. 4 Nanotechnology Research Center, Ahvaz Jundishapur University of Medical Sciences, Ahvaz, Iran. 5
Department of Pharmaceutics, School of Pharmacy, Zanjan University of Medical Sciences, Zanjan, Iran. (Current affiliation)
Introduction
Propofol (2, 6-diisopropylphenol) is a rapid acting anesthetic drug which is commonly used for induction and maintenance of anesthesia and for sedation in intensive care unit patients.1,2 High clearance and large apparent volume of distribution of this drug make it a good controllable intravenous anesthetic agent.3
Pharmacokinetics of propofol has been the subject of several studies. It shows a high degree of inter-individual variability and could be affected by factors such as patient age, sex and genetic polymorphism.4-11
A fully validated, accurate and precise method for measurement of propofol in biological fluid is necessary for pharmacokinetic investigations on this drug. Various high-performance liquid chromatography methods with
ultraviolet,12-14 fluorescence,14-18 mass
spectrometry12,14,19,20 and electrochemical12 detection have been reported for determination of propofol concentration in biological fluids.
Since the quality of the bio analytical data is completely under the influence of the calibration model, a well-designed and interpreted calibration curve in required for
any analytical methodology.21,22 Although the unknown concentrations of the analytes in biological samples are usually determined using linear calibration equations, in some cases the use of nonlinear models should be considered especially when the concentration range in the test samples is broad.23,24
Homoscedasticity or the equality of response uncertainty (or variances) over the entire concentration range is one of the basic assumptions of ordinary least squares regression method that is usually used to derive the calibration equations. However, this condition is not usually fulfilled and weighted regression is used to account for the heteroscedasticity of the measured response. It is clear that when the concentration range is broad, the variances of response values at different levels of concentration might be quite different.22,25
Very wide ranges of concentrations have been observed during pharmacokinetic studies of propofol.5,7,9,26 In some studies, two calibration curves were constructed for lower and higher ranges of propofol concentration.16 Although this approach is common,27-29 using a single
Research Article
Article History:
Received: 01 January 2014 Revised: 5 February 2014 Accepted: 12 February 2014 ePublished: 10 August 2014
Keywords:
Propofol
High-performance liquid chromatography
Calibration
Heteroscedasticty
Weighted least squares regression
Abstract
Purpose: The aim of this study was to select the best calibration model for determination of propofol plasma concentration by high-performance liquid chromatography method.
Methods: Determination of propofol in plasma after deproteinization with acetonitrile
containing thymol (as internal standard) was carried out on a C18 column with a mixture of
acetonitrile and trifluoroacetic acid 0.1% (60:40) as mobile phase which delivered at the flow rate of 1.2 mL/minute . Fluorescence detection was done at the excitation and emission wavelengths of 276 and 310 nm, respectively. After fitting different equations to the calibration data using weighted regression, the adequacy of models were assessed by lack-of-fit test, significance of all model parameters, adjusted coefficient of determination (R2adjusted) and by measuring the predictive performance with median relative prediction
error and median absolute relative prediction error of the validation data set.
Results: The best model was a linear equation without intercept with median relative prediction error and median absolute relative prediction error of 4.0 and 9.4%, respectively in the range of 10-5000 ng/mL. The method showed good accuracy and precision.
Taghavi Moghaddam et al.
standard curve that encompasses the entire concentration range is preferred.
This study was designed and conducted to set a high-performance liquid chromatography method for determination of propofol in human plasma with the focus on selecting the best calibration equation. To do this, we assessed different linear and nonlinear models using several usual weighting schemes. Standard statistical approaches for checking the validity and models goodness of fit were used to choose the best calibration model as described in experimental section.
Materials and Methods
Chemicals
Propofol (≥97%) was obtained from Sigma-Aldrich, USA. Thymol, trifluoroacetic acid and acetonitrile (HPLC-grade) were purchased from Merck, Germany.
Preparation of standard solutions and plasma standards
Stock standard solutions of 1mg/mL propofol and 0.1 mg/mL thymol (as internal standard) were prepared in methanol and acetonitrile, respectively and kept refrigerated. Then, a solution of 150 ng/mL thymol were made by further dilution of its stock solution with acetonitrile and used as the working internal standard and precipitating agent. Standard solutions of propofol at the concentrations of 100, 200 ,500 ,1000 ,2500 ,5000 ,10000 ,25000 and 50000 ng/ml were made by dilution of proper volumes of stock standard with methanol. Plasma standards of propofol were then prepared freshly by spiking 900 µL of human blank plasma with the above standards to give the concentration range of 10 to 5000 ng/mL. Plasma standards were stored at 4 °C until the time of analysis.
Chromatography conditions
Chromatography condition was similar to those reported by Knibbe et al with some modifications.16 The high-performance liquid chromatography system consisted of an Agilent 1260 Infinity quaternary pump and Agilent 1260 Infinity fluorescence detector (Agilent, USA). A Capital ODS-H-Optimal ® column (150 mm × 4.6 mm, 5 μm particle size) (Capital HPLC Limited, UK) was used as stationary phase. The mobile phase, a mixture of acetonitrile and trifluoroacetic acid 0.1% (60:40, v/v), was degassed by ultra-sonication for 15 minutes before using and delivered at the flow rate of 1.2 mL/minute. The excitation and emission wavelengths were set at 276 and 310 nm, respectively. Chromatography was carried out at ambient temperature.
Sample pretreatment
Four hundred microliter of the working internal standard solution was added to 200 µL of plasma standard or real sample and vortex-mixed for 2 minutes. Samples were then centrifuged at 10000 g for 5 minutes. The supernatant was separated and centrifuged for another 5 minutes .Fifty microliter of the clear supernatant was injected onto the chromatography column.
Modeling the calibration curve and statistical analysis
Calibration curves were constructed using the peak area ratios of propofol to internal standard (PAR) as the response variable. Five replicates of independently spiked propofol plasma standards in the concentration range of 10 to 5000 ng/mL were analyzed and the results were pooled together for regression analysis. Homoscedasticity of PAR values were assessed using Levene’s test.30
The following linear and nonlinear models31 were fitted to the PAR–propofol concentration (C) data:
2
.
a: .
b: .
c: . .
d: .
e: .
f: . C
PAR C
PAR C
PAR C C
PAR C
PAR C
PAR e
Five different weighting schemes including 1 (no weight), 1/C, 1/C2, 1/PAR and 1/PAR2 were used for weighed regression analysis and denoted by subscripts 1-5, respectively.22,32 After fitting the candidate models to the calibration data, method proposed by Tse et al with some modifications were employed for selection of the best model.31 The adequacy of the models were first assessed by the lack-of-fit test and significance of all model parameters. Normality of the residuals were also checked by D'Agostino-Pearson normality test.33 Models that showed significant lack-of –fit test, substantial deviation of residuals from normal distribution, had non-significant parameters31 or with high parameters dependency (greater than 0.99) 34 were excluded from further analysis. Among the remaining models, those with the ratio of adjusted R-squared (R2adjusted) to the maximum observed R2adjusted greater than a predefined value (0.8) were chosen.31
Another five replicates of propofol plasma standards at the concentrations of 10, 1000 and 5000 ng/mL were prepared and analyzed. The calculated concentrations with each of the selected models were compared with the nominal concentrations and the relative prediction error (PE%) was determined as follows:
predicted nominal
nominal
%
C
C
100
PE
C
In which Cpredicted and Cnominal are the calibration model predicted and nominal concentrations of propofol, respectively. Median of relative prediction errors and median absolute relative prediction errors were used as measures of bias and precision. These metrics of predictive performance were compared by constructing 95% confidence interval around them.35
Results and Discussion
Heteroscedastic calibration models for HPLC determination of propofol
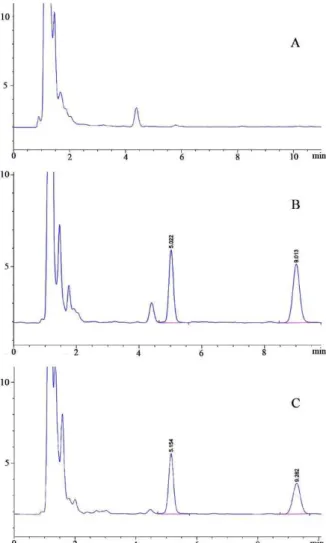
of a propofol infusion at the rate of 50 µg/minute (equal to 373 ng/mL) are shown in Figure 1 (A-C). The retention times of propofol and thymol are 5.00±0.09 (SD) and 9.17±0.05 minutes, respectively. Analytical recovery of propofol at different concentrations was greater than 90%.
Figure 1. Chromatograms of human blank plasma(A), propofol plasma standard at the concentration of 500 ng/mL(B) and a sample obtained 3 minutes post termination of a propofol infusion at the rate of 50 µg/minute(equal to 373 ng/mL)(C)
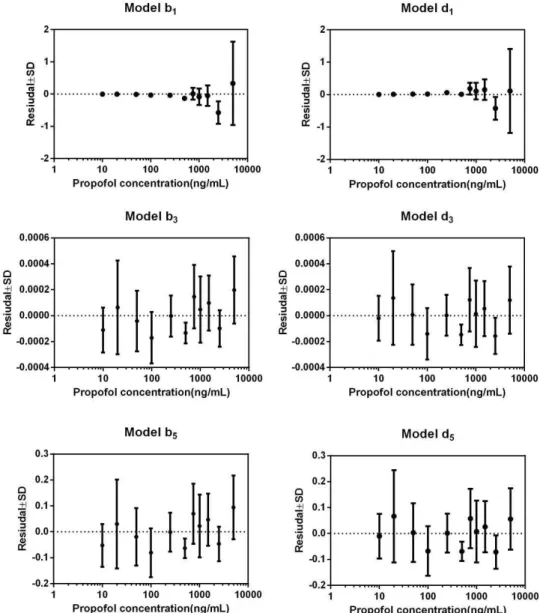
Homoscedasticity of PAR values at different concentrations of propofol was rejected (Levene statistic = 28.7, p-value<0.0001). Plot of residuals against propofol concentration (model b1in Figure 2) obtained after ordinary regression analysis of PAR-concentration data further confirms the heterogeneity of response variance. Heteroscedastic nature of the PAR values at the different levels of propofol concentration make the use of weighted least squares regression method to fit the calibration models inevitable. Fitting of the commonly used linear model (a1) by ordinary least squares regression method (with no weighting factor) led to calibration equation that predict propofol concentration at the limit of the quantitation of the method (10 ng/mL) with substantial relative prediction error (greater than 348%). Although this model ,like the
majority of the models in Table 1, has a rather good adjusted R-squared value and the ratio of its R2adjusted to the maximum observed R2adjusted is greater than 0.8, its predictive performance is not acceptable. As stated by other investigators, coefficient of determination (R2) might be quite misleading if it used as the only measure of the goodness of fit and quality of a calibration equation without reference to factors such as pattern of calibration data points, number of observations , etc.36,37
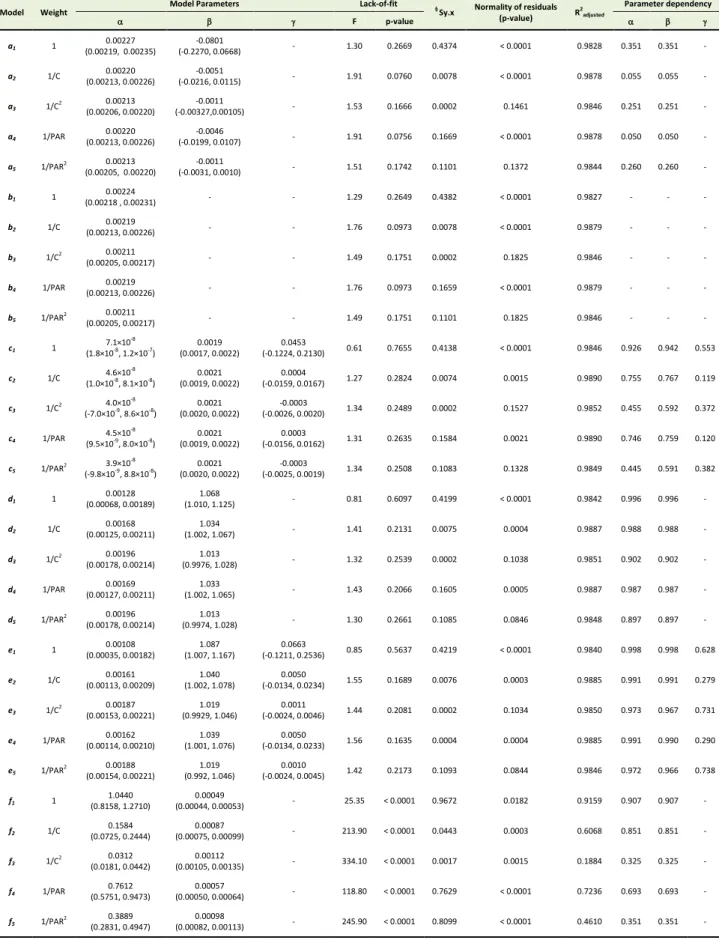
Due to the wide range of propofol concentration that may be encountered in real samples, nonlinear calibration equations were also considered in the current study.24 Among different models suggested elsewhere,31 and fitted to the propofol HPLC calibration data, the exponential models (f1-f5) showed significant lack-of-fit (p-value <0.0001) and low values of R2adjusted , therefore these models were left out. The intercepts of the linear equations (a1-a5) were not significantly different from zero, in other words it seems that these models are overparametrized and simpler models should be taken into account. Overparametrization of the calibration model lead to instability of the estimated parameters which in turn increase the variance of the calculated concentrations.31 As could be seen from Table 1, the same is true for the constants of the quadratic models (c1-c5). Also, the quadratic terms of these equations have very small values and in case of models c3 and c5 do not differ significantly from zero. Therefore, the quadratic calibration equations could not be used as predictor of propofol concentration in the unknown samples. Of the two power models (d and e) that were fitted to the data, models e1-e5 had a non-significant parameter () and could be simplified to models d (Table 1). Models d1-d5 all showed high R
2
but the parameters of d1 had dependency values greater than 0.99 that is a sign of model redundancy.31
It is now generally accepted that the least squares regression of heteroscedastic data needs proper weighting factor to account for inequality of uncertainty in response variable that is very common in analytical
methods such as high-performance liquid
Taghavi Moghaddam et al.
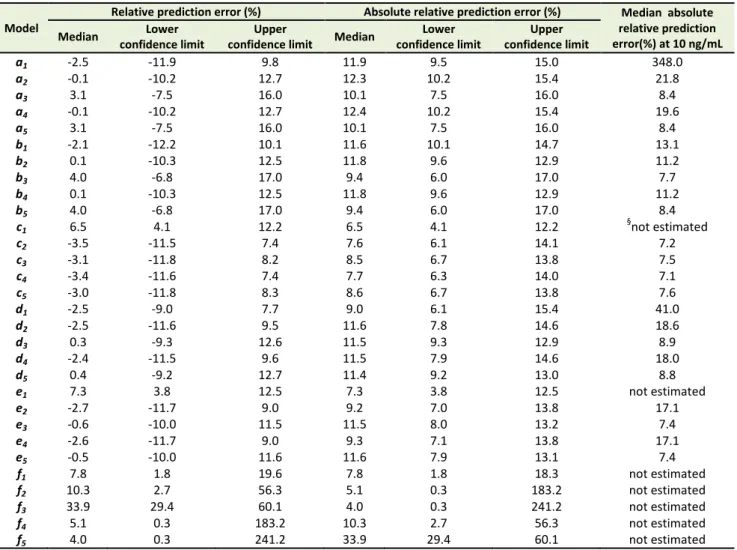
Statistically significant bias was not observed for any of the models as could be found from the 95 % confidence interval around the median relative prediction errors in Table 1. Selection of the best weighting factors was carried out according to the method proposed by Almeida et al with some modifications.22 Assessment of the results of applying different weighting schemes on median relative prediction error of propofol concentration (Table 2) reveals that for all models (a-e) the reciprocal of squared propofol concentration (1/C2) or peak area ratio of the propofol to internal standard (1/PAR2) led to the minimum bias and best precision of the estimation. It has been reported that the use of relative prediction error as the quality coefficient for choosing the best weight factor is predisposed to find proportional error in the data,32 therefore in the current study, in addition to assessing the relative prediction error of the concentration in the validation set, selection of the best weight factor was also based on statistical
judgments such as the ability of the weighting scenario in removing the heterogeneity in PAR variance (stabilization of the response variance), having the least standard error of the estimate (Sy.x) and passing the normality test of the residuals (Table 1). As could be seen from Tables 1 and 2, models b3, b5, d3 and d5 which where fitted to the calibration data with weights equal to 1/C2 or 1/PAR2 have the least standard error of estimates among all models and their residuals do not significantly deviate from normal distribution. Plots of residuals against propofol concentration are shown in Figure 2 for the above mentioned models. Although all these fitted equations (b3, b5, d3 and d5) could stabilize the variance of the response (PAR), the minimum residual values (Figure 2) were observed for models with reciprocal of squared concentration as the weighting factor. This fact could be also realized from Sy.x values (Table 1).
Heteroscedastic calibration models for HPLC determination of propofol
Table 1. Summary of the estimated parameters of models fitted to the propofol calibration data and the goodness of fit results (values in
the parentheses are the 95% confidence intervals
Model Weight
Model Parameters Lack-of-fit §
Sy.x Normality of residuals
(p-value) R
2 adjusted
Parameter dependency
F p-value
a1 1
0.00227 (0.00219, 0.00235)
-0.0801
(-0.2270, 0.0668) - 1.30 0.2669 0.4374 < 0.0001 0.9828 0.351 0.351 -
a2 1/C
0.00220 (0.00213, 0.00226)
-0.0051
(-0.0216, 0.0115) - 1.91 0.0760 0.0078 < 0.0001 0.9878 0.055 0.055 -
a3 1/C
2 0.00213
(0.00206, 0.00220)
-0.0011
(-0.00327,0.00105) - 1.53 0.1666 0.0002 0.1461 0.9846 0.251 0.251 -
a4 1/PAR
0.00220 (0.00213, 0.00226)
-0.0046
(-0.0199, 0.0107) - 1.91 0.0756 0.1669 < 0.0001 0.9878 0.050 0.050 -
a5 1/PAR
2 0.00213
(0.00205, 0.00220)
-0.0011
(-0.0031, 0.0010) - 1.51 0.1742 0.1101 0.1372 0.9844 0.260 0.260 -
b1 1
0.00224
(0.00218 , 0.00231) - - 1.29 0.2649 0.4382 < 0.0001 0.9827 - - -
b2 1/C
0.00219
(0.00213, 0.00226) - - 1.76 0.0973 0.0078 < 0.0001 0.9879 - - -
b3 1/C
2 0.00211
(0.00205, 0.00217) - - 1.49 0.1751 0.0002 0.1825 0.9846 - - -
b4 1/PAR
0.00219
(0.00213, 0.00226) - - 1.76 0.0973 0.1659 < 0.0001 0.9879 - - -
b5 1/PAR
2 0.00211
(0.00205, 0.00217) - - 1.49 0.1751 0.1101 0.1825 0.9846 - - -
c1 1
7.1×10⁻⁸
(1.8×10⁻⁸
, 1.2×10⁻⁷
)
0.0019 (0.0017, 0.0022)
0.0453
(-0.1224, 0.2130) 0.61 0.7655 0.4138 < 0.0001 0.9846 0.926 0.942 0.553
c2 1/C
4.6×10⁻⁸
(1.0×10⁻⁸
, 8.1×10⁻⁸
)
0.0021 (0.0019, 0.0022)
0.0004
(-0.0159, 0.0167) 1.27 0.2824 0.0074 0.0015 0.9890 0.755 0.767 0.119
c3 1/C
2 4.0×10
-8
(-7.0×10⁻⁹
, 8.6×10⁻⁸
)
0.0021 (0.0020, 0.0022)
-0.0003
(-0.0026, 0.0020) 1.34 0.2489 0.0002 0.1527 0.9852 0.455 0.592 0.372
c4 1/PAR
4.5×10⁻⁸ (9.5×10⁻⁹, 8.0×10⁻⁸)
0.0021 (0.0019, 0.0022)
0.0003
(-0.0156, 0.0162) 1.31 0.2635 0.1584 0.0021 0.9890 0.746 0.759 0.120
c5 1/PAR
2 3.9×10⁻⁸
(-9.8×10⁻⁹
, 8.8×10⁻⁸
)
0.0021 (0.0020, 0.0022)
-0.0003
(-0.0025, 0.0019) 1.34 0.2508 0.1083 0.1328 0.9849 0.445 0.591 0.382
d1 1
0.00128 (0.00068, 0.00189)
1.068
(1.010, 1.125) - 0.81 0.6097 0.4199 < 0.0001 0.9842 0.996 0.996 -
d2 1/C
0.00168 (0.00125, 0.00211)
1.034
(1.002, 1.067) - 1.41 0.2131 0.0075 0.0004 0.9887 0.988 0.988 -
d3 1/C
2 0.00196
(0.00178, 0.00214)
1.013
(0.9976, 1.028) - 1.32 0.2539 0.0002 0.1038 0.9851 0.902 0.902 -
d4 1/PAR
0.00169 (0.00127, 0.00211)
1.033
(1.002, 1.065) - 1.43 0.2066 0.1605 0.0005 0.9887 0.987 0.987 -
d5 1/PAR
2 0.00196
(0.00178, 0.00214)
1.013
(0.9974, 1.028) - 1.30 0.2661 0.1085 0.0846 0.9848 0.897 0.897 -
e1 1
0.00108 (0.00035, 0.00182)
1.087 (1.007, 1.167)
0.0663
(-0.1211, 0.2536) 0.85 0.5637 0.4219 < 0.0001 0.9840 0.998 0.998 0.628
e2 1/C
0.00161 (0.00113, 0.00209)
1.040 (1.002, 1.078)
0.0050
(-0.0134, 0.0234) 1.55 0.1689 0.0076 0.0003 0.9885 0.991 0.991 0.279
e3 1/C
2 0.00187
(0.00153, 0.00221)
1.019 (0.9929, 1.046)
0.0011
(-0.0024, 0.0046) 1.44 0.2081 0.0002 0.1034 0.9850 0.973 0.967 0.731
e4 1/PAR
0.00162 (0.00114, 0.00210)
1.039 (1.001, 1.076)
0.0050
(-0.0134, 0.0233) 1.56 0.1635 0.0004 0.0004 0.9885 0.991 0.990 0.290
e5 1/PAR
2 0.00188
(0.00154, 0.00221)
1.019 (0.992, 1.046)
0.0010
(-0.0024, 0.0045) 1.42 0.2173 0.1093 0.0844 0.9846 0.972 0.966 0.738
f1 1
1.0440 (0.8158, 1.2710)
0.00049
(0.00044, 0.00053) - 25.35 < 0.0001 0.9672 0.0182 0.9159 0.907 0.907 -
f2 1/C
0.1584 (0.0725, 0.2444)
0.00087
(0.00075, 0.00099) - 213.90 < 0.0001 0.0443 0.0003 0.6068 0.851 0.851 -
f3 1/C
2 0.0312
(0.0181, 0.0442)
0.00112
(0.00105, 0.00135) - 334.10 < 0.0001 0.0017 0.0015 0.1884 0.325 0.325 -
f4 1/PAR
0.7612 (0.5751, 0.9473)
0.00057
(0.00050, 0.00064) - 118.80 < 0.0001 0.7629 < 0.0001 0.7236 0.693 0.693 -
f5 1/PAR
2 0.3889
(0.2831, 0.4947)
0.00098
(0.00082, 0.00113) - 245.90 < 0.0001 0.8099 < 0.0001 0.4610 0.351 0.351 -
§
Taghavi Moghaddam et al.
Although the difference of median relative prediction error and median absolute relative prediction error between the above four models could not be considered statistically significant, model with the lower median values of the above predictive performance parameters are preferred.31,35 However, the 95% confidence interval for the parameter of model d3 includes 1 and thus the model could be reduced to a more simplified form or b3.
Application of the weighted least squares regression method with a proper weighting factor could result in better estimation of the unknown concentration near the lowest level of the analyte in the calibration curve (limit of quantitation).22 Model b3 predicts the limit of
quantitation (10 ng/mL) with median absolute prediction error of 7.7 % (Table 2).
On the other hand with the above mentioned weighted regression model, it is possible to cover the entire range of calibration curve (up to 500 fold) using one simple equation with good accuracy and precision. Table 3 shows the accuracy and precision of the reported high-performance liquid chromatography method for quantitation of propofol in human plasma. Since selection and using the weighted and/or more complex equation for the calibration curve should be justified,24 the presented approach of choosing appropriate weighted model for determination of propofol could address this issue.
Table 2. Predictive performance parameters of the different propofol calibration models
Model
Relative prediction error (%) Absolute relative prediction error (%) Median absolute
relative prediction error(%) at 10 ng/mL
Median Lower
confidence limit
Upper
confidence limit Median
Lower confidence limit
Upper confidence limit
a1 -2.5 -11.9 9.8 11.9 9.5 15.0 348.0
a2 -0.1 -10.2 12.7 12.3 10.2 15.4 21.8
a3 3.1 -7.5 16.0 10.1 7.5 16.0 8.4
a4 -0.1 -10.2 12.7 12.4 10.2 15.4 19.6
a5 3.1 -7.5 16.0 10.1 7.5 16.0 8.4
b1 -2.1 -12.2 10.1 11.6 10.1 14.7 13.1
b2 0.1 -10.3 12.5 11.8 9.6 12.9 11.2
b3 4.0 -6.8 17.0 9.4 6.0 17.0 7.7
b4 0.1 -10.3 12.5 11.8 9.6 12.9 11.2
b5 4.0 -6.8 17.0 9.4 6.0 17.0 8.4
c1 6.5 4.1 12.2 6.5 4.1 12.2
§
not estimated
c2 -3.5 -11.5 7.4 7.6 6.1 14.1 7.2
c3 -3.1 -11.8 8.2 8.5 6.7 13.8 7.5
c4 -3.4 -11.6 7.4 7.7 6.3 14.0 7.1
c5 -3.0 -11.8 8.3 8.6 6.7 13.8 7.6
d1 -2.5 -9.0 7.7 9.0 6.1 15.4 41.0
d2 -2.5 -11.6 9.5 11.6 7.8 14.6 18.6
d3 0.3 -9.3 12.6 11.5 9.3 12.9 8.9
d4 -2.4 -11.5 9.6 11.5 7.9 14.6 18.0
d5 0.4 -9.2 12.7 11.4 9.2 13.0 8.8
e1 7.3 3.8 12.5 7.3 3.8 12.5 not estimated
e2 -2.7 -11.7 9.0 9.2 7.0 13.8 17.1
e3 -0.6 -10.0 11.5 11.5 8.0 13.2 7.4
e4 -2.6 -11.7 9.0 9.3 7.1 13.8 17.1
e5 -0.5 -10.0 11.6 11.6 7.9 13.1 7.4
f1 7.8 1.8 19.6 7.8 1.8 18.3 not estimated
f2 10.3 2.7 56.3 5.1 0.3 183.2 not estimated
f3 33.9 29.4 60.1 4.0 0.3 241.2 not estimated
f4 5.1 0.3 183.2 10.3 2.7 56.3 not estimated
f5 4.0 0.3 241.2 33.9 29.4 60.1 not estimated
§
Concentration could not predicted by the model
Table 3. Results of accuracy and precision of the method
Nominal concentration
(ng/mL)
Accuracy (%) Precision (%)
Intra-day Inter-day Intra-day Inter-day
10(§LOQ) 94.8±4.5 109.6±10.4 8.7 12
1000 102.3±3.6 93.3±10.1 3.5 11.8
5000 109.4±5.8 114.5±9.0 5.4 11.2
§
Limit of quantitation
Conclusion
Heteroscedastic calibration models for HPLC determination of propofol
Acknowledgments
This paper was extracted from Pharm.D thesis of Pooria Taghavi Moghaddam that submitted in the School of Pharmacy of Ahvaz Jundishapur University of Medical Sciences and financially supported by grant no. N-49 from Vice Chancellor of Research of this university.
Conflict of Interest
There is no conflict of interest to be reported.
References
1. Petrie J, Glass P. Intravenous anesthetics. Curr Opin Anaesthesiol 2001;14(4):393-7.
2. Devlin JW, Roberts RJ. Pharmacology of commonly used analgesics and sedatives in the ICU: benzodiazepines, propofol, and opioids. Anesthesiol Clin 2011;29(4):567-85.
3. Cockshott ID. Propofol ('Diprivan') pharmacokinetics and metabolism--an overview. Postgrad Med J 1985;61 Suppl 3:45-50.
4. Loryan I, Lindqvist M, Johansson I, Hiratsuka M, Van Der Heiden I, Van Schaik RH, et al. Influence of sex on propofol metabolism, a pilot study: implications for propofol anesthesia. Eur J Clin Pharmacol 2012;68(4):397-406.
5. Yamashita S, Kaneda K, Han TH. Population pharmacokinetics of a propofol bolus administered in patients with major burns. Burns 2010;36(8):1215-21. 6. Rigouzzo A, Servin F, Constant I.
Pharmacokinetic-pharmacodynamic modeling of propofol in children. Anesthesiology 2010;113(2):343-52.
7. Cortinez LI, Anderson BJ, Penna A, Olivares L, Munoz HR, Holford NH, et al. Influence of obesity on propofol pharmacokinetics: derivation of a
pharmacokinetic model. Br J Anaesth
2010;105(4):448-56.
8. Li YH, Wu FS, Xu JG. Influence of age and sex on pharmacodynamics of propofol in neurosurgical patients: model development. Acta Pharmacol Sin 2006;27(5):629-34.
9. Kodaka M, Suzuki T, Maeyama A, Koyama K, Miyao H. Gender differences between predicted and measured propofol CP50 for loss of consciousness. J Clin Anesth 2006;18(7):486-9.
10. Li YH, Rui JZ, Zhou YG, Wang LQ, Fu SE, Yang JJ, et al. Population pharmacokinetics of propofol in
Chinese patients. Acta Pharmacol Sin
2003;24(6):581-8.
11. Kansaku F, Kumai T, Sasaki K, Yokozuka M, Shimizu M, Tateda T, et al. Individual differences in pharmacokinetics and pharmacodynamics of anesthetic agent propofol with regard to CYP2B6 and UGT1A9 genotype and patient age. Drug Metab Pharmacokinet 2011;26(5):532-7.
12. Favetta P, Guitton J, Degoute CS, Van Daele L, Boulieu R. High-performance liquid chromatographic assay to detect hydroxylate and conjugate metabolites of propofol in human urine. J Chromatogr B Biomed Sci Appl 2000;742(1):25-35.
13. Dawidowicz AL, Kalitynski R. HPLC investigation of free and bound propofol in human plasma and
cerebrospinal fluid. Biomed Chromatogr
2003;17(7):447-52.
14. Vree TB, Lagerwerf AJ, Bleeker CP, De Grood PM. Direct high-performance liquid chromatography determination of propofol and its metabolite quinol with their glucuronide conjugates and preliminary pharmacokinetics in plasma and urine of man. J Chromatogr B Biomed Sci Appl 1999;721(2):217-28. 15. Fan SZ, Yu HY, Chen YL, Liu CC. Propofol
concentration monitoring in plasma or whole blood by gas chromatography and high-performance liquid chromatography. Anesth Analg 1995;81(1):175-8. 16. Knibbe CA, Koster VS, Deneer VH, Stuurman RM,
Kuks PF, Lange R. Determination of propofol in low-volume samples by high-performance liquid chromatography with fluorescence detection. J Chromatogr B Biomed Sci Appl 1998;706(2):305-10. 17. Yarbrough J, Harvey R, Cox S. Determination of
Propofol Using High Performance Liquid Chromatography in Whole Blood with Fluorescence Detection. J Chromatogr Sci 2012;50(3):162-6. 18. Dawidowicz AL, Kalitynski R. Effects of
intraoperative fluid infusions, sample storage time, and sample handling on unbound propofol assay in human blood plasma. J Pharm Biomed Anal 2005;37(5):1167-71.
19. Miekisch W, Fuchs P, Kamysek S, Neumann C, Schubert JK. Assessment of propofol concentrations in human breath and blood by means of HS-SPME-GC-MS. Clin Chim Acta 2008;395(1-2):32-7. 20. Cohen S, Lhuillier F, Mouloua Y, Vignal B, Favetta
P, Guitton J. Quantitative measurement of propofol and in main glucuroconjugate metabolites in human plasma using solid phase extraction-liquid chromatography-tandem mass spectrometry. J Chromatogr B Analyt Technol Biomed Life Sci 2007;854(1-2):165-72.
21. Hartmann C, Smeyers-Verbeke J, Massart DL, Mcdowall RD. Validation of bioanalytical chromatographic methods. J Pharm Biomed Anal 1998;17(2):193-218.
22. Almeida AM, Castel-Branco MM, Falcao AC. Linear regression for calibration lines revisited: weighting schemes for bioanalytical methods. J Chromatogr B Analyt Technol Biomed Life Sci 2002;774(2):215-22. 23. Causon R. Validation of chromatographic methods in
biomedical analysis. Viewpoint and discussion. J Chromatogr B Biomed Sci Appl 1997;689(1):175-80. 24. U.S. Department of Health and Human Services,
Food and Drug Administration, Center for Drug Evaluation and Research (CDER), Center for Veterinary Medicine (CVM). Guidance for Industry -Bioanalytical Method Validation. Rockville: Food and Drug Administration, CDER, CVM; 2001. 25. Jain RB. Comparison of three weighting schemes in
Taghavi Moghaddam et al.
26. Schuttler J, Ihmsen H. Population pharmacokinetics of propofol: a multicenter study. Anesthesiology 2000;92(3):727-38.
27. Knibbe CA, Melenhorst-De Jong G, Mestrom M, Rademaker CM, Reijnvaan AF, Zuideveld KP, et al. Pharmacokinetics and effects of propofol 6% for short-term sedation in paediatric patients following
cardiac surgery. Br J Clin Pharmacol
2002;54(4):415-22.
28. Najjar TA, Matar KM, Alfawaz IM. Comparison of a new high-performance liquid chromatography method with fluorescence polarization immunoassay for analysis of methotrexate. Ther Drug Monit 1992;14(2):142-6.
29. Aboleneen H, Simpson J, Backes D. Determination of methotrexate in serum by high-performance liquid chromatography. J Chromatogr B Biomed Appl 1996;681(2):317-22.
30. Brown MB, Forsythe AB. Robust Tests for the Equality of Variances. J Am Stat Assoc 1974;69(346):364-7.
31. Tse SK, Chow SC. On model selection for standard curve in assay development. J Biopharm Stat 1995;5(3):285-96.
32. Tellinghuisen J. Weighted least squares in calibration: the problem with using "quality coefficients" to select weighting formulas. J Chromatogr B Analyt Technol Biomed Life Sci 2008;872(1-2):162-6.
33. D'agostino RB. Tests for Normal Distribution. In: D'Agostino RB, Stepenes MA, editors. Goodness-Of-Fit Techniques. New York: Marcel Deckker; 1986. p. 367-90.
34. Knott GD, Shrager RI. On-line modeling by curve-fitting. Siggraph Comput Graph 1972;6(4):138-51. 35. Sheiner LB, Beal SL. Some suggestions for
measuring predictive performance. J Pharmacokinet Biopharm 1981;9(4):503-12.
36. Van Loco J, Elskens M, Croux C, Beernaert H. Linearity of calibration curves: use and misuse of the correlation coefficient. Accredit Qual Assur 2002;7(7):281-5.