Cutofs and cardiovascular risk factors associated with neck
circumference among community-dwelling elderly adults:
a cross-sectional study
Pontos de corte e fatores de risco cardiovascular associados com a circunferência
do pescoço em idosos da comunidade: um estudo transversal
Hélio José Coelho Júnior
I, Ricardo Aurélio Carvalho Sampaio
I, Ivan de Oliveira Gonçalvez
II, Samuel da Silva Aguiar
III, Rafael Palmeira
II,
José Fernando de Oliveira
IV, Ricardo Yukio Asano
V, Priscila Yukari Sewo Sampaio
VI, Marco Carlos Uchida
VIIPoá Community Centers for Elderly People, Poá (SP), Brazil
ABSTRACT
CONTEXT AND OBJECTIVE: In elderly people, measurement of several anthropometric parameters may
present complications. Although neck circumference measurements seem to avoid these issues, the cut-ofs and cardiovascular risk factors associated with this parameter among elderly people remain unknown. This study was developed to identify the cutof values and cardiovascular risk factors associated with neck circumference measurements among elderly people.
DESIGN AND SETTING: Cross-sectional study conducted in two community centers for elderly people.
METHODS: 435 elderly adults (371 women and 64 men) were recruited. These volunteers underwent
morphological evaluations (body mass index and waist, hip, and neck circumferences) and hemodynamic evaluations (blood pressure values and heart rate). Receiver operating characteristic curve analyses were used to determine the predictive validity of cutof values for neck circumference, for identifying over-weight/obesity. Multivariate analysis was used to identify cardiovascular risk factors associated with large neck circumference.
RESULTS: Cutof values for neck circumference (men = 40.5 cm and women = 35.7 cm), for detection of obese older adults according to body mass index, were identiied. After a second analysis, large neck cir-cumference was shown to be associated with elevated body mass index in men; and elevated body mass index, blood pressure values, prevalence of type 2 diabetes and hypertension in women.
CONCLUSION: The data indicate that neck circumference can be used as a screening tool to identify overweight/obesity in older people. Moreover, large neck circumference values may be associated with cardiovascular risk factors.
RESUMO
CONTEXTO E OBJETIVO: Em idosos, diversas ferramentas antropométricas podem apresentar complicações durante a mensuração. Embora a circunferência do pescoço pareça evitar tais problemas, os pontos de corte e fatores de risco cardiovascular associados a essa ferramenta em idosos permanecem desconhecidos. Este estudo foi desenvolvido para identiicar os valores de ponto de corte e fatores de risco cardiovascular asso-ciados à circunferência do pescoço em idosos.
DESENHO E LOCAL: Estudo transversal, realizado em dois centros comunitários para idosos.
MÉTODOS: 435 idosos (371 mulheres e 64 homens) foram recrutados. Os voluntários foram
submeti-dos a avaliação morfológica (índice de massa corporal e cintura, quadril, e circunferência do pescoço) e hemodinâmica (valores da pressão arterial e frequência cardíaca). A análise pela curva receiver operating characteristicfoi usada para determinar o valor preditivo dos valores de ponto de corte da circunferência do pescoço para identiicação de sobrepeso/obesidade. Análise multivariada foi usada para identiicar os fatores de risco cardiovascular associados com circunferência do pescoço larga.
RESULTADOS: Os valores de corte para circunferência do pescoço (homens = 40,5 cm e mulheres = 35,7 cm) para detectar adultos idosos obesos, de acordo com o índice de massa corporal, foram identiicados. Depois da segunda análise, circunferência do pescoço larga foi associada com elevado índice de massa corporal em homens e mulheres e elevados valores de pressão arterial, prevalência de diabetes mellitus tipo II e hiperten-são em mulheres.
CONCLUSÃO: Os dados indicam que a circunferência do pescoço pode ser utilizada como ferramenta
de rastreio para identiicar sobrepeso/obesidade em idosos. Ademais, altos valores de circunferência do pescoço podem estar associados com fatores de risco cardiovascular.
IMSc. Physical Educator and Doctoral Student, Applied Kinesiology Laboratory, School of Physical Education, Universidade de Campinas (UNICAMP), Campinas (SP), Brazil.
IIMSc. Physical Educator and Doctoral Stu dent, Health Sciences Center, Universidade de Mogi das Cruzes (UMC), Mogi das Cruzes (SP), Brazil. IIIPhysical Educator and Master’s degree Student, School of Physical Education, Universidade Católica de Brasília (UCB), Brasília (DF), Brazil. IVPhD. Physical Educator and Adjunct Professor, School of Physical Education, Universidade Católica de Brasília (UCB), Brasília (DF), Brazil. VPhD. Physical Educator and Postdoctoral Student,School of Arts, Sciences and Humanities, Universidade de São Paulo (USP), São Paulo (SP), Brazil.
VIPhD. Occupational Therapist and Researcher, Applied Kinesiology Laboratory, School of Physical Education, Universidade de Campinas (UNICAMP), Campinas (SP), Brazil.
VIIPhD. Physical Educator and Head, Applied Kinesiology Laboratory, School of Physical Education, Universidade de Campinas (UNICAMP), Campinas (SP), Brazil.
KEY WORDS: Anthropometry. Blood pressure. Obesity. Aged.
Primary health care.
PALAVRAS-CHAVE: Antropometria. Pressão sanguínea. Obesidade. Idoso.
ORIGINAL ARTICLE | Coelho Jr. HJ, Sampaio RAC, Gonçalvez IO, Aguiar SS, Palmeira R, Oliveira JF, Asano RY, Sampaio PYS, Uchida MC
INTRODUCTION
Worldwide projections indicate that there will be an exponen-tial increase in the geriatric population over the coming decades.1 Today, elderly people represent around 15% of the world popula-tion, but by 2050, this percentage is expected to double, to reach values near 30%.1 his phenomenon demands special attention, since aging is associated with increased cardiovascular risk fac-tors (e.g. hypertension and type 2 diabetes), along with the risk of development of sarcopenia and frailty (e.g. decreased muscle power and strength).2-5
Epidemiological data from the World Health Organization (WHO) show that, worldwide, more than half a billion adults (i.e. > 18 years old) are overweight or obese.6 Among elderly people, obesity is one of the most prevalent morbidities, reaching approxi-mately 40% of this population in some countries.7
Obesity is a multifactorial condition caused by social, eco-nomic, behavioral and biological factors. he prevalence rate of obesity has increased signiicantly over recent decades, both in developed and in developing countries, thus leading to pandemic status for this morbid condition.8,9 In Brazil, the prevalence of overweight among adults increased from 43% in 2006 to 52.5% in 2014. Among older adults, the prevalence of overweight and obesity is higher than among younger adults (18-34 years old).10
Obesity is associated with several forms of cancer (e.g. esoph-ageal, colon and renal) and contributes towards development of many disorders: metabolic (e.g. glucose intolerance and hyperin-sulinemia), hemodynamic (e.g. high blood pressure), endothelial (e.g. increased oxidative stress) and inlammatory.8,9 Moreover, obesity has been shown to correlate with physiological disorders (e.g. depression and anxiety), muscle weakness (i.e. sarcopenic obesity) and social and economic problems.8,9,11 hus, obesity is a public health concern, and continuous monitoring and early detec-tion can prevent the onset of its adverse outcomes.
Since the data and projections indicate that Brazilians are getting older and fatter, continuous monitoring is essential for avoiding these issues associated with obesity among older adults. Regarding the methods used to measure overweight/obesity, neck circumference (NC) has been suggested as a low cost, reliable, non-invasive, easy reproducible and eicient approach for identifying overweight and obese children, adolescents and adults, and cutof values have been suggested for these populations.12-21 Moreover, there is some evidence demonstrating that NC is associated with cardiovascular risk factors, such as high waist and hip circumfer-ences, elevated blood pressure values and high total cholesterol and glycemia levels.12,13,17 However, even though optimal cutof values for adults have been suggested and have been observed to be associated with cardiovascular risk factors (e.g. elevated blood pressure and insulin resistance),20,21 there are no data in the litera-ture regarding speciic cutofs for the elderly population.
herefore, the purpose of this study was to develop cutof val-ues for identifying overweight/obesity among older adults, and to indicate the cardiovascular risk factors associated with large NC values among women and men.
OBJECTIVE
he aim of this study was to evaluate NC as a screening tool for detecting overweight and obesity in accordance with the body mass index (BMI) classiication for the elderly population, as deined by chronology (≥ 60 years old); and secondarily to inves-tigate the cardiovascular risk factors associated with large NC.
METHODS
Design
his study had a cross-sectional design and evaluated a conve-nience sample. Experiments were developed in the city of Poá, state of São Paulo, Brazil, in 2015.
Subjects
he participants of the present study were recruited voluntarily from two specialized public community health centers for older adults in southeastern Brazil, between February and November 2015. In both centers, they undertook social activities that predominantly involved the physical and cognitive domains. he physical activities com-prised a multimodal exercise program that stimulated several physi-cal capabilities (muscle strength, muscle power and cardiorespira-tory itness) within the same exercise session. hese sessions lasted approximately 40 minutes and involved low to moderate-intensity physical activities: water aerobics, folk dancing and yoga. Painting was the only activity that predominantly involved the cognitive domain. Ater registration, these older adults were automatically enrolled in all activities. However, they were not required to partici-pate in or perform activities every day. It is important to mention that neither center was responsible for rehabilitation or for any kind of medical treatment, and that these elderly individuals were func-tionally and cognitively able to understand and perform all the activ-ities. Moreover, for all participants with clinical diagnoses of diseases (e.g. hypertension or diabetes mellitus type II), their pathological condition was controlled and monitored by their private physician.
hese volunteers were recruited according to convenience and were invited orally to participate in this research.
he inclusion criterion was that the subjects needed to be people aged 60 years or over who could perform the study pro-cedures. he exclusion criteria were:
1. morbid obesity, according to the BMI classiication (i.e. over 40 kg/m2); and
All subjects provided informed consent before being enrolled in the study procedures. his study was approved by the Research Ethics Committee of the University of Mogi das Cruzes (Universidade de Mogi das Cruzes, UMC), and it was developed in accordance with the Declaration of Helsinki and with Resolution 196/96 of the Brazilian Health Council.
Anthropometric measurements
Weight, height and BMI
A weight scale with a Filizola (Brazil) stadiometer was used to measure body mass (kg) and height (cm). he BMI was deter-mined as follows: body mass index = (kg)/(height [m])². A model proposed through the Health, Wellbeing and Aging (Saúde, Bem Estar e Envelhecimento, SABE) study in conjunction with the Pan-American Health Organization (PAHO) study was used to classify BMI.22 Values ≥ 28 kg/m² were considered to represent overweight/obesity for elderly adults.22
Circumferences
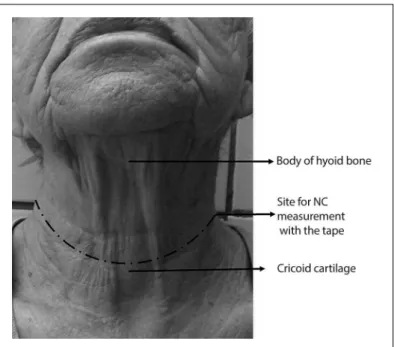
For all evaluations, i.e. waist circumference (WC), hip circumfer-ence (HC) and neck circumfercircumfer-ence (NC), a lexible and inexten-sible anthropometric tape (Sanny, Brazil) was used. he subjects remained in the standing position, with head held erect, eyes looking forward, arms relaxed at the side of the body and feet kept together, wearing light clothes. WC was assessed at the mid-point between the last loating rib and the highest mid-point of the iliac crest.23 HC was evaluated at the highest point of the buttocks.23 NC was measured just above the cricoid cartilage and perpen-dicular to the long axis of the neck.20 If necessary, to facilitate the measurement, the evaluator would possibly require the patient to look up. Starting from the small prominence of the thyroid cartilage, the evaluator applied light pressure using the foreinger and middle inger, moving downwards to ind a small space and subsequently the cricoid cartilage in the region demonstrated in Figure 1. All subjects were evaluated twice, and the larger mea-surement was used in the analyses.
Prevalence of morbidities and use of medications
Information regarding prevalence of morbidities (pathological conditions) and use of medications was collected from the medi-cal records of each subject by two researchers and the data were compared. Since both of the community health centers serve a large number of patients, and the medical team (i.e. nurse, phy-sician and physical educator) is of limited size, the pathological conditions and medications used were simply recorded by the head physician and head nurse of each center. A specialist who was not ailiated to and was outside the center then made the diagnosis. In summary, before the participant began the activities
in the center, a medical consultation was conducted and the dis-eases already diagnosed, along with the medications used, had to be informed by the physician. Moreover, over the course of the year, the participants in both centers underwent medical consul-tations and were asked about symptoms (e.g. pain, polydipsia or polyuria) that are associated with highly prevalent pathological conditions among elderly people (e.g. osteoarthritis or diabetes mellitus type II). Blood pressure and glycemia values were mea-sured and recorded by the nurses on a personal card before all physical activities at any time during the day. It should be noted that the classiication of cardiovascular disease (CVD) was based on previous clinical diagnoses of myocardial infarction, stroke (ischemic and hemorrhagic), heart failure (none of the subjects in the present study showed this), arrhythmia and heart valve prob-lems. his personal card was presented by the patient to the phy-sician on the day of the consultation, and, if necessary, the patient was referred to a specialist. If the diagnosis was conirmed, the patient needed to inform the nurse. Regarding the mean number of medications used by the patients (MNM), only the drugs asso-ciated with the disease(s) that had been clinically diagnosed were
ORIGINAL ARTICLE | Coelho Jr. HJ, Sampaio RAC, Gonçalvez IO, Aguiar SS, Palmeira R, Oliveira JF, Asano RY, Sampaio PYS, Uchida MC
quantiied. herefore, over-the-counter medications were not included. Since the medical records were reviewed and updated every six months, the MNM related to the last six months.
Cardiovascular parameters
All cardiovascular parameters were veriied with the subjects at rest. he procedures for measuring blood pressure were adapted from the Seventh Joint National Committee for High Blood Pressure (JNC7).24 In summary, the elderly individual was placed in a sit-ting position on a comfortable chair for 15 minutes in a dark and quiet room. Ater this period, a cuf of the correct size was placed approximately at the midpoint of the upper let arm (heart level). An automatic, noninvasive and validated25 arterial blood pressure monitor (Microlife-BP 3BT0A, Microlife, Widnau, Switzerland) was used to measure systolic blood pressure (SBP), diastolic blood pressure (DBP) and heart rate (HR). he mean arterial pressure (MAP), double product (DP) and pulse pressure (PP) were evalu-ated according to the following equations:
MAP = [SBP + (2 * DBP)]/3; DP = SBP * HR; and PP = SBP − DBP.
he size of the arm cuf was selected ater measuring the arm circumference (Sanny, São Paulo, Brazil).
Statistical analyses
Phase one of the statistical analysis was performed to evaluated whether NC could be used as a screening tool for detecting con-ditions of overweight and obesity in accordance with the BMI classiication among elderly women and men. Continuous data (e.g. age) and categorical data (e.g. prevalence) on the characteris-tics of these elderly adults according to BMI and gender were com-pared by means of the independent t test and chi-square test (χ²). Pearson’s correlation was performed to analyze the association of NC with age and anthropometric measurements (i.e. BMI, WC, HC and WC/HC). Receiver operating characteristic (ROC) curve analyses were used to determine the predictive validity of NC, and to evaluate optimal cutof values for identifying overweight/obese older adults in accordance with the BMI classiication. Sensitivity and speciicity were used to ind the optimal cutof values.
Phase two consisted of investigation of the cardiovascular risk factors associated with higher NC. Ater the subjects had been cate-gorized dichotomously according to their NC values from phase one, continuous data were compared by means of the independent t-test. he χ² test was performed to investigated the association between the dependent categorical variable (i.e. NC) and independent cat-egorical variables (age, BMI, SBP, DBP, MAP, HR, DP, PP, MNM, hypertension [HTN], diabetes mellitus type II [DMTII], arthritis and cardiovascular disease [CVD]). For the categorical determinations,
cutofs for the diagnosis of hypertension (in accordance with JNC7) were used for SBP and DBP, while medians were used for age, MAP, HR, DP, PP and MNM. Independent variables that showed P-values
≤ 0.20 were added sequentially one by one, in increasing P-value order, in the univariate logistic binary analysis. Similarly, variables that showed P-values ≤ 0.05 were added sequentially, one by one, in increasing order of the value of P in the multivariate logistic binary analysis. he it of the multiple regression model was evaluated by means of the Hosmer-Lemeshow26 test. All analyses were conducted using the Statistical Package for the Social Sciences sotware (SPSS; IBM, Chicago, IL, USA), version 20.0.
RESULTS
Firstly, 758 subjects from two specialized public community health centers were invited to participated in the present study. Two hundred and thirty-four of the invited subjects were mid-dle-aged and unable to commit to the present study. Among the remaining 524 older adults, 76 refused to participate, six did not sign the informed consent statement and seven were excluded due to morbid obesity (n = 5) or goiter (n = 2). herefore, 435 vol-unteers (371 women [85.2%] and 64 men [14.8%]), of whom 396 were from the irst center (Cantinho de Convivência do Idoso da Cidade de Poá) and 39 were from the second center (Instituto Renascer), formed the sample of the present study.
he prevalences of overweight and obesity (ater exclusion of the morbidly obese individuals) were 44.8% (women) and 46.6% (men), according to the BMI classiication. Table 1 shows the char-acteristics of the sample according to BMI and gender.
he anthropometric measurements (i.e. WC, HC, WC/HC and NC) were higher in high-BMI subgroups than in low-BMI subgroups, in all groups (P = 0.000). he prevalences of HTN, DMTII and arthritis were higher in high-BMI subgroups than in low-BMI subgroups among the elderly women, but not among the elderly men. he prevalences of MNM, CVD and osteoporosis did not difer between the subgroups. Pearson’s correlation was performed between NC (dependent vari-able) and age, weight and anthropometric measurements (e.g. WC, HC and WC/HC) (independent variables). NC was shown to be signiicantly correlated with age, weight, BMI, WC and WC/HC, in both groups (men and women). However, NC did not show any sig-niicant correlation with HC in either group (men: r = 0.20; P = 0.11; women:r = 0.02; P= 0.73). Moreover, Pearson’s classiication was
similar in both groups. Age and WC/HC showed weak correlation coeicients (Age: men: r = -0.15; women:r = -0.12; and WC/HC: men: r = 0.11; women: r = 0.02); while weight (men:r = 0.67; women: r = 0.56), BMI (men: r = 0.55; women:r = 0.47) and WC (men:
higher than 0.7 in both groups (men = 0.817 and women = 0.819), thus indicating clinical signiicance. Optimal cutofs were found both for men (40.5 cm; CI: 0.704-0.929; P< 0.001; sensitivity: 0.864; and speciicity: 0.317) and for women (35.7 cm; CI: 0.774-0.863; P< 0.001; sensitivity: 0.821; and speciicity: 0.311). he results demonstrated that elderly men (LR+: 2.724; LR-: 0.367) and women (LR+: 2.637; LR-: 0.379) who presented values higher than the optimal cutof for NC were approximately twice as likely to be overweight and obese according to the BMI classiication as were older adults with small NC values.
Because of the results from the irst phase, which demonstrated the capacity of NC to screen for overweight and obesity among elderly people of both genders in accordance with their BMI, a
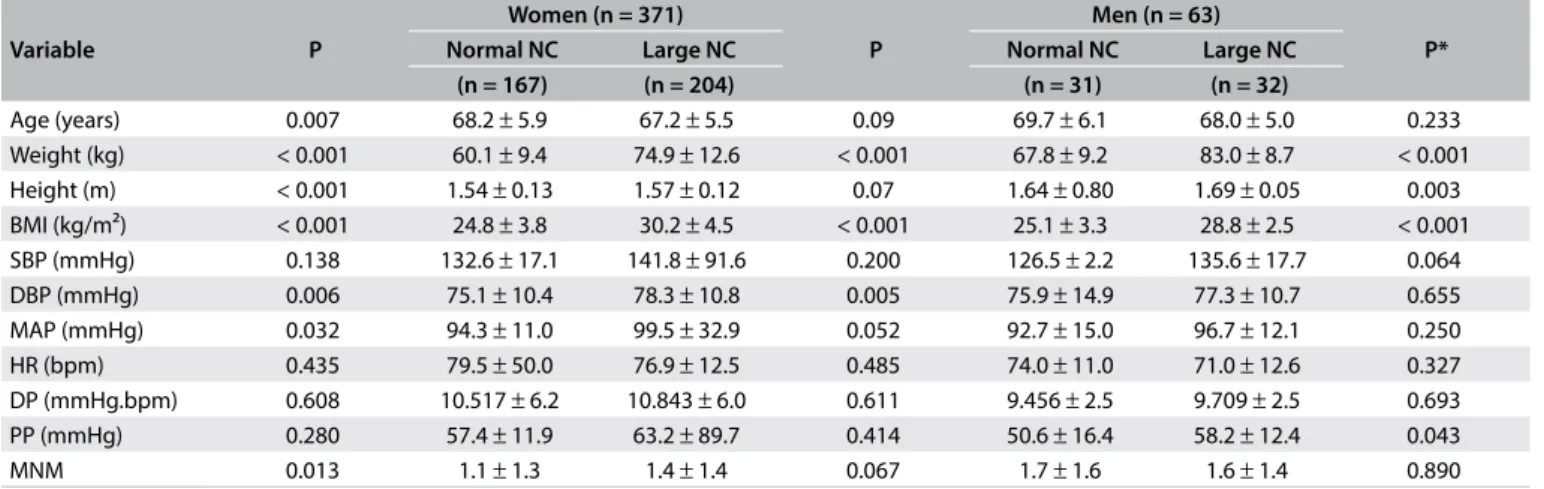
second analysis was performed to ascertain the factors associated with large NC. Ater excluding one volunteer (due to missing data), the sample (n = 434) was allocated to four groups according to NC (i.e. large or small) and gender (i.e. men or women). Weight and BMI were higher in the large-NC subgroup than in the nor-mal-NC subgroup, regardless of gender. Blood pressure measure-ments at rest did not show similar behavior between the groups. he large-NC subgroup of elderly women showed higher DBP and MAP than did the normal-NC subgroup. Meanwhile, the large-NC subgroup of elderly men showed higher PP than did the normal-NC subgroup. hese data are shown in Table 2.
A χ² test was performed to analyze the association between categorical variables. Among the elderly women, age (0.028),
Table 1. Characteristics of the older adults according to BMI and gender
Variable
Women (n = 371)
P
Men (n = 64)
P
Normal BMI High BMI Normal BMI High BMI
(n = 198) (n = 173) (n = 42) (n = 22)
Age (years) 68.5 ± 6.3 66.8 ± 4.9 0.004 69.3 ± 5.6 67.7 ± 5.5 0.290 Weight (kg) 59.7 ± 8.2 78.1 ± 11.5 < 0.001 69.9 ± 8.7 86.0 ± 9.0 < 0.001 Height (m) 1.55 ± 0.1 1.56 ± 0.0 0.661 1.67 ± 0.07 1.67 ± 0.07 0.940 BMI (kg/m²) 24.1 ± 2.7 32.1 ± 3.3 < 0.001 25.0 ± 2.2 30.6 ± 1.8 < 0.001 WC (cm) 88.7 ± 8.4 105.0 ± 12.2 < 0.001 94.4 ± 8.3 107.2 ± 8.3 < 0.001 HC (cm) 101.8 ± 68.4 111.8 ± 7.8 0.056 97.6 ± 5.6 104.0 ± 13.6 0.01 WC/HC 0.90 ± 0.12 0.94 ± 0.10 0.012 0.96 ± 0.07 106 ± 2.69 0.037 NC (cm) 34.7 ± 2.4 38.3 ± 6.2 < 0.001 39.0 ± 2.9 42.5 ± 2.8 < 0.001
MNM 1.2 ± 1.4 1.4 ± 1.3 0.267 1.7 ± 1.5 1.6 ± 1.4 0.850
Hypertension prevalence (%) 48.3 51.7 0.011 59.0 41.0 0.162
DMTII prevalence (%) 41.5 58.5 0.035 70.6 29.4 0.615
Arthritis prevalence (%) 40.0 70.0 < 0.001 45.5 54.5 0.122
CVD prevalence (%) 41.0 59.0 0.102 70.0 30.0 0.751
Osteoporosis prevalence (%) 57.5 42.5 0.308 40.0 60.0 0.209
BMI = body mass index; WC = waist circumference; HC = hip circumference; WC/HC = waist to hip ratio; NC = neck circumference; DMTII = diabetes mellitus type II; CVD = cardiovascular disease; MNM = mean number of medications used by the patients.
Table 2. Characteristics of the older adults according to NC and gender
Variable P
Women (n = 371)
P
Men (n = 63)
P*
Normal NC Large NC Normal NC Large NC
(n = 167) (n = 204) (n = 31) (n = 32)
Age (years) 0.007 68.2 ± 5.9 67.2 ± 5.5 0.09 69.7 ± 6.1 68.0 ± 5.0 0.233 Weight (kg) < 0.001 60.1 ± 9.4 74.9 ± 12.6 < 0.001 67.8 ± 9.2 83.0 ± 8.7 < 0.001 Height (m) < 0.001 1.54 ± 0.13 1.57 ± 0.12 0.07 1.64 ± 0.80 1.69 ± 0.05 0.003 BMI (kg/m²) < 0.001 24.8 ± 3.8 30.2 ± 4.5 < 0.001 25.1 ± 3.3 28.8 ± 2.5 < 0.001 SBP (mmHg) 0.138 132.6 ± 17.1 141.8 ± 91.6 0.200 126.5 ± 2.2 135.6 ± 17.7 0.064 DBP (mmHg) 0.006 75.1 ± 10.4 78.3 ± 10.8 0.005 75.9 ± 14.9 77.3 ± 10.7 0.655 MAP (mmHg) 0.032 94.3 ± 11.0 99.5 ± 32.9 0.052 92.7 ± 15.0 96.7 ± 12.1 0.250 HR (bpm) 0.435 79.5 ± 50.0 76.9 ± 12.5 0.485 74.0 ± 11.0 71.0 ± 12.6 0.327 DP (mmHg.bpm) 0.608 10.517 ± 6.2 10.843 ± 6.0 0.611 9.456 ± 2.5 9.709 ± 2.5 0.693 PP (mmHg) 0.280 57.4 ± 11.9 63.2 ± 89.7 0.414 50.6 ± 16.4 58.2 ± 12.4 0.043
MNM 0.013 1.1 ± 1.3 1.4 ± 1.4 0.067 1.7 ± 1.6 1.6 ± 1.4 0.890
NC = neck circumference; BMI = body mass index; SBP = systolic blood pressure; DBP = diastolic blood pressure; MAP = mean arterial pressure; HR = heart rate; DP = double product; PP = pulse pressure; MNM = mean number of medications used by the patients.
ORIGINAL ARTICLE | Coelho Jr. HJ, Sampaio RAC, Gonçalvez IO, Aguiar SS, Palmeira R, Oliveira JF, Asano RY, Sampaio PYS, Uchida MC
Variable Univariate analysis Multivariate analysis
Unadjusted OR 95% CI P-value Adjusted OR 95% CI P-value Age (years)
≥ 75 -0.704
0.262-0.934 0.030 -0.437 0.296-1.407 0.271
< 75 Ref. Ref.
BMI (kg/m²)
≥ 28 2.284
6.013-16.032 < 0.001 2.246 5.697-15.681 < 0.001
< 28 Ref. Ref.
MAP (mmHg)
≥ 95 0.589
1.189-2.733 0.005 0.524 1.032-2.766 0.037
< 95 Ref. Ref.
Hypertension
Yes 0.720
1.341-3.149 0.001 0.572 1.061-2.958 0.029
No Ref. Ref.
DMTII
Yes 1.093
1.626-5.476 < 0.001 0.914 1.237-5.026 0.011
No Ref. Ref.
Arthritis
Yes 0.458
1.018-2.454 0.041 -0.022 0.572-1.673 0.937
No Ref. Ref.
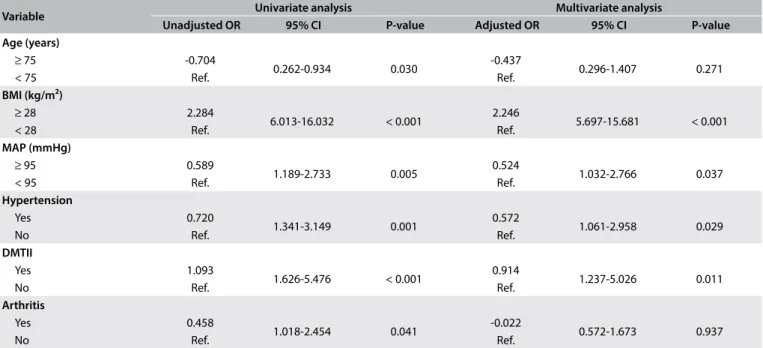
Table 3. Unadjusted odds ratio (OR), adjusted OR and 95% conidence intervals (CI) for neck circumference (NC) among older women
BMI = body mass index; MAP = mean arterial pressure; DMTII = diabetes mellitus type II; CVD = cardiovascular disease; Ref = reference.
Variable Univariate analysis Multivariate analysis
Unadjusted OR 95% CI P-value Adjusted OR 95% CI P-value BMI (kg/m²)
≥ 28 2.613
3.418-54.437 < 0.001 2.613 3.418-54.437 < 0.001
< 28 Ref. Ref.
SBP (mmHg)
≥ 140 1.138
0.944-10.308 0.062 — — —
< 140 Ref. — — —
MAP (mmHg)
≥ 90 0.933
0.967-7.541 0.058 0.873 0.476-12.040 0.289
< 90 Ref. Ref.
Hypertension
Yes 1.163
1.102-9.292 0.032 0.903 0.684-8.897 0.168
No Ref. Ref.
Arthritis
Yes 1.736
1.115-28.871 0.037 1.930 0.934-50.787 0.058
No Ref.
Table 4. Unadjusted odds ratio (OR), adjusted OR and 95% conidence intervals (CI) for neck circumference (NC) in older men
BMI = body mass index; SBP = systolic blood pressure; MAP = mean arterial pressure; Ref = reference.
BMI (< 0.001), MAP (0.005), HTN (0.001), DMTII (< 0.001) and arthritis (0.041) showed signiicant P-values to be added to the logistic binary analyses. In turn, the elderly men presented a lower number of associated variables than the elderly older women: BMI (< 0.001), SBP (0.056), MAP (0.055), HTN (0.030) and arthritis (0.023)
Tables 3 and 4 show the results regarding the unadjusted odds ratio (OR), adjusted OR and 95% CI for NC in both groups (women and men, respectively).
[5.697-15.681]) and elderly men (adjusted OR: 2.613 [3.418-54.437]). However, DMTII (adjusted OR: 0.914 [1.237-5.026]), high MAP (adjusted OR: 0.524 [1.032-2.766]) and HTN (adjusted OR: 0.572 [1.061-2.958]) also showed signiicant results in the group of elderly women.
DISCUSSION
In this study, NC was shown to be a useful screening tool for veri-fying conditions of overweight/obesity through the BMI among elderly women and men, since AUC showed values higher than 0.7 in both groups. Furthermore, these AUC values were higher in relation to NC than in relation to other parameters commonly used to assess body composition, such as WC/HC (AUC: men = 0.68; and women = 0.62). Ater identifying the cutof values for NC (men = 40.5 cm; and women = 35.7 cm) (Figure 1), a second analysis was performed to ascertain the cardiovascular risk factors associated with large NC. he data showed that large NC was associated with high BMI in both groups. Moreover, large NC among elderly women was also associated with high MAP and high prevalences of HTN and DMTII.
hese data seem to be important, given that some authors have suggested that NC is a low-cost, reliable, noninvasive and easy reproducible tool.12,13,17 Furthermore, some parameters that are usually used to evaluate obesity (e.g. waist circumference) can be burdensome to use because of the necessity for extensive training of the evaluators and because of measurement site difer-ences, clothing restrictions, religious and social factors, time taken and weather conditions.14,18,19,27 hese factors may preclude or at least decrease the feasibility of using other parameters (WC and HC).14,18,19,27 On the other hand, these issues seem to be avoided during NC measurement.14,18,19,27
Moreover, it is possible to suggest that NC may be a more suitable means for anthropometric measurements among elderly people than other tools, since its evaluation can be performed with the subject in a seated position, with no need to use light clothing (thereby avoiding awkward moments). In addition, the breathing phase does not change the results. Indeed, older adults may present conditions that impair their capacity to remain in an upright standing position, such as frailty, sar-copenia, osteopenia, osteoporosis, arthritis or different kinds of pain or skeletal muscle weakness. Elderly people may have impaired ability to maintain breathing control (e.g. in cases of chronic obstructive pulmonary disease). They may have reli-gious and/or other beliefs regarding clothing, such as the neces-sity to wear a dress or skirt during measurements, especially among older women.
Studies have been conducted to describe NC cutoff values for factors associated with metabolic syndrome among Brazilian
adults.20,21 However, to our knowledge, our study was the first to ascertain cutoff values for NC in relation to obesity among elderly Brazilians. Thus, because of the lack of studies that aimed to record the association between NC and cardiovascular risk factors among elderly Brazilians, the present discussion is based in both of these studies, which studied samples with a wide age range (i.e. approximately 18-74 years of age).20,21 Interestingly, both of these studies show cutoff values similar to those of our study.20,21 Data from Stabe et al. showed that men and women with NC values larger than 40 cm and 36.1 cm, respectively, had higher odds of presenting show insulin resistance and metabolic syndrome than did adults with small NC.21 Similarly, Baena et al., who studied a sample of 8726 Brazilian adults, showed that men and women with large NC (> 40 cm and > 34.1 cm, respectively) had higher odds of presenting insulin resistance, low HDL, elevated blood pressure and high triglycerides than did the small-NC group.20
Regarding the results from correlating NC with cardiovascular risk factors, other studies conducted using Brazilian samples20,21,28,29 and non-Brazilian samples12,13,17 corroborate our data. hese stud-ies showed that NC is positively associated with fasting triglycer-ide, glucose, insulin, adiponectin, glycated hemoglobin and blood pressure values, carotid intima-media thickness, uric acid levels and plasminogen activator inhibitor levels (PAI-1), as well as neg-atively with HDL-cholesterol values.12,13,17,20,21,28,29
Interestingly, even though the HTN condition was associ-ated with large NC among elderly women, the hemodynamic measurements made at rest in the present study, except for MAP among elderly women, did not show any association with NC. In both community centers, the elderly individuals underwent constant medical monitoring, since blood pressure was mea-sured every day and abnormalities in these measurements were reported immediately to the head nurse. If these measurements were recurrent, the patients would if necessary be referred to a specialist (i.e. a cardiologist). Taken together with data on the MNM (approximately 1.5), this may indicate that the absence of any association between the factors (hemodynamic measurements at rest and NC) was due to control over the clinical parameters (i.e. blood pressure and heart rate) that are associated with man-ifestations of the pathological condition (i.e. HTN). However, despite the use of automatic, noninvasive and validatedarterial blood pressure monitoring,25 blood pressure is not a sensitive hemodynamic measurement and better tools, such as ambula-tory blood pressure monitoring (ABPM) need to be used to make comparisons with our data and provide better understanding about this association.
ORIGINAL ARTICLE | Coelho Jr. HJ, Sampaio RAC, Gonçalvez IO, Aguiar SS, Palmeira R, Oliveira JF, Asano RY, Sampaio PYS, Uchida MC
to be made. As mentioned earlier, cross-sectional studies have been showing that NC is associated with factors present in the genesis of DMTII, such as high fasting glucose, insulin and adi-ponectin, and in the progression of DMTII (i.e. glycated hemo-globin).12,13,17,28,29 Similarly, increased carotid intima-media thick-ness, which is a marker of atherosclerosis and, consequently, associated with hypertension, has been shown to have an asso-ciation with large NC.29
Moreover, it has been suggested that NC is a surrogate marker for upper-body subcutaneous fat,20,21,28,29 which is more lipolytically active than lower body fat,30,31 due to its association with insulin resistance, impaired glucose uptake, atherosclerosis and endo-thelial dysfunction. herefore, higher bioavailability of free fatty acids can be suggested as a common pathway in the relationship between NC and DMTII/HTN.
Some of the limitations of this study include
• the lack of biochemical measurements, which would have had the capacity to lead to better understanding about the association of NC with cardiovascular risk factors among elderly people;
• the limited number of men participating in the research pro-tocol, which may represent bias and limitation on the infer-ences possible;
• use of data in the medical iles to quantify the prevalence of morbidities and drug consumption; and
• lack of cutofs for abnormal NC.
hus, a study design comprising large numbers of non-selected samples and follow-up in order to identify individuals who develop major clinical conditions is necessary. herefore, further studies evaluating larger samples and including biochemical measurements are recommended in order to conirm our indings.
CONCLUSION
Neck circumference is a useful screening tool for detecting overweight/obesity among community-dwelling older adults. Furthermore, it was veriied that large NC is associated with increased cardiovascular risk factors.
REFERENCES
1. United Nations, Department of Economic and Social Affairs, Population Division (2015). World Population Prospects: The 2015 Revision, Key Findings and Advance Tables. Working Paper No. ESA/P/WP.241. Available from: https://esa.un.org/unpd/wpp/ publications/files/key_findings_wpp_2015.pdf. Accessed in 2016 (Oct 11).
2. Coelho Júnior HJ, Aguiar S da S, Gonçalves I de O, et al. Sarcopenia Is Associated with High Pulse Pressure in Older Women. J Aging Res. 2015;2015:109824.
3. Sewo Sampaio PY, Sampaio RA, Coelho Júnior HJ, et al. Diferences in lifestyle, physical performance and quality of life between frail and robust Brazilian community-dwelling elderly women. Geriatr Gerontol Int. 2016;16(7):829-35.
4. Go AS, Mozafarian D, Roger VL, et al. Executive summary: heart disease and stroke statistics--2014 update: a report from the American Heart Association. Circulation. 2014;129(3):399-410.
5. Solé-Auró A, Michaud PC, Hurd M, Crimmins E. Disease incidence and mortality among older Americans and Europeans. Demography. 2015;52(2):593-611.
6. World Health Organization. World health statistics 2015. Geneva: World Health Organization; 2015. Available from: http://apps.who.int/iris/ bitstream/10665/170250/1/9789240694439_eng.pdf?ua=1&ua=1. Accessed in 2016 (Oct 11).
7. Fakhouri TH, Ogden CL, Carrol MD, Kit BK, Flegal KM. Prevalence of obesity among older adults in the United States, 2007-2010. NCHS Data Brief no 106. Hyattsville: National Center for Health Statistics; 2012. Available from: https://www.cdc.gov/nchs/data/databriefs/db106.pdf. Accessed in 2016 (Oct 11).
8. Kelly T, Yang W, Chen CS, Reynolds K, He J. Global burden of obesity in 2005 and projections to 2030. Int J Obes (Lond). 2008;32(9): 1431-7.
9. Dixon JB. The efect of obesity on health outcomes. Mol Cell Endocrinol. 2010;316(2):104-8.
10. Brasil. Ministério da Saúde. Secretaria de Vigilância em Saúde. Departamento de Vigilância de Doenças e Agravos não Transmissíveis e Promoção da Saúde. Vigitel Brasil 2014: vigilância de fatores de risco e proteção para doenças crônicas por inquérito telefônico/ Ministério da Saúde, Secretaria de Vigilância em Saúde, Departamento de Vigilância de Doenças e Agravos não Transmissíveis e Promoção da Saúde. Brasília: Ministério da Saúde; 2015. Available from: http://bvsms. saude.gov.br/bvs/publicacoes/vigitel_brasil_2014.pdf. Accessed in 2016 (Oct 11).
11. Sakuma K, Yamaguchi A. Sarcopenic obesity and endocrinal adaptation with age. Int J Endocrinol. 2013;2013:204164.
12. Ben-Noun L, Laor A. Relationship of neck circumference to cardiovascular risk factors. Obes Res. 2003;11(2):226-31.
13. Ben-Noun L, Sohar E, Laor A. Neck circumference as a simple screening measure for identifying overweight and obese patients. Obes Res. 2001;9(8):470-7.
14. Lou DH, Yin FZ, Wang R, et al. Neck circumference is an accurate and simple index for evaluating overweight and obesity in Han children. Ann Hum Biol. 2012;39(2):161-5.
15. Naiu OO, Burke C, Lee J, et al. Neck circumference as a screening measure for identifying children with high body mass index. Pediatrics. 2010;126(2):e306-10.
17. Preis SR, Massaro JM, Hofmann U, et al. Neck circumference as a novel measure of cardiometabolic risk: the Framingham Heart study. J Clin Endocrinol Metab. 2010;95(8):3701-10.
18. Gonçalves VSS, Faria ER, Franceschini SCC, Priore SE. Perímetro do pescoço como preditor de excesso de gordura corporal e fatores de risco cardiovascular em adolescentes [Neck circumference as predictor of excess body fat and cardiovascular risk factors in adolescents]. Rev Nutr. 2014;27(2):161-71.
19. Hatipoglu N, Mazicioglu MM, Kurtoglu S, Kendirci M. Neck circumference: an additional tool of screening overweight and obesity in childhood. Eur J Pediatr. 2010;169(6):733-9.
20. Baena CP, Lotufo PA, Fonseca MG, et al. Neck Circumference Is Independently Associated with Cardiometabolic Risk Factors: Cross-Sectional Analysis from ELSA-Brasil. Metab Syndr Relat Disord. 2016;14(3):145-53.
21. Stabe C, Vasques AC, Lima MM, et al. Neck circumference as a simple tool for identifying the metabolic syndrome and insulin resistance: results from the Brazilian Metabolic Syndrome Study. Clin Endocrinol (Oxf ). 2013;78(6):874-81.
22. Corona LP, Pereira de Brito TR, Nunes DP, et al. Nutritional status and risk for disability in instrumental activities of daily living in older Brazilians. Public Health Nutr. 2014;17(2):390-5.
23. World Health Organization. Waist circumference and waist-hip ratio: report of a WHO expert consultation. Geneva, 8-11 December 2008. Available from: http://apps.who.int/iris/ bitstream/10665/44583/1/9789241501491_eng.pdf. Accessed in 2016 (Oct 11).
24. Chobanian AV, Bakris GL, Black HR, et al. The Seventh Report of the Joint National Committee on Prevention, Detection, Evaluation, and Treatment of High Blood Pressure: the JNC 7 report. JAMA. 2003;289(19):2560-72.
25. Cuckson AC, Reinders A, Shabeeh H, Shennan AH; British Hypertension Society. Validation of the Microlife BP 3BTO-A oscillometric blood pressure monitoring device according to a modified British Hypertension Society protocol. Blood Press Monit. 2002;7(6):319-24.
26. Hosmer DW, Hosmer T, Le Cessie S, Lemeshow S. A comparison of goodness-of-it tests for the logistic regression model. Stat Med. 1997;16(9):965-80.
27. Raitakari OT, Juonala M, Viikari JS. Obesity in childhood and vascular changes in adulthood: insights into the Cardiovascular Risk in Young Finns Study. Int J Obes (Lond). 2005;29 Suppl 2:S101-4.
28. Jamar G, Pisani LP, Oyama LM, et al. Is the neck circumference an emergent predictor for inlammatory status in obese adults? Int J Clin Pract. 2013;67(3):217-24.
29. Baena CP, Lotufo PA, Santos IS, et al. Neck circumference is associated with carotid intimal-media thickness but not with coronary artery calcium: Results from the ELSA-Brasil. Nutr Metab Cardiovasc Dis. 2016;26(3):216-22.
30. Jensen MD. Gender diferences in regional fatty acid metabolism before and after meal ingestion. J Clin Invest. 1995;96(5):2297-303. 31. Votruba SB, Jensen MD. Regional fat deposition as a factor in FFA
metabolism. Annu Rev Nutr. 2007;27:149-63.
Sources of funding: None
Conlict of interest: None
Date of irst submission: June 24, 2016
Last received: July 21, 2016
Accepted: September 11, 2016
Address for correspondence:
Hélio José Coelho Júnior
Laboratório de Cinesiologia Aplicada, Escola de Educação Física, Universidade de Campinas (UNICAMP)
Av. Érico Veríssimo, 701 — Cidade Universitária Zeferino Vaz Barão Geraldo — Campinas (SP) — Brasil
CEP 13083-851 Tel. (+55 19) 35216788