ATUALIZAÇÕES / CURRENT COMMENTS THE POPULATION OF BRAZIL *
João YUNES **
RSPSP-152
YUNES, J. — The population of Brazil Rev. Saúde públ., S. Paulo, 6:393-404, 1972.
SUMMARY: In 1970 the population of Brazil with 94,508,554 inhabitants was extreme youth, since 42.67% was composed of children under 14 years old. In that year the proportion of female was 50.2%. The population density in-creased from 1.17 inhabitants /km2 in 1872 to 11.18 in 1970, and in this last year the range was 1.03 in the North region and 43.90 in the South-East region. The urban population increased from 31.24% in 1940 to 55.98% in 1970 and for the first time the rural population was smaller than the urban population. In 1950 concerning with marital status 39% of the population 15 years old and over was single and 54% married. In 1970 this rate was respectively 35.4% and 56.6%. The population economically inactive increased from 49.17% in 1940 to 52.24% in 1970. The literacy ratio increased from 43% in 1940, to 48% in 1950 and 68.04% in 1970. The crude birth rate was 43/1000 live births in 1950 and fell to 37.7/1000 in 1970. The fertility ra-te decreased from 179.3/1000 women (15-49 years old} to 156.7/1000 in 1960/70. The crude death rate decreased from 20.60/1000 inhabitants in 1940/50 to 9.4/1000 in 1960/70. The infant mortality rate still remains high: 171/1000 live births in 1940/50 and 170/1000 in 1971. Concerning with the size of the cities, 8 in 1940 had 100,000 or more inhabitants and in 1970 this number increased to 94 cities. The population growth increased from 2.38% in 1940/50, to 2.99% in
1950/60 and 2.83% in 1960./70. Brazil is the first country in population size in Latin America and the eighth in the world. Concerning his area, Brazil is the fifth country in size.
UNITERMS: Population*; Brazil*.
* This paper was presented at the United Nations Meeting: Inter-Regional Seminar on Aplica-tion of Demographic Data and Studies to Development Planning. Kiev, 1969 — In this work the data were up to date.
** From the "Centro de Estudos de Dinâmica Populacional — Faculdade de Saúde Pública, USP, Av. Dr. Arnaldo, 715 — S. Paulo, Brasil»; from the "Disciplina de Pediatria Social da Faculdade de Medicina USP"; from the "Divisão de Epidemiologia da Secretaria do Estado de São Paulo."
1 — I N T R O D U C T I O N
This study will present the outstand-ing demographic data up to 1971. The method to be employed in the analysis of the data will be the demographic technics.
2 — BRAZILIAN POPULATION'S STRUCTURE
2.1 — Sex and Age
The basic structure of a population is represented by the population pyramid, a graphic which shows us the total sex and age distribution of a given popula-tion. In underdeveloped countries such as Brazil, the base of the pyramid is wide because of high fertility, and it narrows rapidily because of high mortality.
2.2 — Ethnic composition
The ethnic composition is summarized according to Table 2.
Between 1940 and 1950 the rate of both races white and black declined, while that of the called "pardos", increased, suggesting a higher rate of natural in-crease or that miscegenation is contin-uing. Since the Figures are based on individual declarations, the number of white may be exaggerated, and a lighter number blacks may also swell the reported mulattoes7. In 1970 the Census
of the racial composition was not included and there are no published results on the Census of 1960.
2.3 — Territorial Distribution
Brazilian population density increased from 4.88 inhabitants per square ki-lometer (sq. km.) in 1940 to 6.14 in 1950, and from 8.39 in 1960 to 11.18 in 1970. Due to economical, historical and
geo-graphical factors, the population is irregularly distributed. According to Ta-ble 3 since 1872 the demographic density increased from 1.17 to 11.18 in 1970.
The major concentration of the popu-lation is along the coast, with one-third of the territory containing 93% of the population. Variation by states is also considerable. The highest density in 1960 was present in the state, of Gua-nabara, practically a city state, contain-ing Rio de Janeiro, with 2,824 persons per sq. km, and 3,685 inhabitants per sq. km. in 1970.
The lowest was that of Roraima, with 0,13 persons per sq. km in 1960 and 0,18 in 1970.
The Regional density is showed in Table 4.
Suburban populations are included in the urban category. For the first time the Census in Brazil showed a urban population bigger than a rural one. 2.4 — Nationality
According to NEIVA7 "in 1920, 5% of
the total population were foreigners and naturalized Brazilians; by 1950, the fi-gure had declined to 2%. These fifi-gures show the effect of declining migration and the small demographic influence of the foreign-born. In absolute numbers, the foreign-born and naturalized declined from 1,565,961, in 1920, to 1,406,568, in 1940 and 1,214,184 in 1950. In the latter year, 867,118 lived in the South, and 296,870 in the East. Twenty-eight per cent were Portuguese, 20% Italian, 11% Spaniards, 11% Japanese, 7% Germans and Austrians, 4% Poles, 4% Russians and Baits and 4% Syrians and Lebane-se". Figures for 1960 and 1970 was not avaiable.
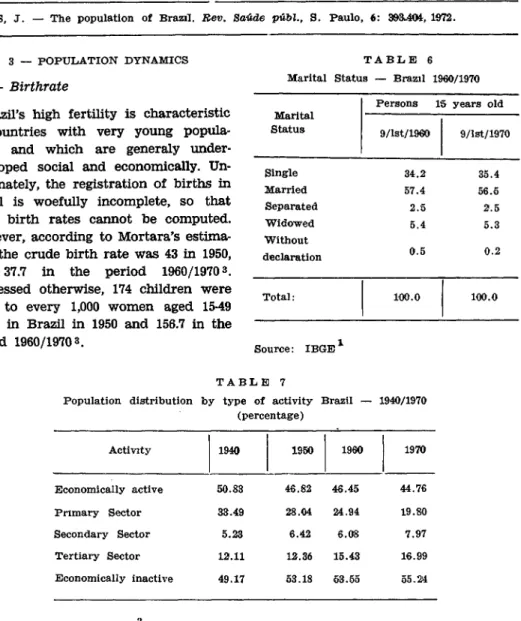
2.5 — Marital Status
According to NEIVA7 "in 1950, 39% of
the population had 15 years of age and over was classified as single, 54% married, and 7% widowed. However, because of defects in registration these figures reveal only part of the situation. Moreover, since there is no divorce in Brazil, many married people live sepa-rately, and others declare themselves married when living in common law unions. This is apparent from the different number of men and women who declared themselves ever married and with a living spouse". In 1970, 35.4% of the population over 15 years old was classified assingle, 56.6% married, and 5.3% widowed according to Table 6. 2.6 — Economic Activity
The economically Brazilian population is defined as those who take part into the production of economic goods and service. (Housewives, students, retired workers and children under ten years
old are excluded). The active population is divided into three basic sectors of economic activity: the primary sector (agriculture, animal husbandry, fores-try and extractive industries such as mining, fishing, etc.); the secondary sector (industries of transformation); and the tertiary sector (trade services, public administration, defense and the professions).
Between 1940 and 1970 the decrease in primary sector activities and the other sectors, mainly the tertiary, indi-cates the trend towards the development in Brazil (Table 7). The increase of the population economically inactive can indicate a higher proportion of persons in schools that follow urbanization system. Consequently it indicates a lower proportion of persons working.
2.7 — Literacy
In 19407, 43% of the population over
ten years old was literate (43% for males and 38% for females). By 19508, the rate increased to 48%, with males at 53% and females at 44%. Urban areas were 79% literate, as opposed to 62% in the suburban areas and 32% in the rural. In 1960 the ratio of literacy was 60.63% and 68.04% in 1970.
The most interesting difference is by state. In Guanabara, the literacy rate was 85% in 1950. In the South, Rio Gran-de do Sul, São Paulo, Santa Catarina and Parana States had rates of 66%, 65%, 64% and 53% respectively. On the other hand the figures for the States Paraiba is 29%; Piaui 26%; Maranhão 25% and Alagoas 24%, all in the Northeast. The other three states of this region (Ceará, Rio Grande do Norte and Pernambuco) each of them having rates of about 32% 7.
3 — POPULATION DYNAMICS
3.1 — Birthrate
Brazil's high fertility is characteristic of countries with very young popula-tions, and which are generaly under-developed social and economically. Un-fortunately, the registration of births in Brazil is woefully incomplete, so that exact birth rates cannot be computed. However, according to Mortara's estima-tes 6 the crude birth rate was 43 in 1950,
and 37.7 in the period 1960/1970 3. Expressed otherwise, 174 children were born to every 1,000 women aged 15-49 years in Brazil in 1950 and 156.7 in the period 1960/19703.
Table 9 describe this trend by age. In summary, Brazil's high fertility patterns are due to women who begin their reproduction activities early and continue them intensively during their childbearing period. Also, they may reflect the traditional attitude and the socio-cultural values toward childbea-ring.
3.2 — Mortality
The registration of deaths is very deficient in Brazil. For this reason, it is
1950, as estimated by Mortara5, was 43.7 years (41.5 for men and 46.0 for women) for the whole of Brazil, while
it was 54.2 (52.4 and 56.0 for men and
figures described before according to the Table 10 and 11.
3.3 — Natality
The crude birth rate in Brazil is high and the rate remains high with a very small decrease. This factor is the main responsible for the population growth. From 1940 to 1950 the birth rate was 43.2%0 and from 1960 to 1970 this rate fell to 37.73%0.
life expectancy at birth in 1963 was 60.84 years9. In 1970 in Brazil, the life expectancy was 61.10 years for women and 57.01 for men and in the state of São Paulo was 65.0 years for women and 51.2 for men8, in 1970 the estima-tion of death rate was 9.4/1000 (10.5 for men and 8.3 for women).
Death and birth registration had been improving in Brazil. Data are broken down in fashion similar to fertility breakdowns, but in addition there are breakdowns by cause of deaths.
Because of the dependence on ade-quate registration of births and deaths of infant mortality have to be inter-preted with care. Almost all that can be said is that it is so high as to constitute a national scandal. For 1940/50, MORTA-RA5 estimated it to be about 171. But, he also indicated that it was declining perhaps coming down to 160 in the early Fifties. To 1960 the Infant Morta-lity in Brazil was estimated in 120%0. As noted earlier, however, this average rate is mesleading. In 1971 this ratio was estimated in 170/1000, while the 1968 infant mortality rate was 72 in the state of São Paulo and 67 in Rio de Janeiro in the South, 246.3 in the county of Teresina in the Northeast.
Table 12 compares the Crude Birth Rate with Crude Death Rate, since 1940
to 1970.
4 — GROWTH
According to NEIVA8 "Brazilian popu-lation growth has been conditioned by the rambling path of its history. When discovered in 1500, Brazil was inhabited by about a million Indians. For three centuries after 1559, African slaves were imported in large numbers. Estimates of the number range from 2,300,000 to
a highly exaggerated 16,000,000 a reaso-nable approximation being about... 4,700,000 for the three centuries. Peopling of the country was initially very slow; current estimates suggest 15,000 Europeans and their slaves by
1550; around 57,600 by 1585; perhaps 100,000 by 1600; and by 1690 — the year of the discovery of the first gold pla-cers-close to 300,000. In the eighteenth century, with the gold rush, the popu-lation grew twelve-fold. This was due not only to migration, but to increased area of settlemet which included considerable numbers of Indians.
These factors speeded up the process of miscegenation and acculturation. MORTARA estimates Brazil's population as 2,500,000 in 1770-1771, and 3,660,000 by 1800-01. Almost certainly these figures should be revised downward, since, when they were computed, the 1920 census data had not been corrected. But even if the population increase in the eighteenth century was ten-fold rather than twelve-fold, this was cer-tainly the take-off century for Brazilian population growth. Half a century later, 1851, the population is estimated to have been 7,340,000. In 1872 the first Brazilian census was taken 7.
The results of the succeeding censuses are given in Table 13.
mor-tality, this rate was 2.99% in 1950/60 and 2.83% in 1960/70. Whereas the po-pulation had increased by 26% between 1940 and 1950, it increased by 37% between 1950 and 1960 and 23.7% between 1960 and 1970.
However rapid the increase in total population, urban growth has been also greater in recent years. "From 1940 to 1950 the urban (including suburban) population increased 46% or over 5,900,000 persons, while the rural only
increased about 17% or 3,800,000 people. From 1950 to 1960, the urban increase was 13,208,047, or 70% and the rural 5,814,741 or 18%. The urban increase was thus 69% of the total. This enormously enhanced the number and importance cities" 7. For instance, Rio de Janeiro
The number of cities of all sizes has grown markedly in the past three de-cades. For instance in 1940 there were only 18 cities with the population size between 25,000 to 50,000 inhabitants, and in 1970 there were 826.
Table 14 illustrates this phenomenal growth.
RSPSP-152
YUNES, J. — [População do Brasil] Rev.
Saúde públ., S. Paulo, 6:393-404, 1972.
RESUMO: A população do Brasil em 1970 com 94.508.554 habitantes pode ser consi-derada jovem, uma vez que 42,67% tem menos de 14 anos de idade. A proporção de mulheres no ano censitário foi de 50,2%. A densidade populacional aumen-tou de 1,17 habitantes/km2 em 1872 para 11,18 em 1970 e a variação foi de 1,03 para a Região Norte para 43,90 na Região Su-deste. A população urbana aumentou de 31,29% em 1940 para 55,98% em 1970 e pela primeira vez a população rural foi menor que a urbana. Em relação ao esta-do civil 39% da população com mais de 15 anos de idade era solteira e 54% casa-da em 1950. Em 1970 esta proporção eco-nomicamente inativa aumentou de 49,17% em 1940 para 52,24% em 1970. A taxa de alfabetização aumentou de 43% em 1940, para 48% em 1950 e 68,04% em 1970. A natalidade foi de 43/1000 em 1950 e caiu para 37,7/1000 em 1970. A taxa de fertilidade descreveu de 179,3/1000 mu-lheres (-15-49 anos) para 156,7/1000 em 1960/70. A mortalidade geral decresceu de 20,60/1000 habitantes no decênio de 1940/50 para 9,4/1000 em 1960/70. A mor-talidade infantil permanece ainda alta: 171/1000 nascidos vivos em 1940/50 para 170/1000 em 1971. Em relação ao tamanho da população por município, 8 cidades em 1940 tinham 100.000 habitantes ou mais e em 1970 este número aumentou para 94 municípios. A taxa de crescimen-to populacional aumencrescimen-tou de 2,38% no de-cênio de 1940/50 para 2,99% em 1950/60 e 2,83% em 1960/70. O Brasil é o primeiro país em tamanho populacional na Améri-ca Latina e o oitavo do mundo. Em rela-ção à área é o quinto país em tamanho.
UNITERMOS: População *; Brasil *.
REFERENCES
1. FUNDAÇÃO INSTITUTO BRASILEIRO DE GEOGRAFIA E ESTATÍSTICA (IBGE) — Sinopse preliminar do censo demo-gráfico. Rio de Janeiro, Ministério do Planejamento e Coordenação Geral, 1970. (VIII Recenseamento Geral do Brasil, 1970).
2. FUNDAÇÃO INSTITUTO BRASILEIRO DE GEOGRAFIA E ESTATÍSTICA (IBGE) — Tabulações avançadas do censo demo-gráfico. Rio de Janeiro, 1970. (VIII Re-censeamento Geral do Brasil, 1970).
3. MADEIRA, J. L. — O IBGE e os estudos na fecundidade no Brasil [Trabalho apresentado na XXIV Reunião Anual da Sociedade Brasileira para o Progresso da Ciência, São Paulo, julho, 1972]. 4. MARTINS, M. — Estimativas da população
presente, no Brasil, em 1.o de setembro de 1960 e 1970, segundo as unidades da Federação. Rev. bras. Est., 32: 357-65, 1971.
5. MORTARA, G. — Dados e conjeturas sobre a mortalidade no Brasil. In: BRASIL. Conselho Nacional de Estatstica — Pes-quisas sobre a mortalidade no Brasil, 2.a série. Rio de Janeiro, 1954. p. 7-12.
6. MORTARA, G. — Natalidade, fecundidade e prolificidade na América Latina. Rev.
bras. Est., 23:1-23, 1962.
7. NEIVA, A. H. — The population of Brazil. In: STYCOS, J. M. & ARIAS, J. ed. — Population dillema in Latin Ameri-ca. Washington, D.C., Potomac Books, 1966.
8. SANTOS, J. L. F. — Estimativas do nível de mortalidade e de esperança de vida para o Estado de São Paulo em 1970.
Rev. Saúde públ., S. Paulo, 6:269-72, 1972.
9. YUNES, J. — Os níveis de saúde no Muni-cípio de São Paulo de 1961-1967. Rev. Saúde públ., S, Paulo, 3:41-50, 1969.
Received for publication in 2-10-1972