ABSTRACT:Objective: To evaluate the prevalence and associated factors of doing clinical breast examinations (CBE) and mammogram (MMG) in the Southern and Northeast Brazilian regions, focusing on some social inequalities. Methods: This is a cross-sectional study using data from the 2008 National Household Sampling Survey (PNAD). We evaluated the prevalence of CBE during the last year and of the MMG in the last two years, which were analyzed based on demographic (age, skin color, and marital status) and socioeconomic (income and schooling) variables. Gross and adjusted prevalence ratios were obtained using Poisson regression models. All analyses were stratiied by region. Results: The sample comprised 27,718 women aged 40 to 69 years. Less than a half of the women followed the recommendation of annual CBE performance in both the regions. The MMG prevalence during the last two years was 58.6 and 45.5% for the Southern and Northeast regions, respectively. More than a quarter of the women had never had a MMG (26.5% in the Southern and 40.6% in the Northeast regions). Not having performed both examinations was almost two times higher in the Northeast region (29.7%) when compared with the Southern (15.9%). The risk for not having performed both examinations was greater among nonwhite women, aged 60 to 69 years, with lower schooling level and family income. Conclusion: Important inequalities were seen between the Southern and Northeast regions for CBE and MMG. Health public policies should prioritize the most vulnerable groups to reduce these inequalities. Keywords: Health inequalities. Mammogram. Breast neoplasms. Women’s health. Neoplasms. Mass screening.
Clinical breast examination and mammography:
inequalities in Southern and Northeast Brazilian regions
Exame clínico das mamas e mamograia:
desigualdades nas regiões Sul e Nordeste do Brasil
Zaida da Silva BorgesI, Fernando César WehrmeisterI, Ana Paula GomesI, Helen GonçalvesI
IGraduate Program in Epidemiology , Universidade Federal de Pelotas – Pelotas (RS), Brazil.
Corresponding author: Helen Gonçalves. Rua Marechal Deodoro, 1160, 3° andar, CEP: 96220‑220, Pelotas, RS, Brasil. E‑mail: [email protected]
Conlict of interests: nothing to declare – Financial support: none.
INTRODUCTION
The World Health Organization estimates that there will be, in 2030, 27 million cases of all kinds of cancer, 17 million deaths, and 75 million people living with this disease per year in all the world1. Breast cancer is a neoplasm with higher incidence and mor-tality rate among women in Brazil (with the exception of the Northern regions) and the second most common in the world2. Breast cancer issue has become important in the political and technical schedules in health, thus enabling that the recommendations for the identification of new cases and prevention are updated based on the magnitude and impact of such disease on the population1,3,4.
The Brazilian Department of Health develops the recommendations for early detec-tion and monitoring of breast cancer3. Currently, a clinical breast examination (CBE) is an annual investigation recommended for women aged 40 to 49 years for an early detection. For 50 to69-year-old women, the CBE is still an annual recommendation, in addition to the mammogram (MMG) performance every 2 years. For women with high risk for breast cancer, the best management should be assessed by the doctor5. The strategies are simple and easy to perform; therefore, they should be a priority for the disease monitoring4. The early detection of breast cancer can avoid about 30% of the deaths owing to this condition6.
According to data from the 2003 National Household Sampling Survey (PNAD), almost a half of 50 to 69-year-old women (49.3%) have never had a MMG in life, and around
RESUMO:Objetivo: Avaliar a prevalência e os fatores associados à realização do exame clínico das mamas (ECM) e da mamograia (MMG) nas regiões Sul e Nordeste do Brasil, focando em algumas desigualdades sociais. Métodos: Estudo transversal, utilizando dados da Pesquisa Nacional por Amostra de Domicílios, de 2008. Foram avaliadas as prevalências de realização de ECM durante o último ano e de MMG nos últimos dois anos e analisadas conforme variáveis demográicas (idade, cor da pele e estado civil) e socioeconômicas (renda e escolaridade). As razões de prevalência brutas e ajustadas foram obtidas através de regressão de Poisson. As análises foram estratiicadas por região. Resultados: Foram avaliadas 27.718 mulheres, entre 40 e 69 anos. Menos da metade das mulheres seguiu a recomendação de realização anual de ECM em ambas as regiões. A prevalência de realização de MMG nos últimos 2 anos foi de 58,6 e 45,5% para a região Sul e a Nordeste, respectivamente. Mais de um quarto das mulheres avaliadas de ambas as regiões nunca realizaram MMG (26,5% no Sul e 40,6% no Nordeste). Nunca ter realizado ambos os exames foi quase duas vezes mais prevalente na região Nordeste (29,7%) do que na região Sul (15,9%). O risco para a não realização de ambos os exames foi maior em mulheres com idades entre 60 e 69 anos, não brancas, com menor escolaridade e com menor renda familiar. Conclusão: Importantes desigualdades foram observadas entre as regiões Sul e Nordeste para o ECM e a MMG. Políticas públicas de saúde devem priorizar grupos mais vulneráveis para reduzi-las.
35% of women older than 40 years have never performed a CBE7,8. In 2008, about 40% of women aged 40 years or older performed a CBE in the last year, and 54% of 50 to 69-year-old women had a MMG in the last 2 years, as preconized by the Brazilian Department of Health3,9. With regard to the last examination, almost half of it was performed in women aged 50 to 69 years old9. Even though the percentages show an increase in the performance of preventive examinations by women, if we compare these data to those obtained in the 2003 PNAD10, the Brazilian reality is far from reaching most women who need monitor-ing, as preconized by the Brazilian Policy of Oncological Care11.
Population-based studies showed the existence of significant socioeconomic, racial, and regional inequalities, among other differences in the performance of preventive
examinations12,13. In summary, they showed that the most privileged women in the
performance of examinations are white women with higher acquisitive power, liv-ing in the wealthiest regions of the country, with a higher schoolliv-ing level and who have a spouse. On the basis of these data, the less socioeconomically privileged pop-ulation still remains an important focus for the Healthy Policy still current in the country10,14. The survival of a hearable cancer, such as breast cancer, is deeply and positively related to the country income, offer opportunity, monitoring effectiveness of this neoplasm and the socioeconomic development of these regions in the coun-try15. Therefore, the evaluation of inequalities among the Brazilian regions, with regard to preventive examinations performance, such as the CBE and MMG, is a rel-evant datum for health institutions.
The Southern and Northeast regions are admittedly different in economic, social, and cultural terms. Thus, they are both the target for analysis of this study, whose objective is to evaluate the CBE and MMG prevalence and the factors associated with its performance in women aged 40 to 69 years living in such locations.
METHODS
This cross-sectional population study used secondary data from the PNAD con-ducted in the year of 2008 by the Brazilian Institute of Geography and Statistics (IBGE)9. In such year, additional information about the health characteristics of local residents was collected to identify possible regional inequalities, including data about the CBE and MMG performance.
The PNAD is carried out through a probabilistic sample of households obtained during three stages: municipalities, censor sectors, and house units. The sample is sig-nificant for Brazil, for great regions, for states and 10 metropolitan areas. In 2008, the
survey included 150,591 households with 391,868 interviewed subjects9. This study,
however, used information regarding the 40 to 69-year-old female population, from the Brazilian Southern and Northeast regions, in the referred survey year.
of the <interviewed subject>?” were categorized in 1 year or less than a year (follows the recommendation), in more than a year (did it in less time), and never had it (never
had it). The 2004 Consensus3 considers adequate breast cancer monitoring through
CBE in a yearly basis after 40 years for women without risk and 35 years or older for those at risk of developing the disease. For the MMG, the question “When was the last time the <interviewed subject> had a mammogram?” generated answers that were catego-rized in: 2 or less years (follows the recommendation), more than 2 years (did it in less time), and never had it (never had it). If the examination was performed in a period of 2 or less years from age 50, it was adequate.
The demographic characteristics (age, skin color, marital status, socioeconomic level, and schooling) were independent variables. The age variable was grouped in three groups: 40 to 49; 50 to 59; and 60 to 69 years. Skin color — based on IBGE estab-lishments and self-declared by the interviewed — was once more categorized as white and nonwhite owing to the low rates in the categories of yellow color and indige-nous. Marital status was divided into with and without a spouse, being self-declared by the interviewed. The socioeconomic level was investigated following the score of the Classification from the Brazilian Association of Survey Companies (ABEP)16 and divided into quintiles. Schooling was categorized in complete years of study, such as: none; from 1 to 4; from 5 to 8; and 9 or more.
The statistical analyzes were conducted using the Stata 12.1 program (Statcorp, Texas), with description and prevalence of CBE and MMG divided by the Southern and Northeast regions. Bivariate analyzes were carried out using Pearson χ2 and lineal tendency tests (if needed) between exposures and outcomes. The gross and adjusted prevalence rates were obtained through Poisson regression. The adjusted analysis for each region (Southern and Northeast) and for every outcome (non-performance of CBE, of MMG or of both), separately, was done considering all independent variables at the same time in the model. Because this is a complex sample, sampling weights and study outline effect were considered in the analysis. The work was submitted to the Research Ethics Committee of the School of Medicine from Universidade Federal de Pelotas for knowledge and approved according to protocol number 467,419 from October 2013.
RESULTS
*Maximum number of ignored values: income variable (301 – Southern region and 440 – Northeast region)
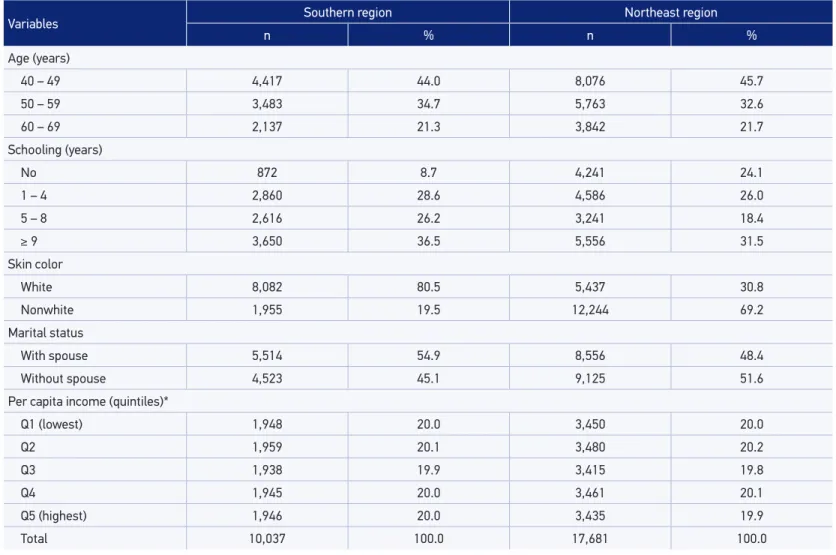
Table 1. Distribution of the sample according to socioeconomic and demographic characteristics in the Brazilian Southern and Northeast regions. 2008 Brazilian Survey by House Sample.
Variables Southern region Northeast region
n % n %
Age (years)
40 – 49 4,417 44.0 8,076 45.7
50 – 59 3,483 34.7 5,763 32.6
60 – 69 2,137 21.3 3,842 21.7
Schooling (years)
No 872 8.7 4,241 24.1
1 – 4 2,860 28.6 4,586 26.0
5 – 8 2,616 26.2 3,241 18.4
≥ 9 3,650 36.5 5,556 31.5
Skin color
White 8,082 80.5 5,437 30.8
Nonwhite 1,955 19.5 12,244 69.2
Marital status
With spouse 5,514 54.9 8,556 48.4
Without spouse 4,523 45.1 9,125 51.6
Per capita income (quintiles)*
Q1 (lowest) 1,948 20.0 3,450 20.0
Q2 1,959 20.1 3,480 20.2
Q3 1,938 19.9 3,415 19.8
Q4 1,945 20.0 3,461 20.1
Q5 (highest) 1,946 20.0 3,435 19.9
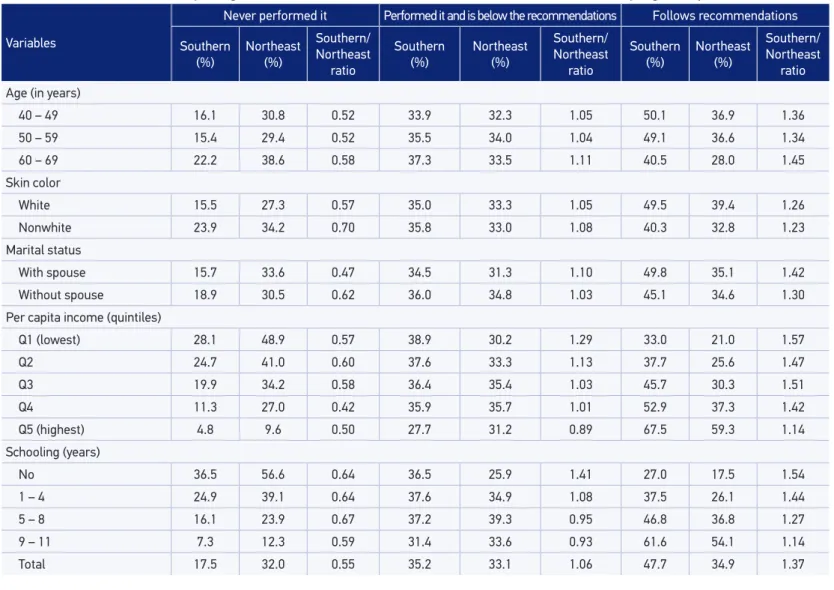
Table 2. Description and prevalence of clinical breast examination (never performed it, performed it and is below the recommendations, and follows recommendations) per region and Southern/Northeast ratio. 2008 National Household Sampling Survey.
Variables
Never performed it Performed it and is below the recommendations Follows recommendations
Southern
(%) Northeast (%)
Southern/ Northeast
ratio
Southern
(%) Northeast (%)
Southern/ Northeast
ratio
Southern
(%) Northeast (%)
Southern/ Northeast
ratio
Age (in years)
40 – 49 16.1 30.8 0.52 33.9 32.3 1.05 50.1 36.9 1.36
50 – 59 15.4 29.4 0.52 35.5 34.0 1.04 49.1 36.6 1.34
60 – 69 22.2 38.6 0.58 37.3 33.5 1.11 40.5 28.0 1.45
Skin color
White 15.5 27.3 0.57 35.0 33.3 1.05 49.5 39.4 1.26
Nonwhite 23.9 34.2 0.70 35.8 33.0 1.08 40.3 32.8 1.23
Marital status
With spouse 15.7 33.6 0.47 34.5 31.3 1.10 49.8 35.1 1.42
Without spouse 18.9 30.5 0.62 36.0 34.8 1.03 45.1 34.6 1.30
Per capita income (quintiles)
Q1 (lowest) 28.1 48.9 0.57 38.9 30.2 1.29 33.0 21.0 1.57
Q2 24.7 41.0 0.60 37.6 33.3 1.13 37.7 25.6 1.47
Q3 19.9 34.2 0.58 36.4 35.4 1.03 45.7 30.3 1.51
Q4 11.3 27.0 0.42 35.9 35.7 1.01 52.9 37.3 1.42
Q5 (highest) 4.8 9.6 0.50 27.7 31.2 0.89 67.5 59.3 1.14
Schooling (years)
No 36.5 56.6 0.64 36.5 25.9 1.41 27.0 17.5 1.54
1 – 4 24.9 39.1 0.64 37.6 34.9 1.08 37.5 26.1 1.44
5 – 8 16.1 23.9 0.67 37.2 39.3 0.95 46.8 36.8 1.27
9 – 11 7.3 12.3 0.59 31.4 33.6 0.93 61.6 54.1 1.14
Table 2 presents the CBE prevalence based on the recommendations of the Brazilian Department of Health. It was seen that less than a fifth (17.5%) of women from the Southern had never performed a CBE against 32.0% of those living in the Northeast. Furthermore, in both regions, women who had never had or had had and are below the recommendations for breast cancer prevention were aged between 60 and 69 years and showed a family income lower than those following the recommendations. The group below recommendations was very similar in both evaluated regions. In this Table, we can see that in the Northeast region, women living with a spouse were the group with the highest rate of having never performed a CBE, and the highest percentages for women who were below recommendations had more schooling and higher income levels.
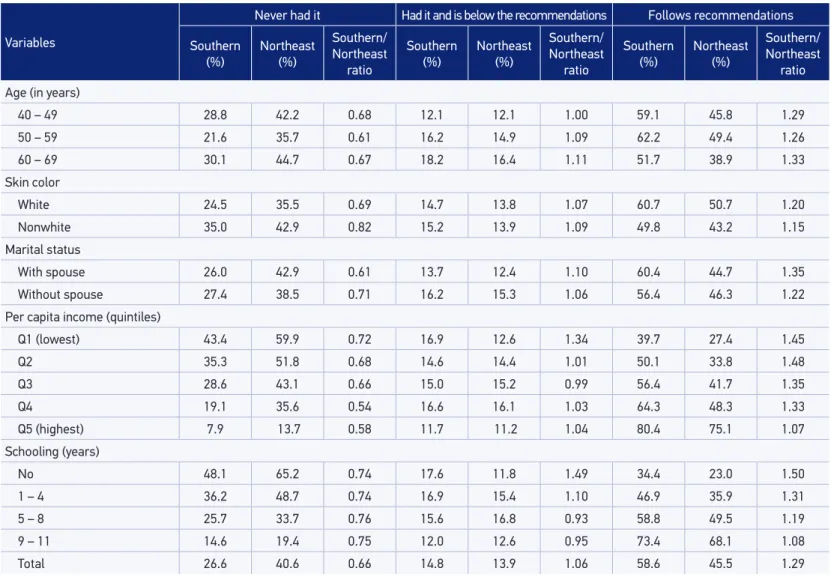
Less than a half of the evaluated women and resident in the Northeast region (45.5%) followed the recommendations to have a MMG, while more than a half (58.6%) of the women from the Southern region performed these same procedures (Table 3). White women aged 50 to 59 years, richer, and with higher schooling level were the ones who most followed the recommendations for MMG. About 40.6% of the Northeast women who had never had a MMG was reported against 26.6% of those in the Southern region. By comparing the regions, women with higher schooling level from the Northeast presented more prevalence of being below the recommendations than those in the Southern. Women living with a spouse followed fewer recommendations than those without a spouse, and women living with a spouse had a higher percentage of having never had a MMG than their group of comparison.
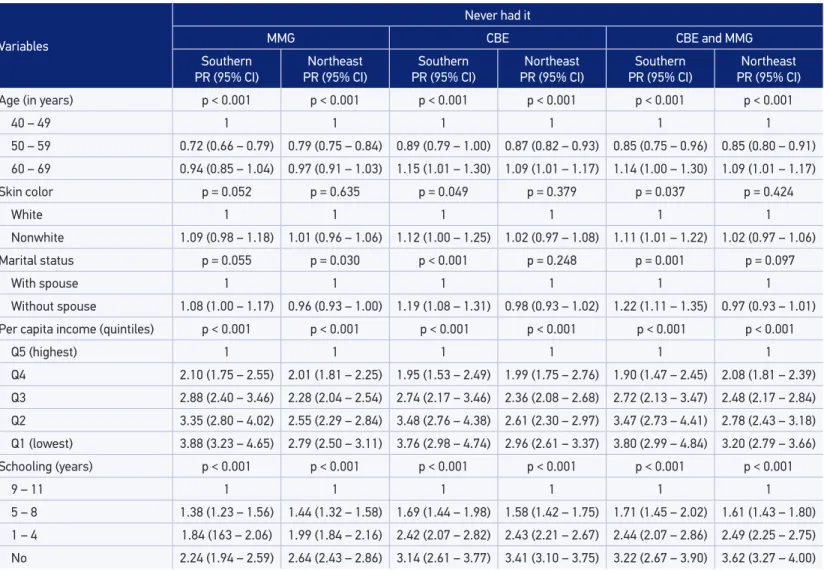
In addition, in the group of women who had never had a MMG and/or CBE (Table 4), the highest risk for nonperformance of these examinations in both regions was found among poorer and less-schooled women.
In the evaluation of the rate of women from both regions that had never performed the analyzed examinations, those living in the Northeast region had the highest preva-lence of never performing the CBE, MMG, or CBE and MMG. The prevapreva-lence of having never performed any examinations is almost the double in women from the Northeast (30%) than in the Southern (16%) (data are not presented).
DISCUSSION
Since 1998, the PNAD has regularly analyzed important health indicators of the Brazilian population. The use of secondary data sources provides accurate and repre-sentative estimations for the Brazilian macroregions, thus creating valuable information for planning actions in public health, such as data related to women’s health.
Although the prevalence of MMG and CBE conduction has increased when
com-pared with the estimative obtained by PNAD in 200310, this study showed that the
Table 3. Description and prevalence of Mammogram (never had it, had it and is below recommendations, and follows recommendations) per region and Southern/Northeast ratio. 2008 National Household Sampling Survey.
Variables
Never had it Had it and is below the recommendations Follows recommendations
Southern (%)
Northeast (%)
Southern/ Northeast
ratio
Southern (%)
Northeast (%)
Southern/ Northeast
ratio
Southern (%)
Northeast (%)
Southern/ Northeast
ratio
Age (in years)
40 – 49 28.8 42.2 0.68 12.1 12.1 1.00 59.1 45.8 1.29
50 – 59 21.6 35.7 0.61 16.2 14.9 1.09 62.2 49.4 1.26
60 – 69 30.1 44.7 0.67 18.2 16.4 1.11 51.7 38.9 1.33
Skin color
White 24.5 35.5 0.69 14.7 13.8 1.07 60.7 50.7 1.20
Nonwhite 35.0 42.9 0.82 15.2 13.9 1.09 49.8 43.2 1.15
Marital status
With spouse 26.0 42.9 0.61 13.7 12.4 1.10 60.4 44.7 1.35
Without spouse 27.4 38.5 0.71 16.2 15.3 1.06 56.4 46.3 1.22
Per capita income (quintiles)
Q1 (lowest) 43.4 59.9 0.72 16.9 12.6 1.34 39.7 27.4 1.45
Q2 35.3 51.8 0.68 14.6 14.4 1.01 50.1 33.8 1.48
Q3 28.6 43.1 0.66 15.0 15.2 0.99 56.4 41.7 1.35
Q4 19.1 35.6 0.54 16.6 16.1 1.03 64.3 48.3 1.33
Q5 (highest) 7.9 13.7 0.58 11.7 11.2 1.04 80.4 75.1 1.07
Schooling (years)
No 48.1 65.2 0.74 17.6 11.8 1.49 34.4 23.0 1.50
1 – 4 36.2 48.7 0.74 16.9 15.4 1.10 46.9 35.9 1.31
5 – 8 25.7 33.7 0.76 15.6 16.8 0.93 58.8 49.5 1.19
9 – 11 14.6 19.4 0.75 12.0 12.6 0.95 73.4 68.1 1.08
Table 4. Prevalence ratio for women who never had a mammogram, a clinical breast examination or both examinations. 2008 National Household Sampling Survey.
Variables
Never had it
MMG CBE CBE and MMG
Southern
PR (95% CI) PR (95% CI)Northeast
Southern
PR (95% CI) PR (95% CI)Northeast
Southern
PR (95% CI) PR (95% CI)Northeast
Age (in years) p < 0.001 p < 0.001 p < 0.001 p < 0.001 p < 0.001 p < 0.001
40 – 49 1 1 1 1 1 1
50 – 59 0.72 (0.66 – 0.79) 0.79 (0.75 – 0.84) 0.89 (0.79 – 1.00) 0.87 (0.82 – 0.93) 0.85 (0.75 – 0.96) 0.85 (0.80 – 0.91)
60 – 69 0.94 (0.85 – 1.04) 0.97 (0.91 – 1.03) 1.15 (1.01 – 1.30) 1.09 (1.01 – 1.17) 1.14 (1.00 – 1.30) 1.09 (1.01 – 1.17)
Skin color p = 0.052 p = 0.635 p = 0.049 p = 0.379 p = 0.037 p = 0.424
White 1 1 1 1 1 1
Nonwhite 1.09 (0.98 – 1.18) 1.01 (0.96 – 1.06) 1.12 (1.00 – 1.25) 1.02 (0.97 – 1.08) 1.11 (1.01 – 1.22) 1.02 (0.97 – 1.06)
Marital status p = 0.055 p = 0.030 p < 0.001 p = 0.248 p = 0.001 p = 0.097
With spouse 1 1 1 1 1 1
Without spouse 1.08 (1.00 – 1.17) 0.96 (0.93 – 1.00) 1.19 (1.08 – 1.31) 0.98 (0.93 – 1.02) 1.22 (1.11 – 1.35) 0.97 (0.93 – 1.01)
Per capita income (quintiles) p < 0.001 p < 0.001 p < 0.001 p < 0.001 p < 0.001 p < 0.001
Q5 (highest) 1 1 1 1 1 1
Q4 2.10 (1.75 – 2.55) 2.01 (1.81 – 2.25) 1.95 (1.53 – 2.49) 1.99 (1.75 – 2.76) 1.90 (1.47 – 2.45) 2.08 (1.81 – 2.39)
Q3 2.88 (2.40 – 3.46) 2.28 (2.04 – 2.54) 2.74 (2.17 – 3.46) 2.36 (2.08 – 2.68) 2.72 (2.13 – 3.47) 2.48 (2.17 – 2.84)
Q2 3.35 (2.80 – 4.02) 2.55 (2.29 – 2.84) 3.48 (2.76 – 4.38) 2.61 (2.30 – 2.97) 3.47 (2.73 – 4.41) 2.78 (2.43 – 3.18)
Q1 (lowest) 3.88 (3.23 – 4.65) 2.79 (2.50 – 3.11) 3.76 (2.98 – 4.74) 2.96 (2.61 – 3.37) 3.80 (2.99 – 4.84) 3.20 (2.79 – 3.66)
Schooling (years) p < 0.001 p < 0.001 p < 0.001 p < 0.001 p < 0.001 p < 0.001
9 – 11 1 1 1 1 1 1
5 – 8 1.38 (1.23 – 1.56) 1.44 (1.32 – 1.58) 1.69 (1.44 – 1.98) 1.58 (1.42 – 1.75) 1.71 (1.45 – 2.02) 1.61 (1.43 – 1.80)
1 – 4 1.84 (163 – 2.06) 1.99 (1.84 – 2.16) 2.42 (2.07 – 2.82) 2.43 (2.21 – 2.67) 2.44 (2.07 – 2.86) 2.49 (2.25 – 2.75)
No 2.24 (1.94 – 2.59) 2.64 (2.43 – 2.86) 3.14 (2.61 – 3.77) 3.41 (3.10 – 3.75) 3.22 (2.67 – 3.90) 3.62 (3.27 – 4.00)
However, as seen in the demonstrated results, women who do not follow recommen-dations — never had or are below the recommenrecommen-dations — are still those presenting relevant characteristics to other health outcomes, such as nonwhite women aged 60 years or older, with the lowest income quintile. These findings are in agreement with the studies carried out with smaller samples and in different regions of the coun-try8,17-19. Women with higher schooling and income levels, generally, have more access to information and health services, therefore resulting in the highest prevalence of performing examinations closer to the recommendations for prevention or treatment of diseases8,17,20. After comparing national data of 2003 and 2008 PNAD, we found an increase in the rate of women aged 50 to 69 years who had a MMG in their lives to
be 54.6 and 71.5%, respectively21. Moreover, regarding the MMG, the study pointed
out that young women, who are not in the age range recommended to perform the examination, represent a high percentage compared with those who should be the procedure target. Because the recommendation for performing the MMG involves
50-year-old women or older3,5, a lower prevalence would be expected in women aged
younger than 50 years. Because data do not allow identifying women with high risk for breast cancer, there is the possibility that, among this group, there are some women with an indication to have the MMG. As to skin color, there are more inequalities in the Southern region than in the Northeast, mainly regarding the nonperformance of the MMG, which can more strongly mark the access differences and information from unequal situations from the race/skin color in both analyzed contexts. The investiga-tions of Amorin et al.17 and Oliveira et al.10 also point out some differences regarding this subject, with the worst results found for nonwhite women.
As to the target regions of the study, we noticed that Southern women most refer performing CBE and MMG if compared with the Northeast region. This datum was
also seen in the 2003 PNAD7, which shows the existence of a temporal trend to be
combated. Because the goal established by Department of Health is of 60% to MMG performance in the target population22, we can see that the Southern region was close to reaching it (59.1%), while the Northeast region is still far (49.8%) from it. Studies that evaluated health iniquities and inequalities in the Brazilian regions also point out more unfavorable indicators for the Northeast compared with the Southern8,23. According to the authors, differences can be seen such as in the number of mammography units and treatments available and the distance to get to the examination location. More econom-ically developed regions tend to detect more breast cancer cases12. Regions with lower poverty rate, such as the Brazilian Northeast, have a great contingent of health prob-lems in all areas23. Historically, the absence of constant investments in public health services and skilled professionals that are able to care for and monitor diseases such as breast cancer in these regions might explain a great part of the differences24,25.
causes inequalities in the access and use of preventive examinations, thus causing the prioritization of MMG instead of CBE21, as showed. According to Silva and Hortale21, the organized monitoring programs could correct inequalities if the four main compo-nents (technical, economic, social, and ethical) were ensured. It is worth emphasizing that costs with preventive actions are smaller than with disease treatment26. Its direct and indirect costs are associated with breast stage during diagnosis moment. Costs to health system might increase if the municipalities do not have the preconized treatment.
Other associated reasons to not have the MMG pointed out in literature include: lack of medical requirement27-30, not knowing age range in which the examination must be taken27, obstacles related to public services27,28, fear of performing the examination27,28,30, pain, discomfort, and anxiety regarding the examination28,31,32, and lack of time28. In addi-tion to them, sociocultural aspects are also believed to influence care practices and and ways of noticing health needs and comprehension of how to prevent diseases in both regions and of professionals towards them17. These aspects might also be quite related to the fact that women living with a spouse in the Northeast region are the group with the highest rate of having never performed the CBE and of them following fewer recom-mendations and corresponding to the highest percentage of having never had a MMG. This study presents an important estimation regarding the performance of preventive examinations in women on the studied regions. However, it is important to mention some limitations. Owing to the use of secondary data obtained with specific questions on the theme, it was not possible to make new categorizations for comparative pur-poses with other studies. As it is a survey with an interview, the memory bias to talk about the period of the last examination and of information might have influenced the percentages for both examinations. Impossibility in inferring causality is another lim-itation of the study, although the associated factors evaluation, even noncasually, is an important tool to plan public policies.
The results from this study, based on 2008 PNAD, might provide grants to the man-agers for formulating public policies with the aim of an effective and efficient increase of CBE and MMG. Therefore, they should consider in their actuations the differences seen between the regions, such intensifying the MMG monitoring in the Northeast region, which is a place where less women have had it; strengthening this monitoring for the target population in both regions. In addition, new investigations are recommended in order to improve the understanding about factors associated with these examinations, promoting the comprehension and aiming to dissolve social inequalities associated with nonperformance of the analyzed examinations, and to promote health equities.
CONCLUSION
1. World Health Organization. International Agency for Research on Cancer. World Cancer Report 2008. Lyon: IARC Press; 2008. Disponível em: http://www.iarc. fr/en/publications/pdfs-online/wcr/2008/ (Acessado em 21 de setembro de 2015).
2. Brasil. Ministério da Saúde. Instituto Nacional do Câncer. Estimativa 2014: incidência de câncer no Brasil. Rio de Janeiro: INCA; 2014.
3. Brasil. Ministério da Saúde. Instituto Nacional do Câncer. Controle do Câncer de mama. Documento de Consenso. Rev Bras Cancerol 2004; 50(2): 77-90.
4. Brasil. Ministério da Saúde. Secretaria de Atenção à Saúde. Departamento de Atenção Básica. Controle dos cânceres do colo do útero e da mama. 2 ed. Brasília: Ministério da Saúde; 2013.
5. Instituto Nacional do Câncer. Outubro rosa. Detecção precoce [home page da internet]. Disponível em: http://www1.inca.gov.br/wcm/outubro-rosa/2014/ deteccao-precoce.asp (Acessado em 21 de setembro de 2015).
6. International Union Against Cancer. Evidence-based cancer prevention: strategies for NGOs. Geneve: UICC; 2004. p. 180-193.
7. Instituto Brasileiro de Geograia e Estatística. Pesquisa Nacional por Amostra de Domicílios. Acesso e utilização de serviços de saúde - 2003. Rio de Janeiro: IBGE; 2005.
8. Lima-Costa MF, Matos DL. Prevalência e fatores associados à realização da mamograia na faixa etária de 50-69 anos: um estudo baseado na Pesquisa Nacional por Amostra de Domicílios (2003). Cad Saúde Pública 2007; 23(7): 1665-73.
9. Instituto Brasileiro de Geograia e Estatística. Pesquisa Nacional por Amostra de Domicílios: um panorama da saúde no Brasil: acesso e utilização dos serviços, condições de saúde e fatores de risco e proteção à saúde: 2008. Rio de Janeiro: IBGE; 2010.
10. Oliveira EXG, Pinheiro RS, Melo ECP, Carvalho MS. Condicionantes socioeconômicos e geográicos do acesso à mamografia no Brasil, 2003-2008. Ciênc Saúde Coletiva 2011; 16(9): 3649-64.
11. Brasil. Ministério da Saúde. Secretaria de Atenção à Saúde. Portaria nº 2.439 de 08/12/2005. Institui a Política Nacional de Atenção Oncológica: Promoção, Prevenção, Diagnóstico, Tratamento, Reabilitação e Cuidados Paliativos, a ser implantada em todas as unidades federadas, respeitadas as competências das três esferas de gestão. Brasília: Ministério da Saúde; 2005.
12. Gebrim LH, Quadros LGA. Rastreamento do câncer de mama no Brasil. Rev Bras Ginecol Obstet 2006; 28(6): 319-23.
13. Szwarcwald CL, Leal MC, Gouveia GC, Souza WV. Desigualdades socioeconômicas em saúde no Brasil: resultados da Pesquisa Mundial de Saúde, 2003. Rev Bras Saúde Matern Infant 2005; 5(Suppl 1): s11-s22.
14. Viacava F, Souza Junior PRB, Moreira RS. Estimativas da cobertura de mamograia segundo inquéritos de saúde no Brasil. Rev Saúde Pública 2009; 43(Suppl 2): 117-25.
15. Schmidt MI, Duncan BB, Silva GA, Menezes AM, Monteiro CA, Barreto SM, et al. Chronic non-communicable diseases in Brazil: burden and current challenges.Lancet 2011; 377(9781): 1949-61.
16. Associação Brasileira de Empresas de Pesquisas. Critério de classiicação econômica Brasil [home page na internet]. ABEP; 2008. Disponível em: www.abep. org/Servicos/Download.aspx?id=07 (Acessado em 21 de setembro de 2015).
17. Amorim VMSL, Barros MBA, César CLG, Carandina L, Goldbaum M. Fatores associados a não realização da mamograia e do exame clínico das mamas: um estudo de base populacional em Campinas, São Paulo, Brasil. Cad Saúde Pública2008; 24(11): 2623-32.
18. Dias-da-Costa JS, Olinto MTA, Bassani D, Marchionatti CRE, Bairros FS, Oliveira MLPd, et al. Desigualdades na realização do exame clínico de mama em São Leopoldo, Rio Grande do Sul, Brasil. Cad Saúde Pública 2007; 23(7): 1603-12.
19. Novaes HMD, Braga PE, Schout D. Fatores associados à realização de exames preventivos para câncer nas mulheres brasileiras, PNAD 2003. Ciênc Saúde Coletiva 2006; 11(4): 1023-35.
20. Marinho LAB, Costa-Gurgel MS, Cecatti JG, Osis MJD. Conhecimento, atitude e prática do auto-exame das mamas em centros de saúde. Rev Saúde Pública 2003; 37(5): 576-82.
21. Silva RCF, Hortale VA. Rastreamento do câncer de mama no Brasil: quem, como e por quê? Rev Bras de Cancerol 2012; 58(1): 67-71.
22. Brasil. Ministério da Saúde. Portaria nº 2.669, de 3 de novembro de 2009. Estabelece as prioridades, objetivos, metas e indicadores de monitoramento e avaliação do Pacto pela Saúde, nos componentes pela Vida e de Gestão, e as orientações, prazos e diretrizes do seu processo de pactuação para o biênio 2010 – 2011. Brasília: Ministério da Saúde; 2009.
23. Vieira RADC, Mauad EC, Matheus AGZ, Mattos JSC, Haikel Junior RL, Bauad SDP. Rastreamento mamográfico: começo - meio - fim. Rev Bras de Mastologia 2010; 20(2): 92-7.
24. Oliveira EXG, Melo ECP, Pinheiro RS, Noronha CP, Carvalho MS. Acesso à assistência oncológica: mapeamento dos luxos origem-destino das internações e dos atendimentos ambulatoriais. O caso do câncer de mama. Cad Saúde Pública 2011; 27(2): 317-26.
25. Nunes A, Santos JRS, Barata RB, Vianna SM. Medindo as desigualdades em saúde no Brasil: uma proposta de monitoramento. Brasília: Organização Pan-Americana da Saúde; 2001.
26. Ribeiro RA, Calei M, Polanczyk CA. Custo-efetividade de um programa de rastreamento organizado de câncer de mama no Sul do Brasil. Cad Saúde Pública 2013; 29(Suppl 1): s131-45.
27. Lages RB, Oliveira GP, Simeão Filho VM, Nogueira FM, Teles JBM, Vieira SC. Desigualdades associadas à não realização de mamograia na zona urbana de Teresina-Piauí-Brasil, 2010-2011. Rev Bras Epidemiol 2012; 15(4): 737-47.
28. Marinho LAB, Cecatti JG, Osis MJD, Costa Gurgel MS. Knowledge, attitude and practice of mammography
among women users of public health services. Rev Saúde Pública2008; 42(2): 200-7.
29. Meissner HI, Breen N, Taubman ML, Vernon SW, Graubard BI. Which women aren’t getting mammograms and why? (United States). Cancer Causes Control 2007; 18(1): 61-70.
30. Santos GD, Chubaci RYS. O conhecimento sobre o câncer de mama e a mamograia das mulheres idosas frequentadoras de centros de convivência em São Paulo (SP, Brasil). Ciênc Saúde Coletiva 2011; 16(5): 2533-40.
31. Elmore JG, Armstrong K, Lehman CD, Fletcher SW. Screening for breast cancer. JAMA 2005; 293(10): 1245-56.
32. Freitas Júnior R, Fiori WF, Ramos FJF, Godinho E, Rahal RMS, Oliveira JG. Desconforto e dor durante realização da mamograia. Rev Assoc Med Bras 2006; 52(5): 333-6.
Received on: 11/15/2014