Fatigue Pictogram: an option for
assessing fatigue severity and impact
PICTOGRAMA DE FADIGA: UMA ALTERNATIVA PARA AVALIAÇÃO DA INTENSIDADE E IMPACTO DA FADIGA
PICTOGRAMA DE FATIGA: UNA OPCIÓN PARA LA EVALUACIÓN DE LA SEVERIDAD E DEL IMPACTO DE LA FATIGA
RESUMO
O objetivo foi validar o Fatigue Pictogram para uso no Brasil. Os dados foram coleta-dos em quatro ambulatórios de oncologia de São Paulo (SP) e na Escola de Enferma-gem da USP. A amostra de conveniência en-volveu 584 pacientes com câncer, 184 acompanhantes e 189 estudantes de gra-duação enfermagem, que responderam ao Picto-grama de Fadiga, ao Inventário de De-pressão de Beck (IDB) e Escala de Karnofsky (KPS). Foram feitos testes de validade e confiabilidade. O Teste-reteste mostrou que o instrumento tem boa estabilidade.O primeiro item do Pictograma de Fadiga dis-criminou estudantes de cuidadores de pa-cientes, mas não pacientes de cuidadores. O segundo item discriminou todos os gru-pos. Observou-se adequada validade con-vergente (fadiga e depressão) e dicon-vergente (fadiga e Karnofsky). O Pictograma de Fadi-ga é valido, confiável e fácil de usar para avaliar fadiga em câncer, mas necessita ajus-tes para uso em pessoas saudáveis.
DESCRITORES
Fadiga. Neoplasias.
Reprodutibilidade dos testes. Estudos de validação.
1 BScN, MScN, PhD. Research Coordinator of the Instituto do Câncer de São Paulo. São Paulo, SP, Brazil. [email protected] 2 PhD, Associated Professor of the Nursing School of the University of São Paulo. São Paulo, SP, Brazil. [email protected] 3 RN, PhD, Head, Oncology Nursing and Supportive
O
RIGINAL
A
R
TICLE
Dálete Delalibera Corrêa de Faria Mota1, Cibele Andrucioli de Mattos Pimenta2,
Margaret Isabel Fitch3
ABSTRACT
The purpose of this paper was to validate the Fatigue Pictogram for use in Brazil. Data was collected at four oncology ambulatory clinics in Sao Paulo (Brazil) and at the Nurs-ing School of Sao Paulo University. A con-venience sample of 584 cancer patients, 184 caregivers and 189 undergraduate nursing students completed the Karnofsky Scale, Fatigue Pictogram-Brazilian Version, and the Beck Depression Inventory (BDI). Validity and reliability tests were per-formed. Test-retest showed that the instru-ment has good stability. The first item of the Fatigue Pictogram discriminated stu-dents from caregivers and patients but not patients from caregivers. The second item discriminated all groups. Adequate conver-gent (fatigue and depression) and diverconver-gent (fatigue and Karnofsky Scale) validity was observed. The Fatigue Pictogram is a valid, reliable, and easy-to-use tool for assess-ment of cancer-related fatigue but needs adjustments for use among healthy indi-viduals.
KEY WORDS
Fatigue. Neoplasms.
Reproducibility of results. Validation studies.
RESUMEN
El objetivo fue validar el Pictograma de Fa-tiga para su uso en Brasil. Los datos fueron recolectados en cuatro clínicas de oncolo-gía ambulatoria de São Paulo (SP) y la Es-cuela de Enfermería de la USP. La muestra de conveniencia incluyen 584 pacientes con cáncer, 184 acompañantes y 189 estudian-tes de posgrado en enfermería, que respon-dió a la Pictograma de Fatiga, del Inventa-rio de Depresión de Beck (BDI) y la escala de Karnofsky (KPS). Realizado pruebas de validez y fiabilidad. Test-retest mostró que el instrumento tiene una buena estabilidad. El primer item del Pictograma de Fatiga dis-criminó a estudiantes de los cuidadores de los pacientes, pero no los pacientes de los cuidadores. El segun item discriminó todos los grupos. Hubo suficiente validez conver-gente (fatiga y depresión) y diverconver-gente (Karnofsky y Fatiga).Pictograma de Fatiga es válida, fiable y fácil de utilizar para evaluar la fatiga en el cáncer, pero necesita ajustes para el uso en personas sanas.
DESCRIPTORES
Fatiga. Neoplasias.
INTRODUCTION
Fatigue is an unpleasant physical, cognitive and emo-tional symptom described as a sense of tiredness not re-lieved by common strategies that normally restore energy. It varies in duration and intensity and reduces, to different degrees, the ability to perform the usual daily activities(1). In Brazil there is a lack of instrumentation for fatigue as-sessment and that may lead to difficulty diagnosing and managing this symptom among cancer patients.
Dozens of instruments for assessment of subjective con-cepts, for example fatigue, are available in the literature(1), but many are criticized because of their extensive length and complex language. Pictographic scales are measure-ment tools that use simple and easily understood illustra-tions and seem to have good applicability in clinical prac-tice. The Pain Faces Scale is one of the best known picto-grams used to assess the symptom of pain, and it has been
proven to be adequate for usage among children, adults and elders with different illnesses such as cancer or post-surgery pain(2-5). Pictograms are also used to teach patients how to self-administer medications by different means, such as insulin or vaginal creams(6-7).
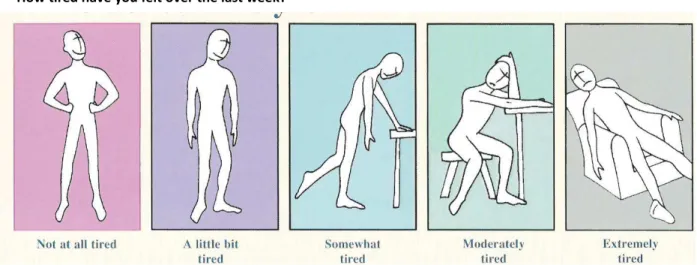
The Fatigue Pictogram(8) is an illustrated instrument for fatigue assessment (Figure 1). It has two questions with five figures representing each response option. The items as-sess the intensity of fatigue and the impact of fatigue on daily activities. Since it is very short, simple and easy-to-use, it seems useful for both practical nursing and research. Considering the interest in making comparisons between populations around the world or populations with differ-ent illnesses, and the recommendation to make cultural adaptations to existing instruments instead of creating new ones(9), this study aimed at assessing the fatigue of Brazil-ian cancer patients and testing the psychometric proper-ties of the Fatigue Pictogram - Brazilian Version (BV).
Figure 1 - Fatigue Pictogram How tired have you felt over the last week?
METHOD
Population and sample
Three groups participated in the study. Convenience samples of patients and caregivers, age 18 or over, with adequate abilities of comprehension and communication were gathered from four oncology clinics. Patients (n=584) from a cross-section of tumor sites and stages, who were either receiving active cancer treatment (chemo and/or radiotherapy) or were not receiving treatment at the present time, participated. The inclusion of patients with different tumor sites and stages served the purpose of test-ing the Pictogram validity over a greater range of cancer patients than had previously been achieved. Caregivers (n=184) with no history of cancer formed a group of healthy individuals. All nursing students (n=314) from the Nursing School of the University of Sao Paulo, age 18 or over, with no history of cancer, were invited to partici-pate in the study, and 189 (60.2%) participartici-pated. These stu-dents formed a group of young healthy individuals. The caregiver and nursing student groups were constructed as healthy groups to test the discriminant validity of the Fatigue Pictogram.
Location and time period
Patients and their caregivers were recruited from four oncology clinics in Sao Paulo, Brazil, from July/2006 until July/2007. The nursing students were recruited from the Nursing School of the University of São Paulo, from March until May/2006. The research was approved by the Ethics Committees from all institutions involved and all partici-pants signed the Informed Consent.
Instruments and procedures for data collection
Patients and caregivers were invited to participate in the research after their scheduled medical appointment. Those who accepted were instructed to answer the instru-ments on two different occasions. The first assessment was at the same time as the clinic appointment. The second assessment was 12 to 15 days following the first and oc-curred at home. The participants received a sealed enve-lope in which to return the answered instruments. At the Nursing School, the students were invited to participate in their classrooms, and those who accepted answered the instruments on one occasion.
At the first assessment, patients, caregivers and students answered an Identification Profile (age, gender, marital sta-tus and education level), the Fatigue Pictogram-BV and the Beck Depression Inventory. Only patients and caregivers were assessed for performance status (Karnofsky Perfor-mance Scale), and information regarding tumor site and cancer treatment was obtained for the patients. At the sec-ond assessment, patients and caregivers answered the Fa-tigue Pictogram - BV.
The Karnofsky Performance Scale(10) was used to test the divergent validity of the Fatigue Pictogram-BV. It is com-posed of phrases which reflect performance status scaled from 100% to 0%, with 100% representing a person with no sign of illness and 0% representing death. It does not have a cut-of-score. It is frequently used in oncology re-search and clinics around the world.
The Fatigue Pictogram is an ordinal scale(8); it has two questions graded by 5 illustrations, with subheadings that assess intensity (not at all tired, a little bit tired, somewhat tired, moderately tired and extremely tired), and its im-pact (I can do everything I normally do, I can do almost everything I normally do, I can do some of the things I nor-mally do, I do what I have to do, and I can do very little). It does not have a cut-of-score to diagnose fatigue or to de-termine the intensity of the symptom.
The Fatigue Pictogram was submitted to the translation and back-translation process. For its translation, two na-tive-speaking Portuguese individuals translated the instru-ment from English to Portuguese. Two separate Portuguese versions were developed and they were presented in a pi-lot test to ill and healthy individuals in order to verify if the terms used in the instruments were clear. A Portuguese version was created using the most comprehensible terms. The back-translation was done by a native English-speak-ing individual. The back-translated version was approved by one of the Pictogram authors (Fitch).
The Beck Depression Inventory was used to test the convergent validity of the Fatigue Pictogram. It has 21 items, graded from 0 to 3; the minimal score is 0 and maximum score is 63. Higher scores suggest greater risk for depres-sion. In Brazil, the cut-of-scores for individuals without a previous depression diagnosis are: 0-15, no depression; 16-20, dysphoria ; 21-63, depression. The Beck Depression In-ventory has been validated in the Brazilian population(11).
Data analysis
Each item of the Fatigue Pictogram was tested sepa-rately for its psychometric properties (reliability and valid-ity) because it does not have an overall score. The software SPSS (Statistical Package for the Social Sciences, Version 15.0) was used for statistical testing. P<0.05 was consid-ered statistically significant.
Rest-retest reliability (interval between initial adminis-tration and second adminisadminis-tration of 12 to 15 days) was assessed using the Kappa agreement coefficient, Spearman correlation coefficient, and Wilcoxon signed-ranks test. The hypothesis tested was that fatigue would be stable among cancer patients who were not receiving cancer treatment (chemo and/or radiotherapy) and caregivers during the in-terval of 2 weeks.
and students to the first and second items were compared. Discriminant validity was analyzed by comparing the fa-tigue among the cancer patients, caregivers and nursing students, using the Kruskal-Wallis test. Convergent validity was tested, with the expectation of a positive correlation between the scores on the Fatigue Pictogram and those of the Beck Depression Inventory (Spearman correlation co-efficient). Divergent validity was tested, expecting to find a negative correlation between the Fatigue Pictogram and
the Karnofsky Performance Status Scale (Spearman corre-lation coefficient).
RESULTS
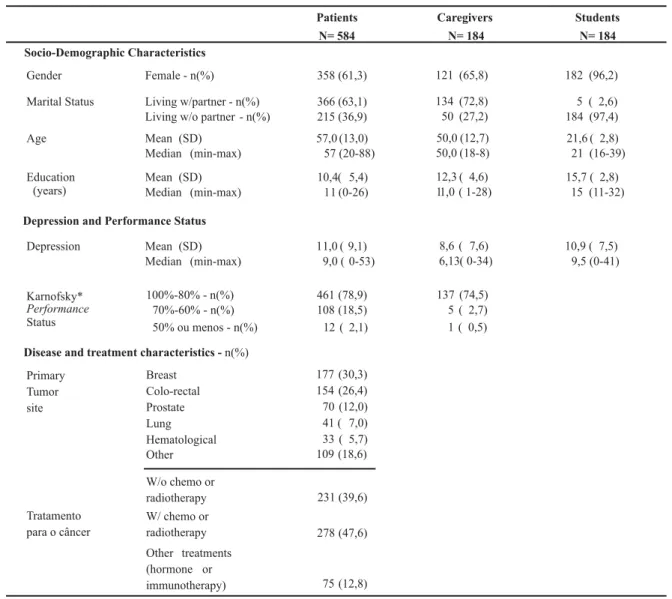
A total of 957 subjects participated in the study: 584 cancer patients, 184 caregivers and 189 nursing students (Table 1). The frequency of answers given in the Fatigue Pictogram are presented in Table 2.
Table 1 - Demographic characteristics, performance status and depression scores of patients, caregivers, and nursing students - São Paulo, 2007
*100%-80% - patients totally independent for daily activities; 70%-60% - patients partially dependent for daily activities; < 50% - patients totally dependent for daily activities.
N= Patients
584
Caregivers N= 184
Students N= 184 Socio-Demographic Characteristics
Gender Female - n(%) 358 (61,3) 121 (65,8) 182 (96,2) Marital Status Living w/partner - n(%) 366 (63,1) 134 (72,8) 5 ( 2,6) 215 (36,9) 50 (27,2) 184 (97,4) Age Mean (SD) 57,0 (13,0) 50,0 (12,7) 21,6 ( 2,8) Median (min-max) 57 (20-88) 50,0 (18-8) 21 (16-39) Education
(years)
Mean (SD) 10,4( 5,4) 12,3 ( 4,6) 15,7 ( 2,8) Median (min-max) 11 (0-26) 11,0 ( 1-28) 15 (11-32)
Depression and Performance Status
Depression Mean (SD) 11,0 ( 9,1) 8,6 ( 7,6) 10,9 ( 7,5) Median (min-max) 9,0 ( 0-53) 6,13( 0-34) 9,5 (0-41)
Performance
Status
Karnofsky* 100%-80% - n(%) 461 (78,9) 137 (74,5) 70%-60% - n(%) 108 (18,5) 5 ( 2,7) 50% ou menos - n(%) 12 ( 2,1) 1 ( 0,5)
Disease and treatment characteristics -n(%) Breast
Colo-rectal Prostate Lung Hematological Other W/o chemo or radiotherapy
Other treatments (hormone or immunotherapy) Primary
Tumor site
Tratamento para o câncer
177 (30,3) 154 (26,4) 70 (12,0) 41 ( 7,0) 33 ( 5,7) 109 (18,6) 231 (39,6) 278 (47,6)
75 (12,8) Living w/o partner - n(%)
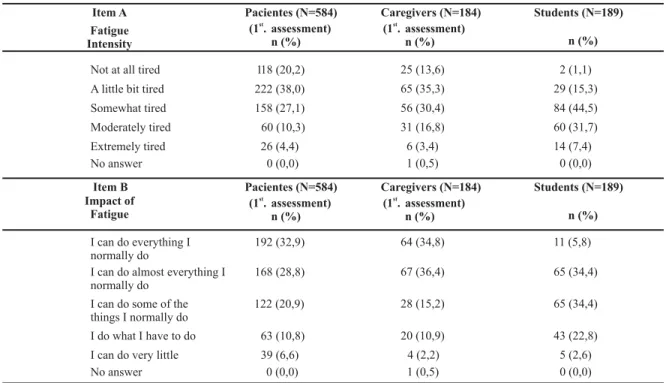
Table 2 - Distribution of the Fatigue Pictogram answers given by patients, caregivers and students - São Paulo - 2007
Pacientes (N=584)
(1 .st
assessment) n (%)
Caregivers (N=184) Students (N=189)
Not at all tired 118 (20,2) 25 (13,6) 2 (1,1)
Item A Fatigue Intensity
A little bit tired 222 (38,0) 65 (35,3) 29 (15,3)
Somewhat tired 158 (27,1) 56 (30,4) 84 (44,5)
Moderately tired 60 (10,3) 31 (16,8) 60 (31,7)
Extremely tired 26 (4,4) 6 (3,4) 14 (7,4)
No answer 0 (0,0) 1 (0,5) 0 (0,0)
I can do everything I normally do
192 (32,9) 64 (34,8) 11 (5,8)
I can do almost everything I normally do
168 (28,8) 67 (36,4) 65 (34,4)
I can do some of the things I normally do
122 (20,9) 28 (15,2) 65 (34,4)
I do what I have to do 63 (10,8) 20 (10,9) 43 (22,8)
I can do very little 39 (6,6) 4 (2,2) 5 (2,6)
No answer 0 (0,0) 1 (0,5) 0 (0,0)
(1 .st
assessment) n (%)
Item B Impact of
Fatigue
n (%)
Students (N=189)
n (%) Caregivers (N=184)
(1 .st
assessment) n (%) Pacientes (N=584)
(1 .st
assessment) n (%)
Among the patients, 41.8% reported extreme tiredness, while 38.3% reported a moderate to extreme impact on their usual daily activities. Among caregivers, 50.6% re-ported a moderate to extreme tiredness and only 28.3% reported a moderate to extreme impact; 83.6% of the stu-dents reported moderate to extreme tiredness, and 59.8% reported a moderate to extreme impact on usual activities.
In all groups there was a statistically significant correla-tion between answers given on the first and the second items of the Fatigue Pictogram (Table 3). For the patients and caregivers, the Spearman correlation coefficients were high and the percentage of variance was approximately 30%, (i.e. fatigue impact related 30% to the intensity of tiredness). Among the students, the correlation was 0.321 and the vari-ance was 0.103, indicating that the impact of fatigue had low capacity to explain the intensity of tiredness.
Table 3 - Correlation between the items of the Fatigue Pictogram - São Paulo - 2007
Patients Caregivers Students
Correlation between
Item A and Item B r= 0,532* r= 0,551* r= 0,321*
Explained variance
(r )2 r = 0,283
28,3 2
r2 = 0,304 30,4
r2 = 0,103 10,3
*p<0.05
Table 4 -Test-retest using data from first and second assessment (mean interval = 14 days) - São Paulo - 2007
Kappa agreement
1 .st
x 2 .nd
assessment
Patients not receiving chemo or
radiotherapy (n1=306; n2=39)
0,210* 0,350*
Caregivers (n1=184; n2=39)
Group
Spearman r correlation
Wilcoxon Signed rank
Item A Item B Item A Item B Item A Item B
0,543* 0,588* 12,25-11,73 9,71-10,17
0,505* † 0,630* 0,546* 7,30-6,00 8,50-7,56
1 .st
x 2 .nd
assessment 1 .st
x 2 .nd
assessment
* p<0.05
The test-retest results are presented in Table 4. Thirty-nine patients (12.7%) who were not receiving active cancer treatment, and 39 (21.2%) caregivers answered the Fatigue Pictogram twice (mean interval= 14 ± 2.6 days).
For both the patients not receiving cancer treatment and for the caregivers, we expected to see high agreement on both items between Time1 and Time2, moderate posi-tive correlation, and no significant differences in the ranks. We observed a moderate agreement for caregivers (Item A) and a weak agreement for patients, although both were statistically significant (Table 4). The correlation between T1 and T2 assessment for both times was good in both the patient and caregiver groups and there was no difference in ranks (Wilcoxon's Test).
It was anticipated the Fatigue Pictogram would be able to discriminate cancer patients from caregivers and
nurs-ing students. Item A discriminated the students from both patients and caregivers (Kruskal-Wallis p<0.01), but was not able to discriminate the patients from the caregivers (p=0.560). For Item B, significant differences were observed among the three groups (patients, caregivers and students). The hypothesis, that the cancer patients would have the most severe fatigue, was not supported as the students reported the highest fatigue scores and impact (Table 2).
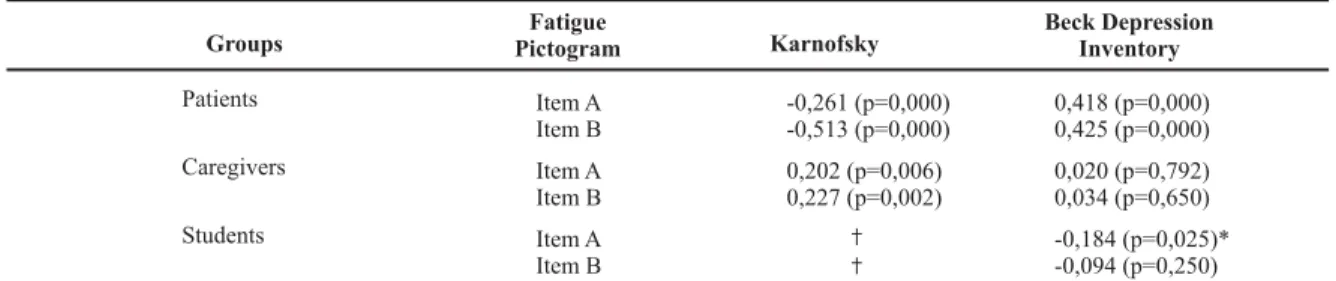
The correlation between the Fatigue Pictogram scores and Beck Depression Inventory scores provided a test of convergent validity, while the correlation between the Fa-tigue Pictogram scores and the Karnofsky Performance Sta-tus Scale provided a test of divergent validity (see Table 5). A positive correlation between fatigue and depression was expected, as was a negative correlation between fatigue and performance status.
Table 5 - Correlations between fatigue, depression and performance status - São Paulo - 2007
Fatigue
Pictogram Karnofsky
Patients Item A
Item B
Groups
-0,261 (p=0,000) -0,513 (p=0,000)
0,418 (p=0,000) 0,425 (p=0,000)
Caregivers Item A
Item B
0,202 (p=0,006) 0,227 (p=0,002)
0,020 (p=0,792) 0,034 (p=0,650)
Students Item A
Item B
† †
-0,184 (p=0,025)* -0,094 (p=0,250)
Beck Depression Inventory
‡ The Karnofsky Performance Status Scale was not used during the students' assessment. * negative but not statistically significant
The correlation between fatigue and depression was positive and statistically significant for cancer patients, while no correlation was evident for either the caregivers or the nursing students (Table 5). The correlation between fatigue and performance status was negative and statistically sig-nificant for the patient group. For the caregiver group, the correlation was positive and statistically significant.
DISCUSSION
Fatigue assessment for cancer patients in the clinical setting should be brief, simple, reliable and valid. However, not many instruments have all of these characteristics. The Fatigue Pictogram is a short and easy-to-use tool that was designed for both assessment and research with cancer patients. Because it uses figures or pictures, there can be advantages for individuals with a low scholarly level(6), or for extremely disabled patients. This study evaluated psy-chometric properties of the Fatigue Pictogram in the Por-tuguese language. The results of this study demonstrate that the psychometric properties of the Fatigue Pictogram are satisfactory for the assessment of fatigue of cancer pa-tients, but the results were not satisfactory for caregivers and nursing students.
A higher number of students reported greater inten-sity of tiredness (Item A) and impact of the fatigue (Item
B) than what was reported by the patients and caregivers (Table 2). This was surprising, as it was expected that the cancer patients would be the group with the most severe fatigue. It is necessary to highlight that the students, in comparison to the patients and caregivers, were younger, female, did not live with partners, and possessed a higher level of education. Perhaps because of these characteris-tics they may have a different meaning or concep-tualization of fatigue, inducing different expectations re-garding the symptom. Acknowledging fatigue as a sub-jective phenomena, with physical, social, and emotional components, it is possible that life experiences, age, gen-der and education level, among other factors, may con-tribute to the process of symbolization of the concept. Regardless of this, the Fatigue Pictogram was developed and tested in cancer patients and it is therefore impor-tant to test its validity in other populations.
vari-ance between intensity and fatigue and detriment to daily life activities were smaller, i.e., fatigue intensity had a smaller effect (10.3%), as shown on Table 3.
The correlation between the Items A and B for patients and caregivers was good (r=0.532 and r=0.551, respec-tively) and approximately 30% of the impact of fatigue on usual daily activities was explained by the intensity of fa-tigue (Table 3). This type of data is rarely discussed in the literature, although it is very interesting and reinforces the knowledge that behavior is factorial/multidimen-sional. With the group of students, the correlation was low and the percentage of variance between intensity and impact of fatigue was smaller. In other words, the impact on activities was less influenced by tiredness (10.3%), as presented on Table 3.
The results of the test-retest for the patients not receiv-ing treatment and for caregivers were satisfactory, indicat-ing that the reliability or stability of the Fatigue Pictogram was adequate for these populations. It would be interest-ing to assess test-retest usinterest-ing data from patients undergo-ing treatment to determine if the Pictogram is sensitive to the change in fatigue.
The results of the convergent and divergent validities were diverse among the three sample groups. The correla-tions were statistically significant and considered good for cancer patients (w/ or w/o cancer treatment), indicating that the instrument is valid for this group (Table 5). The
correlation between fatigue and depression, and fatigue and performance status were also observed in other stud-ies with cancer patients(13-18). However, for caregivers and students, the correlations had unexpected results. It is pos-sible that fatigue among healthy individuals is different than that among patients.
The Fatigue Pictogram presented good validity and stability for cancer patients. The Fatigue Pictogram was considered inadequate for healthy individuals (not valid). There is a need to evaluate modifications to the Fatigue Pictogram. Two suggestions are made: substitution of the term tiredness for the term fatigue; and change the verbs in Item B to the past tense, since Item A refers to the past week. In addition , a study to identify the mean-ing of the figures for patients and healthy individuals, and the distance between each picture (ordinal scale) should be done. The Fatigue Pictogram is a promising instrument and its improvement should be very useful.
CONCLUSIONS
The Fatigue Pictogram is a short and simple instrument, with great potential for usage in clinical practice and re-search. The results demonstrate that the Pictogram, in the Portuguese language, may be used for cancer patients in punctual assessments (non-sequential) and may not be used at the moment for healthy individuals.
REFERENCES
1. Mota DDCF, Pimenta CAM. Self-report Instruments for Fatigue Assessment: a systematic review. Res Theory Nurs Pract. 2006;20(1):49-78.
2. Hunter M, McDowell L, Hennessy R, Cassey J. An evaluation of the Faces Pain Scale with young children. J Pain Symptom Manage. 2000;22(2):122-9.
3. Dim EJ, Buschmann MT. Reliability and validity of the Faces Pain Scale with older adults. Inter J Nurs Stud. 2006;43(4): 447-56
4. Rodriguez CS, McMillan S, Yarandi H. Pain measurement in older adults with head and neck cancer and communication impairments. Cancer Nurs. 2004;27(6):425-33.
5. Gélinas C. The Faces Pain Thermometer: a new tool for critically ill adults. Perspect Infirmière. 2007;4(4):12-20.
6. Knapp P, Raynor DK, Jebar AH, Price SJ. Interpretation of medication pictograms by adults in the UK. Ann Pharmacother. 2005;39(7/8):1227-33.
7. Dowse R, Ehlers M. Medicine labels incorporating pictograms: do they influence understanding and adherence? Patient Educ Couns. 2005;58(1):63-70.
8. Fitch MI, Bunston T, Mings D, Sevean P, Bakker D. Evaluating a new clinical assessment tool: The Fatigue Pictogram. Support Care Cancer. 2003;11(6):403.
9. Guillemin F, Bombardier C, Beaton D. Cross-cultural adaptation of health-related quality of life measures: literature review and proposed guidelines. J Clin Epidemiol. 1993;46(12):1417-32.
10. Karnofsky DA, Burchenal JH. The clinical evaluation of chemo-therapeutic agents. In: MacLeod CM, editor. Evaluation of chemotherapeutic agents. Columbia: Columbia University Press; 1949. p. 196.
11. Gorenstein C, Andrade L. Validation of a Portuguese version of the Beck Depression Inventory and the State-Trait Anxiety Inventory in Brazilian Subjects. Braz J Med Biol Res. 1996;29(4):453-7.
13. Munch TN, Stromgren AS, Pedersen L, Petersen MA, Hoer-mann L, Groenvold M. Multidimensional measurement of fatigue in advanced cancer patients in palliative care: an application of the multidi-mensional fatigue inventory. J Pain Symptom Manage. 2006;31(6): 533-41.
14. Young KE, White CA. The prevalence and moderators of fati-gue in people who have been successfully treated for cancer. J Psychosom Res. 2006;60(1):29-38.
15. Brown DJF, McMillan DC, Milroy R. The correlation between fatigue, physical function, the systemic inflammatory response, and psychological distress in patients with advanced lung cancer. Cancer. 2005; 103(2):377-82.
16. Carpenter JS, Elam JL, Ridner SH, Carney PH, Cherry GJ, Cucullu HL. Sleep, fatigue, and depressive symptoms in breast cancer survivors and matched healthy women experiencing hot fla-shes. Oncol Nurs Forum. 2004;31 (3):591-8.
17. Dimeo F, Schmittel A, Fietz T, Schwartz S, Kohler P, Boning D, et al. Physical performance, depression, immune status and fatigue in patients with hematological malignancies after treatment. Ann Oncol. 2004;15(8): 1237-42.
18. Hwang SS, Chang VT, Rue M, Kasimis B. Multidimen-sional independent predictors of cancer-related fatigue. J Pain Symptom Manage. 2003;26(1):604-14.
Acknowledgements
Members of the Research Group Pain, Symptom Management and Palliative Care, CAPES (Coordenação de Pessoal de Nível Superior - Brazilian Ministry of Education and Culture) and FAPESP (Fundação de Amparo