William Tyler
angelo CosTa gurgelResumo
Este trabalho intenciona examinar efeitos econômicos da liberalização brasileira de políticas comerciais introduzidas durante os anos iniciais da década de 1990. Os efeitos no Brasil, como em muitos outros países seguindo reformas parecidas, tem sido contenciosos. O período em questão foi de tumulto ma-croeconômico seguido por estabilização bem-sucedida, e diversas políticas foram implementadas às vezes simultaneamente, tornando-se analiticamente difícil separar e isolar os vários efeitos. O trabalho examina a evidência existente sobre o crescimento da produtividade do País e utiliza também um modelo computável de equilíbrio geral (CGE) em simular os efeitos de mudanças em política comercial. A análise sugere que as reformas nas políticas comerciais resultaram em ganhos significativos de bem-estar para o País.
PalavRas-Chave
liberalização comercial, proteção, modelagem de equilíbrio geral
abstRaCt
This paper seeks to examine economic effects of Brazil’s trade policy liberalization in the early-1990s. The effects in Brazil, along with those of many other countries pursuing similar reforms, have been conten-tious. The period in question was one of macroeconomic turmoil followed by successful stabilization, and various policies were pursued sometimes simultaneously, rendering it analytically difficult to separate out various policy effects. The paper examines the existing evidence on the country’s productivity growth and employs a computable general equilibrium (CGE) model to simulate the effects of trade policy changes. The analysis suggests that the trade policy reforms resulted in significant welfare gains for Brazil.
KeywoRds
trade liberalization, protection, general equilibrium model analysis
Jel ClassifiCation
F14
Faculdade de Ciências Econômicas, Universidade do Estado do Rio de Janeiro (UERJ). E-mail: [email protected].
O autor agradece à Fundação de Amparo à Pesquisa do Estado do Rio de Janeiro (FAPERJ) pelo apoio financeiro.
Faculdade de Economia, Administração e Contabilidade de Ribeirão Preto – FEA-RP/USP. Endereço para contato:
1 BackgRound and contExt
The effects of trade policy liberalization have been contentious in nearly every coun-try where such policy reforms have been implemented. This has been especially the case in Brazil, where many observers have pointed to Brazil’s unique characteristics and large industrial base and have argued that Brazil should be treated as a special case. The advent of a trade policy liberalization program, initiated with the Collor Government in 1990, has been controversial, with proponents of the reforms ar-guing that effects would be beneficial and opponents contending that the removal of protection, instead of promoting growth and efficiency, would bring about a significant reduction of industrial output and overall employment. The objective of this paper is to contribute to the analysis of the economic effects of the trade policy liberalization.
With the passage of a number of years since the trade liberalization program began in 1990, the accompanying availability of relevant data and more advanced analyti-cal techniques more systematic analysis can now be undertaken of the effects of the program in Brazil. This analysis is potentially important in two major respects. First, it should contribute to the general understanding worldwide of trade policy liberalization with an important case study for Brazil. Second, the study can provide evidence from the Brazilian experience to enrich the policy debate currently existing in Brazil.
Much of the analysis of Brazil’s trade policy liberalization has focused on its employ-ment effects. Several scholarly studies cite adverse employemploy-ment effects, suggesting that an overall adverse effect emanating from the partial trade policy liberalization.1 Other authors have focused on the partial equilibrium analysis of trade balances and production by sectors (e.g., MOreira; COrrea, 1997). it should be noted however that the trade policy changes did not occur in a vacuum. Other important economic events were also taking place at the same time, primarily including grow-ing macroeconomic instability followed by successful stabilization. Macroeconomic policies, it will be argued below, went far in short-circuiting the economic effects of the trade policy liberalization. To obtain a better appreciation of what happened with the liberalization, holding other factors constant, general equilibrium model-ing (CGe) techniques have been employed to simulate the effects of the trade policy changes enacted by the Brazilian Government in the early 1990s.
in the remainder of this paper, Section ii presents a discussion of the evolution of Brazilian trade policies. Section iii offers a discussion of some of the observed
effects of the trade policy liberalization; two major effects are briefly discussed: (a) changes in productivity and (b) disappointing export performance. Section iV presents a discussion of computable general equilibrium models of the type to be employed in the present research project. The rationale for using a CGe model for the research is spelled out, along with a description of the model employed and its calibration. results of the policy simulations are presented. Section V offers some concluding observations.
2 thE EvolutIon of BRazIlIan tRadE PolIcIEs
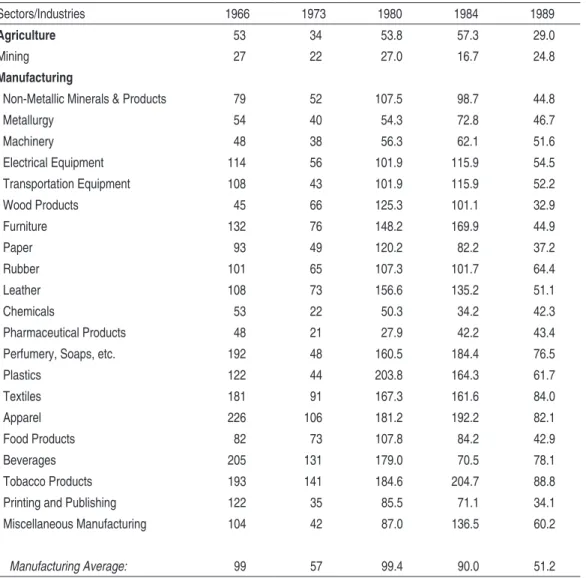
restrictive trade policies were a major component of Brazilian economic policies during the postwar period up to the early 1990s. industrialization was promoted through heavy protection, while agriculture suffered policy discrimination. The overall incentive system to promote industrial growth included a number of different policy instruments adopted during different periods, including exchange controls, multiple exchange rates, direct and indirect fiscal subsidies and credit subsidies. The most prevalent set of policy instruments however entailed import restrictions, which protected domestically based producers in the Brazilian domestic market by sheltering them from foreign competition. Such import protection in the 1980s, by international comparisons, was both heavy and extensive. as a result of this protection, the Brazilian economy was among the world’s most closed economies, with many noncompetitive sectors and low productivity growth. Overall economic policies imposed a significant anti-export bias.
taBlE 1 - avER agEa noMInal taRIff R atEs,B 1966-89
Sectors/Industries 1966 1973 1980 1984 1989
Agriculture 53 34 53.8 57.3 29.0
Mining 27 22 27.0 16.7 24.8
Manufacturing
Non-Metallic Minerals & Products 79 52 107.5 98.7 44.8
Metallurgy 54 40 54.3 72.8 46.7
Machinery 48 38 56.3 62.1 51.6
Electrical Equipment 114 56 101.9 115.9 54.5
Transportation Equipment 108 43 101.9 115.9 52.2
Wood Products 45 66 125.3 101.1 32.9
Furniture 132 76 148.2 169.9 44.9
Paper 93 49 120.2 82.2 37.2
Rubber 101 65 107.3 101.7 64.4
Leather 108 73 156.6 135.2 51.1
Chemicals 53 22 50.3 34.2 42.3
Pharmaceutical Products 48 21 27.9 42.2 43.4
Perfumery, Soaps, etc. 192 48 160.5 184.4 76.5
Plastics 122 44 203.8 164.3 61.7
Textiles 181 91 167.3 161.6 84.0
Apparel 226 106 181.2 192.2 82.1
Food Products 82 73 107.8 84.2 42.9
Beverages 205 131 179.0 70.5 78.1
Tobacco Products 193 141 184.6 204.7 88.8
Printing and Publishing 122 35 85.5 71.1 34.1
Miscellaneous Manufacturing 104 42 87.0 136.5 60.2
Manufacturing Average: 99 57 99.4 90.0 51.2
Notes:a. The average tariff is calculated as a simple mean over the relevant tariff line items in the tariff schedule. b. includes surcharges.
Source:reproduced from estimates presented in Braga (1992).
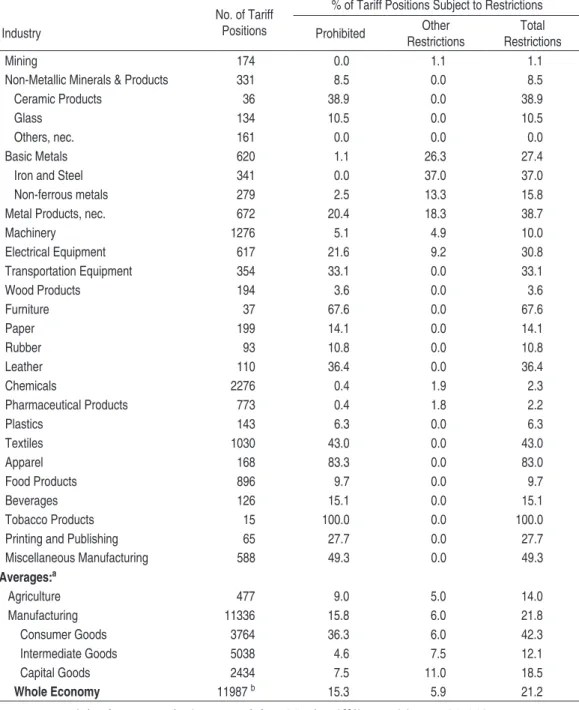
in 1989 explicit nontariff barriers included an extensive list of quantitative import restrictions, covering 21 percent of all items in the tariff schedule, as indicated in Table 2. at the core of this byzantine system was the then infamous annex C of CaCeX, an extensive list of (supposedly) temporary import prohibitions. The 15 percent coverage of all tariff line items understates the importance of these restric-tions. The import prohibitions covered many major products (including all automo-biles, most apparel products and nearly all household appliances). They covered 36 percent of all consumer goods. Such coverage guaranteed that there would be little, or no, effect from reducing tariffs. For example, in the case of tobacco products, the average tariff was reduced from 205 percent to 89 percent in 1989, but the actual importation of all tobacco products remained strictly prohibited. initially, the tariff reform beginning in 1988 was mostly for show. it nevertheless was a good stepping stone for the more sweeping trade policy reform that was soon to come.
Beginning in early 1990 with the Collor administration trade policy liberalization was pressed more forcefully. import programs negotiated at the individual firm level by CaCeX were abolished. The number of special import regimes was further reduced. importantly, nontariff barriers were drastically pruned, with only a few remaining for reasons related to public health, national defense and environment.
With the elimination most non-tariff barriers, the centerpiece of the trade policy reform then became a revamping of tariffs. a program for tariff reduction, to be introduced over a period of four years, was initiated in early 1990.2 The objectives
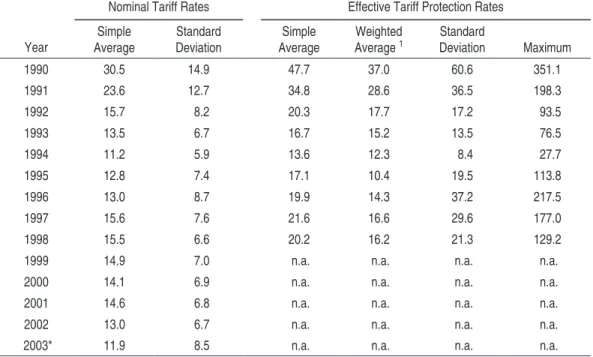
of the program were to achieve a nominal tariff mode of 20 percent by 1994, with effective tariff rates for industry also approximating 20 percent. Products with a clear comparative advantage were to be set at zero percent, with agricultural pro-ducts have rates of 10 percent. Propro-ducts that used inputs having zero rated tariffs were to carry tariffs of 10, 15 or 20 percent. imports of other products were to be taxed at 20 percent. Some exceptions in the form of more generous tariff protec-tion had to be made however in the case of computer-related products (35 percent), electronic products and appliances (30 percent), some chemicals (30 percent), and automobiles and trucks (35 percent). The timetable for the tariff reductions was adhered to. By 1994 average tariffs had been reduced to 11.2 percent, as observed in Table 3. While substantial reductions between 1989 and 1994 occurred across the board, relatively high nominal tariff protection has persisted for transportation equipment (e.g., automobiles, buses and trucks), machinery, basic chemicals, apparel and dairy products.
taBlE 2 – covER agE of ExPlIcIt non-taRIff BaRRIERs, 1989
No. of Tariff Positions
% of Tariff Positions Subject to Restrictions
Industry Prohibited Other
Restrictions
Total Restrictions
Mining 174 0.0 1.1 1.1
Non-Metallic Minerals & Products 331 8.5 0.0 8.5
Ceramic Products 36 38.9 0.0 38.9
Glass 134 10.5 0.0 10.5
Others, nec. 161 0.0 0.0 0.0
Basic Metals 620 1.1 26.3 27.4
Iron and Steel 341 0.0 37.0 37.0
Non-ferrous metals 279 2.5 13.3 15.8
Metal Products, nec. 672 20.4 18.3 38.7
Machinery 1276 5.1 4.9 10.0
Electrical Equipment 617 21.6 9.2 30.8
Transportation Equipment 354 33.1 0.0 33.1
Wood Products 194 3.6 0.0 3.6
Furniture 37 67.6 0.0 67.6
Paper 199 14.1 0.0 14.1
Rubber 93 10.8 0.0 10.8
Leather 110 36.4 0.0 36.4
Chemicals 2276 0.4 1.9 2.3
Pharmaceutical Products 773 0.4 1.8 2.2
Plastics 143 6.3 0.0 6.3
Textiles 1030 43.0 0.0 43.0
Apparel 168 83.3 0.0 83.0
Food Products 896 9.7 0.0 9.7
Beverages 126 15.1 0.0 15.1
Tobacco Products 15 100.0 0.0 100.0
Printing and Publishing 65 27.7 0.0 27.7
Miscellaneous Manufacturing 588 49.3 0.0 49.3
Averages:a
Agriculture 477 9.0 5.0 14.0
Manufacturing 11336 15.8 6.0 21.8
Consumer Goods 3764 36.3 6.0 42.3
Intermediate Goods 5038 4.6 7.5 12.1
Capital Goods 2434 7.5 11.0 18.5
Whole Economy 11987 b 15.3 5.9 21.2
Notes: a. Unweighted averages. b. aggregated data. Total tariff line positions = 12,443.
taBlE 3 – noMInal and EffEctIvE taRIff PRotEctIon, 1990-2003 (%)
Nominal Tariff Rates Effective Tariff Protection Rates
Year
Simple Average
Standard Deviation
Simple Average
Weighted Average 1
Standard
Deviation Maximum
1990 30.5 14.9 47.7 37.0 60.6 351.1
1991 23.6 12.7 34.8 28.6 36.5 198.3
1992 15.7 8.2 20.3 17.7 17.2 93.5
1993 13.5 6.7 16.7 15.2 13.5 76.5
1994 11.2 5.9 13.6 12.3 8.4 27.7
1995 12.8 7.4 17.1 10.4 19.5 113.8
1996 13.0 8.7 19.9 14.3 37.2 217.5
1997 15.6 7.6 21.6 16.6 29.6 177.0
1998 15.5 6.6 20.2 16.2 21.3 129.2
1999 14.9 7.0 n.a. n.a. n.a. n.a.
2000 14.1 6.9 n.a. n.a. n.a. n.a.
2001 14.6 6.8 n.a. n.a. n.a. n.a.
2002 13.0 6.7 n.a. n.a. n.a. n.a.
2003* 11.9 8.5 n.a. n.a. n.a. n.a.
Notes: 1. averages weighted by value added. n.a. not available. * preliminary data as related to the Common external Tariff of MerCOSUL, with some adjustments made for Brazil. For the years since 2003, the calculation of Brazil’s nominal average tariff has been complicated by the obfuscated nature of Brazil’s exceptions to the CeT. The mean for 2003 may also be an underestimate.
Sources: Kume, Piani and Souza (2000) for 1990-1998 and authors’ calculations from the tariff schedules for 1999-2003. recent information is available on the SeCeX website (www.desenvolvimento. gov.br).
effective tariff levels were also reduced dramatically during the same period. The average effective tariff rate, weighted by value added, fell to 12.3 percent by 1994. it is this measure that best reflects the effects of tariff policies on economic activity processes and the pull of resources into those protected domestic market sales activi-ties. at the beginning of the tariff liberalization process, the most heavily protected sectors were automobiles, textiles, apparel, and some manufactured food products. By the end of the trade liberalization process, effective tariff protection was reduced to the 20 percent range for most sectors. Only in the case of automobiles, trucks, buses and motorcycles is the rate of effective tariff extremely high – i.e., 129 percent in 1998.3
accompanying the trade liberalization were some important institutional chan-ges. Most significantly, CaCeX – the powerful trade control agency – was
ded, with its functions redefined and farmed out to other government agencies. Such an action was consistent with the market-based reforms being pursued by the Government and other institutional restructuring within the Government during the early 1990s. a number of other government regulatory bodies were closed, inclu-ding the Brazilian Coffee institute and the Brazilian Sugar and alcohol agency. a privatization program for the extensive public sector enterprises was also initiated.
Tariff levels reached their lowest point in 1994. Beginning with the initiation of the Plano Real in mid-1994 there began a process of modest reversal and slight re-trocession in the trade reforms. Between 1994 and 2002 the average tariff rate was increased from 11.2 percent to 14.6 percent in 2001, before falling to 13.0 percent in 2002. For the average effective tariff rate there was an increase from 12.3 percent in 1994 to 16.2 percent in 1998. (Table 3)
Despite the partial backsliding of the trade policy reforms, Brazil is still much bet-ter off than earlier, but its protection levels are still high when compared to other countries. This puts Brazil at a disadvantage in contesting export markets and in providing incentives for export production. Moreover, during the past seven years other countries, including Brazil’s competitors, have gone forward in reforming their trade regimes and consolidating those reforms. Chile, for example, has gradu-ally lowered its uniform nominal tariff to 6 percent in 2003. Singapore and Hong Kong both have zero tariffs. These advances elsewhere have occurred while Brazil has drifted backwards. The reasons for the observed retrogression seem to include: (a) balance of payments pressures originating from the increased currency overva-luation, which in turn stemmed from the Plano Real and lasted until 1999;4 (b) the marshalling of traditional protectionist forces (which were caught by surprise in 1990); and (c) pressure coming from neighboring Mercosul countries. The failure of exports to grow substantially after the trade policy liberalization provided argu-ments for interested parties to partially abandon those efforts – irrespective of the stronger economic argument that the currency overvaluation had short-circuited the expected export response. Notwithstanding the slight erosion of the liberalization program, most observers have cited substantial productivity increases as a result of the liberalization, as will be discussed in the below in Section iii.
Present trade Policy Posture. Present trade policies are tempered by Brazil’s mem-bership in and ambitions for Mercosul. a common external tariff (albeit with many exceptions) exists for Mercosul, and this constitutes an argument for pursuing trade
policy initiatives as a part of the regional bloc. import restrictions center around tariffs, as discussed above. in the past several years, little overall change has occur-red. While the Government by and large has held the line with respect to nontariff barriers after their drastic reduction, noted above, in the early 1990s, some slippage on economic protection grounds can be observed. For example, presently quotas exist for the import of textile products from Taiwan.
another area of possible import restrictions relates to unfair trade practices, in-volving anti-dumping duties, safeguards, and protection against the use of export subsidies. The Brazilian anti-dumping legislation is based on that existing in the United States. as in the US case, such legislation is frequently used as a justification for relief from uncomfortable foreign competition. The arguments to apply such anti-dumping actions, initiated by producers or their representatives, have found sympathetic ears within government. in actions such as these there is a tendency to ignore consumer interests, and the recent Brazilian experience proves no exception. as possibly to be expected with the initiation of such procedures, the number of anti-dumping cases has grown in recent years. in the three-year period 1998-2000 in 23 cases remedial measures were applied, as opposed to 12 for 1991-1993.5
Some export restrictions also exist as a part of the current trade policy posture. although – as to be discussed below - export licensing formally exists, those autho-rizations are virtually automatic in most cases. export prohibitions and taxes are used sparingly. For example, in May 2001 an export tax amounting to 9 percent of the exported FOB value was established for all exports of bovine leather and hides. The stated reason for its imposition was provide protection to those industries, espe-cially shoes, using leather as an input. at the same time an export tax of 55 percent was announced for arms and munitions exports to South and Central america.
anti-Export Bias. an anti-export bias in economic policies can be ascertained and examined through a comparison of the incentives for production for domestic sales and those for producing for export sales. Since tariffs are, on the average, higher quantitatively than any existent incentives for export sales, an anti-export bias for Brazil is evident, coming from the exercise of government policies. The logical policy implication arising from this observation is not to provide subsidies to exports but rather to reduce some of the disincentives for those exports and, as well as, to conti-nue to reduce the incentives for domestic market sales through the pursuit of further tariff decreases. This is a policy approach that has worked in other countries.
3 soME oBsERvEd EffEcts of tRadE PolIcIEs and tRadE PolIcy lIBERalIzatIon
a. Productivity growth
Productivity growth has long been recognized as a driving force in a country’s economic growth. The most simple measure of productivity – the value of output divided by labor inputs – enables facile cross-country comparisons, which clearly show that developing countries, including Brazil, have much lower productivity levels than the more advanced industrial countries. Catching up involves increasing productivity levels, i.e., productivity growth. Studies of labor productivity growth for Brazil show reasonably high productivity growth for Brazil during the 1970, especially during the boom years of the early 1970s, followed by very slow produc-tivity growth during the problematic 1980s and then fairly rapid labor producproduc-tivity growth during the 1990s.6
The problem with labor productivity measurements is that they do not capture the contribution of non-labor factors of production and therefore overstate the contribu-tion of labor alone. More complete and recent work has attempted to include non-labor factors, especially capital, and focus on the concept of total factor productivity (TFP). Several recent studies show high aggregate TFP growth for Brazil during the 1970s followed by low, or even negative, TFP growth in the 1980s.7 Brazil’s
experience is similar to that of other Latin american countries, although Brazilian TFP growth during the 1970s seems to have been especially robust.
Most studies of total factor productivity use fairly highly aggregated data for the empirical estimates. While illustrative, more complete analysis can be provided by the use of data at the enterprise level over time. Some recent estimates using such information are presented in Table 4. The important thing demonstrated by these – and other studies – is that the low productivity growth in the 1980s was followed by more rapid productivity growth in the 1990s.
6 For representative work for the industrial sector, see Braga and rossi (1988), Bonelli (1998) and Bonelli and Fonseca (1998).
taBlE 4 - EstIM atEs of annualIzEd tfP gRoWth In BR azIlIan M anufactuRIng, 1987-98, (In %)
Period Muendler et al.a Gomes
1987-90 - 0.81 - 2.49
1991-98 0.29 5.99
Note: a. Muendler et al. estimates are for 13 selected industries.
Source: World Bank (2001).
The question that arises is why this turnaround in productivity growth occurred. a general explanation is that the economic reforms undertaken by Brazilian Governments beginning in 1990 changed the economic and investment climate. Two more specific explanations can also be posited: (a) foreign direct investment – stimu-lated by the improved investment climate – induced higher productivity growth; and (b) the trade policy liberalization – as predicted by economic theory – had a salutary effect on productivity and the competitiveness of the Brazilian economy.
Relationship with fdI. as noted above, subsequent to the microeconomic reforms beginning in the early 1990s and the macroeconomic stabilization in the mid-1990s, net FDi flows to Brazil began to grow substantially. Questions include: (i) what is the nature of the relationship, if any?; and (ii) which way does any causality flow? Or is any relationship more complex than a simple bivariate one. a couple of studies for Brazil present some tentative, but inconclusive, evidence.
One recent analysis by Moreira (1999) presents evidence showing a strong posi-tive relationship between the growth of labor productivity across manufacturing industries and the participation of foreign capital in those industries for the period 1990-97. another study (Bonelli, 1998), while addressing productivity questions, has focused on the related concept of competitiveness, as measured by unit labor costs.8 its conclusion is that competitiveness increases (declines in unit labor costs) are only partially associated with FDi growth or FDi presence in a given manufac-turing industry. it should be noted that both these studies are based on aggregated industry comparisons within Brazil. The estimates are generally inconclusive and indicative that the relationship between productivity growth and FDi is more com-plex than can be satisfactorily explained by a simple bivariate analysis. One is forced to search for other explanations for the high observed Brazilian productivity growth in the 1990s.
Relationship with trade Policy liberalization. in the case of the relationship between productivity growth and trade policy liberalization, the questions are the same as posed with foreign direct investment. There are however strong theoretical grounds to posit a causal relationship. a more competitive market environment resulting from trade policy liberalization is expected to stimulate productivity enhancements. Without such productivity (and competitiveness) gains firms run the risk of failure. The inducements to adjust to the more open trade policy regime are compelling. also, liberalized and greater imports, especially of intermediate and capital goods, are likely to embody improved technology, which in turn may stimulate productivity growth. Finally, unlike the case with FDi, there are a number of empirical studies for Brazil that have concluded that trade policy liberalization has resulted in produc-tivity improvements on the part of Brazilian industry.
a study by Hay (2001), using data at the enterprise level for a sample of large Brazilian industrial firms, has presented evidence that the reduction of non-tariff barriers and tariffs in the early 1990s had significant positive effects on TFP growth. Similar effects were found for deregulation and privatization. a study by rossi and Ferreira (1999) produced comparable conclusions; a strong impact of the reduction of nominal and effective protection was observed on the growth of aggregate TFP growth. another study (SiLVa, 2000), using data from a large sample of firms, also found evidence to support the hypothesis that the trade liberalization prompted increases in labor productivity.
The most ambitious and complete study analyzing the dimensions of TFP growth in Brazil is that of Muendler et al. (2001). Using data at the enterprise level, es-timates were first made for firm level TFP and TFP growth. This permitted the analysis of TFP in relationship to other firm and industry characteristics. a very clear relationship emerged between TFP growth and trade liberalization, leading to the conclusion that the import liberalization in the early 1990s played a major role in stimulating productivity growth.
This evidence for Brazil on the link between trade liberalization and productivity is consistent with that from other countries.9 in Mexico, for example, a recent study
(World Bank, 1999) found that there was a strong association at the industry level between TFP growth, on the one hand, and export orientation (as measured by the ratio of exports to total sales), on the other.
in sum, economic theory predicts that trade policy liberalization will result in higher productivity and TFP growth. The available empirical evidence shows that this has indeed been the case with the Brazilian experience.
b. disappointing Export growth
economic theory also predicts that trade policy liberalization will result in increased exports and improved export performance. This has not been the case. The question is why. Before addressing that question, an overview of Brazil’s export performance is necessary.
in comparison with most other countries – and especially the more advanced eco-nomies – Brazil’s export growth has been lackluster. Over the past fifty years there has been an unprecedented expansion in world trade. Many countries have been able to reap the benefits of such an expansion through their own accelerated gro-wth. Brazil however has been left behind. as observed in Figure 1, its share of total world exports has declined over the past fifty years, falling from over 2 percent of the total in 1948 to less than 1 percent by 2000 (considerably less than its share in total world GDP). Figure 1 also presents for comparison purposes Mexico and China. While starting from lower levels than Brazil in the late 1940s, by 2000 both had far surpassed Brazil’s share of world exports.
fIguRE 1 – PERcEntagE shaREs In total WoRld ExPoRts, 1948-2000
0,0 0,5 1,0 1,5 2,0 2,5 3,0 3,5 4,0 4,5
1948 1953 1963 1973 1983 1993 2000 Brazil Mexico China
Source: WTO, International trade statistics, 2001.
end of the 1970s.10 During the 1990s total exports in nominal US dollars grew by
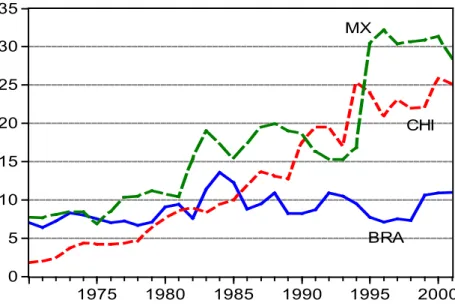
only 5.8 percent annually. (Table 5) in comparison with other countries, Brazil’s export performance also appears mediocre. Many countries have benefited from the sustained boom in world trade over the past forty years, but Brazil – despite some spurts of rapid export growth, especially of manufactures – has not. a comparison of Brazil with China and Mexico – two countries discussed above and also with a strong FDi attraction - is presented in Figure 2. Compared to China and Mexico, Brazil’s exports have stagnated. in addition to its stagnation, Brazil’s ratio of exports to GDP is among the very lowest in the world. The question is why Brazil has done so poorly in its export performance.
explaining Brazil’s mediocre export performance up to the early 1990s is relatively simple – heavy handed domestic market protection (including de facto import pro-hibitions and prohibitive tariffs of over 100 percent).11 But why was export
perfor-mance so poor during the 1990s? after all, there had been a sweeping trade liberal-ization in the early 1990s, and the experience elsewhere, plus theoretical reasoning, would indicate that a considerable increase in exports would occur. it did not. The answer lies in the conduct of macroeconomic policies. The macroeconomic stabiliza-tion program embodied in the Plano Real beginning in 1994 used the exchange rate as a nominal anchor, resulting in substantial real currency appreciation. Such appreciation effectively short-circuited the export response. in addition, as also to be expected from the international experience, increasing real currency appreciation led to a partial backsliding on the trade liberalization, thus undermining further the export impetus. The problem of currency overvaluation disappeared with the establishment of a floating exchange rate regime in January 1999 and the subsequent depreciation. after a quite respectable export performance in 2000 (total export growth of 15 percent, with manufactures growing at 19 percent), export growth in 2001 (when total exports grew by only 5.7 percent) and in 2002 was disappointing. The reasons for this lackluster behavior in 2001 and 2002 seem to lie in the fall in key commodity prices, recession in the major industrial markets and instability in the important argentine market. More recently, exports have been growing strongly, with export growth of 21 percent in 2003, 32 percent in 2004 and then falling slightly to 23 percent in 2005. it may finally be that after the delay afforded by the overvaluation episode (related to the implementation of the Plano Real) the effects of the trade policy liberalization of the early 1990s are finally being felt. More recently however (2005-2007) the ongoing real appreciation of the real appears to have been undermining these effects on export performance. The country’s manufacturing
10 a discussion of Brazil’s export performance and the related policy environment is contained in Tyler (2003).
export growth has been dampened, with nominal US$ growth rates falling from an average of 25.6 percent for 2003-05 to 14.7 percent in 2006, with further growth erosion observed for the first half on 2007.12 Overall export performance, led by Brazil’s primary products, has benefited however by an international commodity price boom, which has offset the adverse effects of the currency appreciation.
taBlE 5 - annual ExPoRt gRoWth R atEs foR M aJoR PRoduct catEgoRIEs, 1964-2006 (%)
Period Primary Semi-Manufactured Manufactured Total Exports
1970-1980 15.3 25.2 36.0 22.1
1980-1990 0.3 8.1 6.5 4.5
1990-2000 3.7 5.2 6.7 5.8
2000-2006 21.4 14.9 14.9 16.5
1964-2006 8.7 13.0 17.4 11.5
Note:calculated from export values expressed in nominal US$.
Source:SeCeX data on its MDiC website (www.desenvolvimento.gov.br).
fIguRE 2 – ExPoRts as a PERcEntagE of gdP foR BR azIl, chIna and MExIco, 1970-2001 (In %)
0 5 10 15 20 25 30 35
1975 1980 1985 1990 1995 2000
MX
CHI
BRA
Source: Computed from World Bank SiMa data, quoted by Herrera, 2002.
The experience with Brazilian macroeconomic policies in the period following the trade policy liberalization illustrates the importance of analytically isolating different effects. a computable general equilibrium (CGe) model can help do this. Such a framework, despite its complications, has been chosen for this study.
4 sIMulatIons of BRazIlIan tRadE PolIcy changEs usIng a coMPutaBlE gEnERal EquIlIBRIuM (cgE) ModEl
Why use a cgE Model? in recent years theoretical and computational advances have permitted the development and use of computable general equilibrium (CGe) mo-dels for economic analysis. Some features of these momo-dels render them quite suitable for studying the effect of trade policy changes and arrangements. Quantification of the effects of trade policy changes is desirable in order to best assess the magnitudes of effects, the trade-offs and benefits/costs to different policy alternatives. One area where CGe models have been recently used is in the analysis of effects stemming from differing regional trade agreements (rTas), as for example a free trade agree-ment between different countries.
Major features of cgE Models. Over the past twenty years the use of CGe models has become commonplace in order to assess the effects – both direct and indirect – of economic shocks or policy changes. advances in computational techniques have facilitated the use of such models. The basic idea underlying a CGe modeling exercise is relatively simple. it involves: (a) the construction of a mathematical model of an economy; (b) the collection of data for a time period for those variables for which data are available; (c) calibration and solution of the model mathematically to establish the initial equilibrium values; (d) imposition of a shock to the initial equilibrium in the form of some exogenous event, such as a policy change; and (e) the observation of simulations derived from the introduction of the shock on various variable values.
Consequently, upon solution all the effects – direct and indirect – of a given shock can be assessed.
The advantages in the use of CGe models for policy simulations are several. First, such models are based upon solid microeconomic theoretical foundations. Second, they are complete in that they model the entire economy and can be used to capture and estimate total effects, taking into account interdependencies and linkages imbed-ded in the functioning of the economy. Third, CGe models generate quantifiable results for the impact of policy changes, including for output, resource allocation, and welfare. income distributional implications can also be simulated. Fourth, since policy impacts are quantitatively estimated, analyses of alternative policy packages can be assessed and ranked in a consistent framework. Fifth, CGe models are well suited to analyze major policy changes as opposed to the marginal changes analyzed in a partial equilibrium framework.
While the advantages of CGe models are compelling, serious shortcomings are also present. First, CGe models require massive and detailed data inputs, building upon an elaborate social accounting matrix framework, including household con-sumer surveys, national account information, fiscal data, trade flow and restriction information, etc., for the multiple regions (or countries) being modeled. Since the reliability of such secondary data is often questionable, models employing such data to construct a benchmark period equilibrium possess no real means to test the model structure, as is frequently possible with the statistical testing of econometric models. Moreover, the simulation results will be heavily dependent upon the benchmark year data, as well as the model parameters and any other related assumptions. Second, the aggregation in CGe models, normally mandated by data limitation consider-ations, may mask important effects in any simulation. in other words, sectoral detail can not reasonably be expected from CGe models. Third, the more elaborate and detailed the CGe model, the more likely it is to become a “black box” for which re-sult interpretation is difficult. Fourth, there is no time dimension in a CGe model. The supposition is that with the imposed shock (e.g., policy change) the economy moves from one equilibrium to another. How long this adjustment takes is a mat-ter of judgment. Fifth, there is no financial sector in CGe models. Sixth, and very importantly, despite efforts to dynamize CGe models, they are essentially compara-tive static models. Finally, some important effects of trade policy changes may be non-economic or political; these effects can not be quantified and are therefore not captured by CGe models. These problems notwithstanding, CGe models are now also widely used by governments to assess the impacts of policy changes.13
CGe models have proved useful in analyzing the effects of trade policy changes. in particular, they have been employed for examining ex ante the expected economic ef-fects of alternative trade policies, including unilateral trade reform, multilateral trade liberalization, and different proposed preferential trading arrangements. analysis can be conducted on a country specific basis or worldwide. it can also be focused on specific sectors or sector groupings. Some recent examples include, inter alia: anderson, Martin and van der Mensbrugge (2005) on the expected impacts of the Doha round trade liberalization on developing countries; Fugazza and Vanzetti (2005) on the possible effects of South-South preferential trading arrangements; anderson et al. (2007) on the effects of distortions to agricultural incentives in Latin america; Ferreira Filho and Horridge (2005) and Bussolo et al. (2005) on the possible effects of the Doha round on poverty in Brazil; Gurgel (2006) for an analysis of Brazilian agrobusiness trade likely to result from the Doha round; and Gurgel (2007) on trade agreements and their possible impacts on family agriculture in Brazil.
cgE Model used. The CGe model used in the exercise has been adopted from others that have been developed and used by the World Bank.14 it employs features of the
Global Trade analysis Project (GTaP) model, and importantly it makes use of the GTaP database, specifically the fifth version of the updated and expended database, termed GTaP5. important characteristics of the model stem from closure routines, mainly that: (i) the exchange rate adjusts to ensure current account stability (main-taining the initial observed, and presumably financable, current account deficit; and (ii) factor prices adjust to clear the market, in effect ensuring full employment of factors.
The model is a comparative static, constant returns to scale, multiregional and multi-sectoral quantitative model. in order to assess the impact of trade policy changes on trade flows, the CGe model divides the world into a number of regions. For the Brazil model, a number of regions, in addition to Brazil, have been incorporated, including argentina, Uruguay, Mexico, the remainder of Latin america, the US, Canada, the european Union and Japan. For most purposes of the analysis, the rest of the world beyond Brazil is lumped together. Factors of production included in the model include land, unskilled labor, skilled labor, capital and natural resources.
The sectors specified for the model have had to conform to the GTaP5 dataset. The latter includes 57 sectors, but some aggregations have been undertaken; the version used for our simulations contains 22 sectors. Because most of the documentation of
the data and model are available in Harrison et al. (2003), we summarize the main features here.
Productive sectors seek to minimize costs subject to technological constraints. intermediate inputs and primary factors (e.g., labor, capital, and land) are used. Value added combines primary factors in a Cobb-Douglas production function. intermediate inputs and aggregated value added are used in a Leontief production function. each intermediate input is a composite of domestic and imported goods, combined through a CeS function. Primary factors are specified as mobile across sectors within a region but immobile internationally. The amount of capital, labor and land available to any economy is fixed. Output is differentiated between domes-tic output and exports in a Constant elasdomes-ticity Transformation (CeT) function, but exports are not differentiated by destination country.
each region has a single representative consumer who maximizes utility, as well as a single government agent. Demand is characterized by a nested armington structure for each of the sectors, which allow multi-stage budgeting. We consider a Cobb-Douglas demand function at the top level, among the 22 goods. Consumers first choose how much of each armington aggregate good to consume, subject to aggregate incomes and composite prices of the aggregate goods. The armington aggregate good is a constant elasticity of substitution (CeS) composite of domestic production and aggregate imports. Consumers then decide how much to spend on aggregate imports and the domestic good subject to the prior decision of how much income will be spent on each individual sector. Preferences for aggregate imports and domestic goods are represented by a CeS utility function. Finally, consumers decide how to allocate expenditures across imports from the other regions based on their CeS utility function for imports from different regions and income allocated to consumption of imports from the previous higher level decision.
a major difficulty was in calibrating the model with Brazilian data, since the data for Brazil in the original GTaP5 data set were out-of-date and in some cases suspect.15 The 1996 iBGe input-output table has been introduced, with some adjustments, into the GTaP database, replacing the original GTaP Brazilian data. The GTaP5 database uses trade statistics from 1997, and some adjustments were necessary to conform the Brazilian i-O data to the trade data, and vice versa. Trade restrictions are measured by tariffs.16 For the “base year” of 1996/7 the common external tariff (CeT) for MerCOSUL was used, with Brazil specific exceptions. The tariff line information was used to map into the 57 GTaP sectors. Similar procedures, em-ploying tariff line information from the Brazilian Tariff Nomenclature existing at the time, were used to estimate the 1989 tariff levels, i.e., before the trade policy liberalization.
it is important to highlight the differences of our model in relation to previous stud-ies. The most important advance in our modeling exercise compared to others (e.g., CarNeirO; arBaCHe (2002) and Barros et al. (2000)) is the use of a multi-regional model instead of a single region model. This means we include endogenous effects in terms of output and trade from commercial partners. although our ap-proach may not bring considerable differences in the results, it is a more complete way to represent the effects and feedbacks among several economies when a policy change involving trade exercise is simulated. it becomes more important when we deal with trade openness among countries with considerable participation in the to-tal trade flows of each other. This is indeed the case of Brazil and its MerCOSUL partners. Other differences of our model compared to the models used by Carneiro and arbache and Barros et al. are related to: (i) assumptions about employment and labor market (as we deal with long run); and (ii) the sectoral aggregation (we have a more detailed and complete representation of the agricultural sectors).
solution algorithm. The model is formulated in the software GaMS (BrOOKe et al., 1998), using the MPSGe programming language, developed by rutherford (1999). MPSGe uses the benchmark equilibrium of the Social account Matrix and assigned elasticities to express the CGe model as a Mixed Complimentarity Problem (MCP) (MaTHieSeN, 1985), in terms of equations representing zero profit, market clearance and income balance conditions. MPSGe uses the solver PaTH, developed by to solve MCP problems.
15 The Brazilian data for the GTaP5 database relies on the 1985 Brazilian input-output data (WaLMSLey; MCDOUGaLL, 2001).
Estimating Procedures and Rationale. The analytical objective in the case at hand is to assess the economic changes, primarily in social welfare, resultant from the partial trade policy liberalization beginning in 1989 and continuing until roughly 1994. a point of departure in using a CGe model to better understand the effects of an eco-nomic policy change is the assumption that the economy is at a rough equilibrium before the simulated policy change. With the introduction of the quantified policy change (shock, or in this case the change in tariff levels) the economy as modeled in the CGe framework moves to a new equilibrium. Thus, the introduced “shock vector” consisted of the 1989 tariff levels, thereby simulating a reversion to 1989 tariffs. New variable values are then measured to gauge the effect of the policy chan-ge. in this case the initial equilibrium point is not the pre-trade liberalization period of 1989, with the introduction of the new, liberalized and lower tariffs. rather our initial point is the post-liberalization period of 1996/7, with the CGe model calibra-ted with data from that period. The “shock” comes in introducing the 1989 tariffs into the economy. What would happen if the clock were set back and the 1989 levels of tariff protection were reintroduced? The mirror images of the effects simulated by such an exercise are the effects of the 1989 liberalization. For instance, a loss in economic welfare in reverting to 1989 tariff levels certeris paribus is equivalent to a commensurate gain in welfare resulting from the liberalization from 1989 tariffs to those prevailing in 1997 (also roughly the same as existing in 2004).
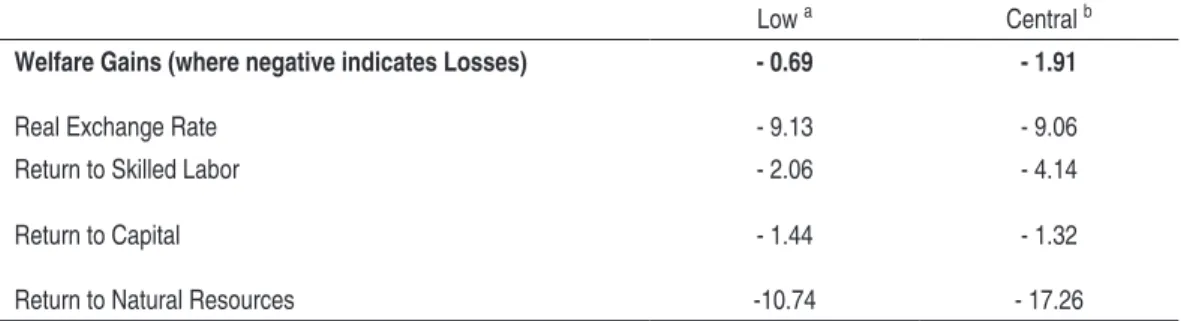
simulation Results. The main results are presented in Table 6. With the simulated reintroduction of 1989 tariff levels, welfare – as measured by real consumption levels17 – is simulated to decline by 1.9 percent (under the central elasticity assump-tions) and is equivalent to a deadweight loss of US$9.7 billion for the economy. This clearly suggests comparable – and large – welfare gains emanating from the trade policy liberalization in the early 1990s.18 By way of comparison of the magnitudes,
Harrison et al. (2003), using basically the same model, estimated that if Brazil were to unilaterally reduce its 1997 tariff levels by 50 percent, the comparable welfare gain would be 0.4 percent. This suggests that the larger positive effect resulted from the earlier and actual trade liberalization.
in addition to the welfare losses stemming from the simulated reversion to 1989 tariff levels, the high protection levels would afford a real currency appreciation of 9.1 percent. Conversely, a real depreciation of a comparable amount should have occurred with the early 1990s liberalization. This in fact was not allowed to occur and continued currency overvaluation was sustained through the pursuit of Brazilian
17 The change in welfare is the Hicksian equivalent variation. We report it as a percent of consumption. 18 The model simulation also shows a fall in argentine welfare (1.3 percent) as a result of a reversion to
macroeconomic policies,19 thereby effectively short-circuiting the expected export
expansion and the concomitant welfare increases.
taBlE 6 – EffEcts of a REvERsIon to 1989 taRIff lEvEls, changEs ExPREssEd In %
Low a Central b
Welfare Gains (where negative indicates Losses) - 0.69 - 1.91
Real Exchange Rate - 9.13 - 9.06
Return to Skilled Labor - 2.06 - 4.14
Return to Capital - 1.44 - 1.32
Return to Natural Resources -10.74 - 17.26
Notes: a. Low elasticity20 assumptions include:
elasticity of substitution between domestically produced goods and imports = 4 e l a s t i c it y o f s u b s t it u t i o n b e t w e e n i m p o r t s o f d i f f e r e n t c o u n t r i e s = 8 elasticity of transformation between domestic goods and exports = 5
b. Central elasticity assumptions include:
elasticity of substitution between domestically produced goods and imports = 15 e l a s t ic it y o f s u b s t it u t io n b e t we e n i mp o r t s o f d i f f e r e nt c o u nt r i e s = 3 0 elasticity of transformation between domestic goods and exports = 5
Source: authors’ estimates.
The simulated change in the returns to factors coming from the reversion to 1989 tariff levels shows reductions for the returns to skilled labor, capital and natural resources, with the later being particularly adversely effected. in the case of capital, under the central elasticities case, the return to capital falls less than welfare in ge-neral suggesting that the protection system existing prior to 1989 benefited capital proportionately. With the trade liberalization beginning in 1989, factor returns were increased, particularly for natural resources, reflecting the country’s comparative advantage, which had been previously suppressed by the protection system.
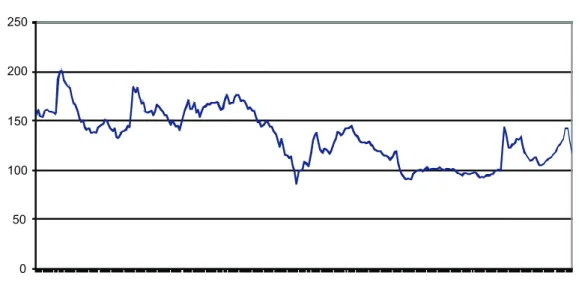
19 annex Figure 1 shows the evolution of the real exchange rate over the period in question. See also Ferreira (2002).
The sector changes as revealed from the simulations are largely as expected. Table 7 presents some sectoral results. in general, with the reversion to 1989 tariff levels, the simulations show: (a) a changing production composition with increases in ou-tput occurring in many manufacturing activities and declines occurring generally in agriculturally-based products and light manufacturing; (b) increases in most consumer and final product prices; and (c) generalized decreases in trade flows, both for exports and imports. Conversely, these results suggest opposite effects certeris paribus for the early-1990s trade liberalization. economic welfare, as reflected in real consumption levels, is seen to have increased as a result of the trade reforms. Sectors experiencing output increasing effects, notwithstanding other policy effects, were oil seeds, vegetable oils, meat products, petroleum, sugar, leather products, wood products and other light manufacturing products. The most negatively impacted sectors from the trade liberalization were seemingly motor vehicles and parts and electronic equipment. Trade flows – for both exports and imports – were stimulated by the trade policy reforms. in general, exports showed greater expansionary effects in those sectors with the greatest increases in output.
taBlE 7 – sEctoR al EffEcts of a REvERsIon to 1989 taRIff lEvEls, changEs ExPREssEd In %
Changes in
Production Changes in Exports Changes in Imports
Sector Low Central Low Central Low Central
Paddy Rice 0.30 3.04 -29.98 -63.62
Cereal Grains 4.83 24.80 -24.57 -24.19 -33.21 -83.84 Oil Seeds -8.95 -12.32 -27.49 -37.50 -32.71 -78.08
Sugar Cane & Beets -2.74 -3.80
Other Crops, n.e.c. -0.08 3.05 -25.84 -29.16 -27.60 -75.24 Bovine Cattle, Sheep & Horses, etc. -0.08 2.89 -33.02 -74.17 Animal Products, n.e.c. -3.02 -3.29 -27.43 -36.02 -29.92 -79.13
Raw Milk 0.62 1.42
Oil -10.59 -25.89 -26.47 -35.13 30.64 72.66
Minerals, n.e.c. -4.46 2.89 -23.75 -23.82 -26.82 -76.56 Bovine Meat Products -0.48 1.81 -25.85 -30.34 -18.15 -46.38
Meat Products, n.e.c. -4.59 -6.74 -27.82 -35.53 1.02 -42.84 Vegetable Oils & Fats -12.70 -19.57 -30.36 -43.81 16.16 14.85
Dairy Products 1.25 3.93 -24.35 -59.48
Processed Rice 1.60 4.68 -51.38 -91.89
Sugar -5.48 -7.87 -27.03 -34.70
Food Products, n.e.c. -0.06 1.69 -27.78 -32.89 -39.74 -89.01
Textiles 4.92 9.07 -28.43 -35.46 -74.77 -99.70
Wearing Apparel 0.58 2.15 -30.38 -40.83 -72.77 -99.58
Leather Products -6.89 -0.46 -32.65 -35.41 -39.90 -86.75 Lumber & Wood Products -2.56 -2.51 -27.21 -33.64 -20.61 -64.59 Paper Products & Publishing -0.17 2.59 -27.42 -31.94 -35.85 -85.32
Petroleum & Coal Products 6.51 16.67 -11.78 -2.84 -24.32 -78.00 Chemicals, Rubber & plastics 7.65 14.50 -26.24 -29.41 -53.67 -96.68 Mineral Products, n.e.c. 1.31 3.14 -26.62 -33.38 -46.46 -93.18 Ferrous Metals -0.96 10.57 -29.42 -31.30 -44.90 -92.96
Metals, n.e.c. 4.33 21.02 -28.10 -23.36 -46.36 -93.62 Metal Products 2.83 11.46 -28.81 -34.38 -36.92 -86.33 Motor Vehicles and Parts 2.47 48.41 -30.48 -17.09 -27.26 -57.40 Electronic Equipment 16.61 40.97 -26.98 -18.22 -36.74 -90.66
Machinery & Equipment, n.e.c. 9.04 21.08 -25.47 -25.09 -40.13 -90.38
Services -1.14 -4.64 -27.00 -31.79 47.43 211.21
Note: Simulation results with low and central elasticity assumptions are presented separately.
5 concludIng oBsERvatIons
The available empirical evidence supports the contention that the partial trade lib-eralization of the early 1990s has had salutary effects on the Brazilian economy. Widespread productivity gains have been observed, with indications of direct links to the trade liberalization and other related policy reforms. The CGe model simu-lations reported in this paper have the advantage that they examine solely trade policy changes, not the remaining constellation of policies which unquestionably affected economic outcomes for the period in question. Our results suggest sig-nificant welfare gains for the Brazilian economy stemming from the trade policy liberalization.
a less tangible, non-economic effect of the trade policy liberalization in the early 1990s also warrants some mention in passing. Brazil’s isolation in international goods markets was put to an end. The Brazilian consumer was suddenly confronted by much wider product choice and variety. Today products are available – produced by both domestic and foreign establishments – that simply did not exist in the country previously. Trade policies prior to 1990 had effectively cut off Brazil from the world. That is no longer the case.
as argued above, the trade liberalization which took place in the early 1990s was partial in nature and partly reversed in the late-1990s, as pressures from macroeco-nomic policies (the Plano Real mostly) built and protectionist interests regrouped. While the country is clearly much better off today as a result of the trade and other policy reforms, there are still gains to be made by further trade policy liberalization. recent work by Harrison et al (2003) and others document the potential gains for Brazil stemming from such trading arrangements as a Mercosul-european Union FTa, the FTaa (or aLCa), the probable Doha round outcomes, and trade lib-eralization within MerCOSUL.21 This liberalization is also seen, according to the Harrison et al simulations, as being pro-poor in that it would both increase the wages of unskilled labor and decrease relative income inequality.
REfEREncEs
aNDerSON, Kym; MarTiN, Will; VaN Der MeNSBrUGGe, Dominique. Doha merchandise trade reform and the developing countries: what’s at stake?
Paper presented at the Eighth annual conference on global trade analysis. Lubeck, Germany, June 2005.
aNDerSON, Kym; VaLeNzUeLa, ernesto; VaN Der MeNSBrUGGe, Dominique. effects of distortions to agricultural incentives in Latin america.
Paper presented at the tenth annual conference on global trade analysis. Lafayette, indiana, USa, June 2007.
arBaCHe, Jorge S.; DiCKerSON, andy; GreeN, Francis. trade liberalization and wages in developing countries. Universidade de Brasília, July 2002, 35 p. Unpublished paper.
aTHUKOraLa, Premachandra; reiDeL, James. Demand and supply factors in the determination of Nie exports: a simultaneous error-correction model for Hong Kong: a comment. Economic Journal, 104, p. 1411-1414, November 1994. BaCHa, edmar; BONeLLi, regis. accounting for Brazil’s growth experience:
1940-2002. rio de Janeiro: iPea, maio 2004. (Textos de Discussão n. 1018). BarrOS, ricardo P.; COrSeUiL, Carlos H.; CUry, Samir. abertura comercial
e liberalização do fluxo de capitais no Brasil: impactos sobre a pobreza e desi-gualdade. in: HeNriQUeS, ricardo (ed.). desigualdade e Pobreza no Brasil. rio de Janeiro: iPea, p. 271-298, 2000.
BerGSMaN, Joel. Brazil:industrialization and trade policies. London: Oxford Uni-versity Press, 1970.
BONeLLi, regis. a note on foreign direct investment (dfI) and industrial competi-tiveness in Brazil. rio de Janeiro: iPea, august 1998, 29 p.(Trabalhos para Discussão, n. 584).
______; FONSeCa, r. Ganhos de produtividade e de eficiência: resultados novos para a economia brasileira. Pesquisa e Planejamento Econômico, v. 28, n. 2, p.273-314, ago.1998.
BraGa, Hélson; rOSSi, José Wellington. Produtividade total dos fatores de produção na indústria brasileira: mensuração e decomposição de sua taxa de crescimento.
iPea, 1988. (Texto para Discussão, n. 12).
BraGa, Hélson; SaNTiaGO, Gilda; FerrO, L. C. a estrutura de proteção efetiva no Brasil: 1985, Pesquisa e Planejamento Econômico, v. 18, n. 3, dez. 1988. BraGa, Hélson; TyLer,William G. Trade policies in Brazil. in: SaLVaTOre,
Dominick (ed.). national trade policies. Handbook of comparative economic policies. Westport, Connecticut: Westwood Press, 1992. p. 337-360.
BUSSOLO, Maurizio; Lay, Jann; VaN Der MeNSBrUGGe, Dominique. struc-tural change and poverty reduction in Brazil: the effect of the doha Round. World Bank, Jan. 2005. Unpublished paper.
CarNeirO, Francisco G.; arBaCHe, Jorge S. the impacts of trade openness on employment, poverty and inequality: the case of Brazil. Universidade de Brasília, Sept. 2002. Unpublished paper.
CUNHa, alexandre; TeiXeira, arilton. The impacts of trade blocks and tax reforms on the Brazilian economy. Revista Brasileira de Economia, v. 58, n.3, p. 325-342, 2004.
De GreGOriO, José; Lee, J. Economic growth in latin america: source and prospects.
December 1999. Mimeo.
DeVaraJaN, Shantayanan; rOBiNSON, Sherman. The influence of comput-able general equilibrium models on policy. international Food Policy research institute. tMd discussion Paper n. 98,august 2002.
eDWarDS, Sebastian. Openness, productivity and growth: what do we really know?
International Economic Journal, n. 108 p.383–398, 1998.
Ferreira, Leo da rocha. taxa de câmbio social e a política cambial no Brasil. Uni-versidade do estado do rio de Janeiro (UerJ), January 2002, 56 p. (Working Paper)
Ferreira FiLHO, Joaquim; HOrriDGe, Mark. The Doha round, poverty and regional inequality in Brazil. Paper presented at the Eighth annual conference on global trade analysis. Lubeck, Germany, June 2005.
FUGazza, Mario; VaNzeTTi, David. a south-south survival strategy: the poten-tial for trade among developing countries. Paper presented at the Eighth annual conference on global trade analysis. Lubeck, Germany, June 2005.
GOMeS, Victor. fatos sobre a produtividade. rio de Janeiro, iPea, 2001. Unpublished working manuscript.
GUrGeL, angelo Costa. impactos da liberalização comercial de produtos do agronegócio na rodada de Doha. Revista Brasileira de Economia, v. 60, n. 2, p. 133-151, june 2006.
______. Trade agreements and their impact on the familiar agriculture in Brazil. Pa-per presented at the tenth annual conference on global trade analysis. Lafayette, indiana, USa, June 2007.
HarriSON, Glenn W.; rUTHerFOrD, Thomas F.; Tarr, David G. economic implications for Turkey of a customs union with the european Union. European Economic Review, 41(3-5), p. 861-870, apr. 1997a.
______. Trade policy options for Chile: a quantitative evaluation. World Bank Policy and Research Working Paper 1783, 1997c. available at http://www.worldbank. org/research/trade/archive.html.
______; GUrGeL, angelo. regional, multilateral and unilateral trade policies for growth and poverty reduction in Brazil. Published in Brazil as Políticas de Comércio regionais, Multilaterais e Unilaterais do MerCOSUL para o Cresci-mento econômico e a redução da Pobreza no Brasil. Pesquisa e Planejamento Econômico, v. 33, n. 1, p. 1-60, abr. 2003. also published as part of World Bank, Brazil – trade policies to improve efficiency, increase growth and reduce poverty. report n. 24285-Br. Washington: World Bank, 2004.
Hay, Donald. a liberalização comercial brasileira após 1990 e o desempenho das grandes empresas industriais. Pesquisa e Planejamento Econômico, v. 30, n. 2, out. 2001.
Herrera, Santiago. Notes of Brazil’s economic Performance. Unpublished note prepared for World Bank, Brazil: stability for growth and Poverty Reduction. report n. 25278-Br.Washington: World Bank, 2003.
KUMe, Honório; PiaNi, G.; SOUza, C.F. a política brasileira de importação durante o período 1987-98: descrição e avaliação. rio de Janeiro: iPea, 2000. Mimeografado.
KUMe, Honório. a política de importação no Plano Real e a estrutura de proteção efetiva.
iPea, maio 1996. (Texto Para Discussão, n. 423)
______; PaTríCiO, J. a. a reforma alfandegária proposta pela CPa: primeiros pas-sos a uma reformulação da política alfandegária. Revista Brasileira de comércio Exterior, n. 15, jan. 1988.
MaTHieSeN, Lars. Computation of economic equilibrium by a sequence of linear complementarity problems. Mathematical Programming study, n. 23, p. 144-162, 1985.
MOreira, Maurício Mesquita; NaJBerG, Sheila. abertura comercial: criando ou exportando empregos? rio de Janeiro: BNDeS, out. 1997 (Textos para Discussão, n. 59).
MOreira, Maurício Mesquita; COrrea, Paulo Guilherme. a first look at the impacts of trade liberalization on the Brazilian manufacturing industry. rio de Janeiro: BNDeS, august 1997. (Textos para Discussão, n. 49 - revisado). MOreira, Maurício Mesquita. Estrangeiros em uma economia aberta: impactos
re-centes sobre produtividade, concentração e comércio exterior. rio de Janeiro: BNDeS, mar. 1999. (Textos para Discussão n. 67).
Pereira, Lia Vals. Estudo sobre linhas estruturais da posição brasileira nos principais setores produtivos de interesse do Brasil, do âmbito do exercício de conformação da alca e no âmbito das negociações do Mercosul com a união Européia. Fundação Getulio Vargas, 2000. relatório não publicado.
raJaPaTiraNa, Sarath. Trade policies, macroeconomic adjustment, and manufac-tured exports: the Latin american experience. World Bank Policy Research Paper n. 1492, august 1995, 34 p.
reiDeL, James. The demand for LDC exports of manufactures: estimates from Hong Kong. Economic Journal, 98, p.138-148, March 1988.
rOSSi, José L.; Ferreira, P. C. Evolução da produtividade industrial brasileira e abertura comercial. iPea, jun. 1999 (Texto para Discussão, n. 651).
rUTHerFOrD, Thomas F. applied general equilibrium modeling with MPSGe as a GaMS subsystem: an overview of the modeling framework and Syntax.
computational Economics, 14 (1/2), p. 1-46, October 1999.
______; rUTSTröM, e. e.; Tarr, David. Morocco’s free trade agreement with the european Community. Economic Modelling, 14(2), p. 237-269, april 1997. SiLVa, Danielle Barbosa Lopes da. o impacto da abertura comercial sobre a
produtivi-dade da indústria brasileira. Master’s Thesis, Pontifícia Universidade Católica do rio de Janeiro, December 2000.
TyLer, William. effective incentives for domestic market sales and exports: a view of anti-export biases and commercial policy in Brazil, 1980-81. Journal of de-velopment Economics, v. 18, p. 219-242, 1985. also published in Portuguese in
Pesquisa e Planejamento Econômico.
______. Manufactured export expansion and industrialization in Brazil. Tübingen: J.C.B. Mohr, l976, 373 p.
______. strengthening the policy environment for export growth in Brazil. Versão Prelimi-nar, UerJ, out. 2003, published as Part iii of World Bank. Brazil: trade Policies to Improve Efficiency, Increase growth and Reduce Poverty. report n. 24285-Br Washington: World Bank, 2004.
WaLMSLey, Terrie L.; MCDOUGaLL, robert a. overview of regional input-output tables. GTaP5 documentation 11.a, 2001. available at: (http://www.gtap. agecon.purdue.edu/databases/v5/v5_doco.asp).
WOrLD BaNK. Export dynamics and productivity: analysis of Mexican manufacturing in the 1990s. report n. 19864-Me. Latin america and the Caribbean regional Office. Washington: World Bank, Nov. 1999.
WOrLD BaNK. Brazil: the new growth agenda. report n. 22950-Br. Latin america and the Caribbean regional Office. Washington: World Bank, Nov. 2001.
annEx
fIguRE 1 – REal EffEctIvE ExchangE R atE IndEx, Jan 1979-dEc 02 (dEcEMBER 1998 = 100; IncREasE = REal dEPREcIatIon)
Note: estimated on the basis of wholesale prices indices for Brazil and its 15 principal trading partners with weights assigned by the partners’ shares in Brazil’s total exports.