R E S E A R C H
Open Access
Homework self-regulation strategies: a
gender and educational-level invariance
analysis
Irene Cadime
1*, Joana Cruz
1,2, Carla Silva
1and Iolanda Ribeiro
3Abstract
This study investigates the measurement invariance as a function of gender and educational level of the Homework Behavior Questionnaire (Ktpc), an instrument developed to assess students’ homework self-regulation strategies. A sample of 1400 elementary and middle school students was used. Results of confirmatory factor analysis indicated a good fit of the theoretical model composed of three dimensions: planning, execution and evaluation of the homework completion. The results also provided evidence for the existence of metric invariance and partial scalar measurement invariance across boys and girls and across the elementary school and the middle school students. The reliability of the scores in the three dimensions was high. Girls obtained higher scores than boys in planning, execution and evaluation. Middle school students had lower scores in planning compared to the elementary school students. These findings are discussed, and their implications for practice are highlighted.
Keywords: Homework Behavior Questionnaire, Self-regulation, Measurement invariance, Gender differences,
Elementary and middle school students
Background
Homework includes the set of prescribed tasks to students by teachers to be held outside school hours. Tutoring, preparation for tests and examinations, super-vised study in school, correspondence study courses at home and extra-curricular activities such as sport, as well as study activities self-initiated by students, cannot be considered homework (Cooper, 2001). The positive
effects of homework completion on students’ academic
achievement across several subject matters have been demonstrated in a large number of studies (see, for example, the meta-analyses by Cooper, Robinson, & Patall, 2006, and Fan, Xu, Cai, He, & Fan, 2017).
Homework not only contributes to academic perform-ance, at a general or specific level (i.e. math/science), but has also been associated with the students’self-regulation abilities. The relationship between the two variables can be understood in the light of the demands that
students must deal with when doing their home-work. The accomplishment of homework includes a sequential set of three phases. The first comprises the prescription of the work done by the teacher and takes place in the classroom, the second takes place outside the classroom and consists of the execution of the prescribed tasks, and the last phase occurs upon return of the student to the classroom, after the work is done (Cooper, 1989, 2001; Coulter, 1979; Rademacher, 2000). In the second stage, students are responsible for doing the work pre-scribed by their teachers and managing time, spaces and environments, and even for seeking help whenever needed (Cooper, 2001; Corno, 2000; Trautwein & Koller, 2003). They should also accomplish the tasks in time, control the possible internal and external distractors, decide which aids they will use and check if all the prescribed tasks are complete (Epstein & Van Voorhis, 2001). Therefore, a successful homework completion demands self-regulation abilities, and some instruments that assess the self-regulatory components that are present during the execu-tion of homework have been developed.
* Correspondence:[email protected]
1Centro de Investigação em Estudos da Criança (CIEC), Universidade do
Minho, Braga, Portugal
Full list of author information is available at the end of the article
One of these instruments is the Homework Man-agement Scale (Xu, 2008; Yang & Xu, 2015), which is a self-report measure for high school students composed of 22 items distributed by five subscales: arranging environment, managing time, handling dis-traction, monitoring motivation and controlling emotion. Studies with American (Xu, 2008) and Chinese (Yang & Xu, 2015) samples of 11th graders demonstrated adequate reli-ability. In both samples, confirmatory factor analysis results provided empirical evidence for the five-factor structure. Al-though invariance of this structure was demonstrated across calibration and validation samples (Xu, 2008), no invariance studies were conducted considering variables that play a role on self-regulation, such as gender. Studies focusing on gen-der differences in self-regulated learning found that girls are more self-regulated than boys (Xu & Corno, 2006), spend more time doing homework (Rosário, Mourão, Núñez, Gon-zález-Pienda, & Valle, 2006), do a better behaviour regula-tion (Weis, Heikamp, & Trommsdorff, 2013) and take more initiative to manage their homework (Xu & Wu, 2013).
Another instrument that includes an assessment of the homework self-regulation components is the Self-Assessment Questionnaire: Homework (SAQ; Hong, Peng, & Rowell, 2009). The SAQ is composed of 34 items that measure homework utility value and intrinsic value (dimensions related with the task value), effort and persistence (dimensions related with the motivational outcome) and the planning and self-checking applied during the homework process (dimensions related with the metacognitive strategy use). Hong, Peng, and Rowell (2009) admin-istered the SAQ to groups of 7th and 11th graders and found grade-level differences in the scores of the six SAQ dimensions, with the second group obtaining significantly lower scores than the first.
They concluded, as a consequence, that “older
Chin-ese students perceived homework as less useful, enjoyed doing homework less, expended less effort, persisted less, and engaged in planning and
self-checking less than did younger students” (Hong
et al., 2009, p. 274). In the same study, no gender differences were found. Nonetheless, no evidence for the grade and gender measurement invariance of the SAQ was provided, which is essential to guaran-tee the validity of these findings.
The Homework Distraction Scale (HDS; Xu, 2015) assesses one specific aspect of self-regulation in homework completion: the (in)ability to suppress distractors and maintain the attention in the home-work task. The HDS is composed of six items that the students must rate using a Likert-type scale and that are organized into two dimensions: (a)
conven-tional distraction (e.g. Start conversations unrelated
to what I’m doing) and (b) tech-related distraction
(e.g. Stop math homework to play online games or
video games). Xu, Fan, and Du (2015) tested the two-factor structure and its measurement invariance across gender using a sample of 796 Chinese 8th graders. They found evidence for the existence of metric invariance between boys and girls. However, given that scalar invariance was not tested, no mean comparisons between both gender groups were performed.
As a summary, these instruments measure distinct self-regulation abilities during homework completion and have been developed to assess middle and high school students, probably mirroring the fact that most of the research on homework completion and its related variables is conducted at these stages (e.g. Iflazoglu & Hong, 2012; Lau, Kitsantas, & Miller, 2015; Lee, Lee, & Bong, 2014; Núñez et al., 2015; Regueiro, Suárez, Valle, Núñez, & Rosário, 2015; Valle et al., 2016; Xu, 2011; Xu & Wu, 2013; Yang & Xu, 2015). The development of scales that evaluate self-regulation of homework behaviours in younger children remains an important research issue. Moreover, all of the reviewed instruments are self-report measures and, as Xu (2008) indicates,
“there is a need to incorporate other measures of
homework behaviors over time (e.g., student’s
home-work behaviors as recorded and perceived by their
teachers and their parents) to complement students’
self-reports” (p. 320) in order to have a more
complete and reliable understanding of this issue. The Homework Behavior Questionnaire (Ktpc) was developed to assess self-regulation abilities in home-work completion but focus homehome-work as a
sequen-tial process that involves self-regulatory skills.
Homework models (Cooper, 2001; Corno, 2000; Coulter, 1979; Rademacher, 2000), as well as
Zim-merman’s (2000) cyclical model of self-regulated
learning, were used to guide the development of the Ktpc. The questionnaire is centred in the
home-work’s second phase, which corresponds to
assign-ment execution, which usually occurs at home or in community contexts (Cooper, 2001; Coulter, 1979; Rademacher, 2000). Therefore, the Ktpc was devel-oped in order to measure the processes, beliefs and behaviours that tend to occur during three steps:
homework planning, execution and evaluation.
Moreover, the questionnaire was developed to assess the behaviours of students from different educational
levels—elementary school (grades 1–4) and the first
cycle of middle school (grades 5–6)1—based on the
information provided by the students’ parents or
to test the fit of the theoretical model to the data and to investigate the reliability of the scores ob-tained in the Ktpc.
As was previously referred, research has found consistent differences between girls and boys in the self-regulation abil-ities. Therefore, it is crucial to check the measurement in-variance of any instrument that focuses on these abilities so that meaningful comparisons can be performed between male and female students. In the studies of the previous re-ferred instruments that measure homework self-regulation components (Hong et al., 2009; Xu, 2008; Xu, 2015; Yang & Xu, 2015), this was not examined. Similarly, given that re-search found that older students are less self-regulated dur-ing homework completion (Hong et al., 2009) and that Ktpc was developed to assess children who attend two different educational levels, measurement invariance across these levels must also be guaranteed. Therefore, the third goal of this study was to investigate the measure-ment invariance of the Ktpc as a function of gender and educational level. Only after guaranteeing meas-urement invariance, meaningful group comparisons using the Ktpc can be performed.
Hence, the research questions of this study were as follows: (a) Does a multidimensional structure composed of three factors—planning, execution and evaluation—fit the data obtained in the Ktpc? (b) Are the scores of the Ktpc reliable? and (c) Is the factor structure invariant be-tween boys and girls and bebe-tween students from elemen-tary and middle schools?
Methods
Participants and procedure
The sample was recruited by convenience, using a snowballing sampling technique for data collection. Formal authorizations from the board of the schools were collected prior to the questionnaire administration. The boards of seven public schools, located in the district of Porto (Portugal), were contacted and agreed to participate. These schools had a total of 1014 students from grades 1–4
and 611 students from grades 5–6. An informed consent
form was distributed to the parents of these students informing them of the objectives of the study and asking for their collaboration, along with the questionnaires. This procedure was performed with the collaboration of the Psychology Services of the schools in which the study was conducted. The questionnaires were answered at home by the parents. The questionnaires were anonymous and were delivered and returned using closed envelops. The response rate was 86.15%. Therefore, the information regarding the behaviour during homework of 1400 students from Portu-guese elementary (grades 1 to 4) and middle (grades 5 to 6) schools was collected. Table 1 displays the number of stu-dents in each grade and by gender. The stustu-dents were equally distributed by the six grades, and the number of
boys and girls was equivalent in all grade levels, χ2(5) =
9.046, p= .107. However, given that the number of grade levels in elementary school was higher, the number of stu-dents from the middle school grades was substantially
lower (n= 557) than the number of students from the
elementary school grades (n= 841).
Measures
The Ktpc is composed of three subscales: planning (six items), execution (seven items) and evaluation (eight items). The first subscale includes goal-setting/planning and is re-lated to self-management or structuring either one’s self-processes (i.e. behaviours, thoughts, emotions) or the social environment, before engaging in homework assignments. The second consists of behaviours that tend to emerge dur-ing homework execution, namely those related to self-reinforcement, persistence and seeking support. The third includes behaviours that tend to emerge after the assign-ments are finished, such as self-evaluation, self-correction, homework revision and seeking homework feedback.
Each item consists of a statement, and the parents or tu-tors must rate the frequency of specific children’s home-work behaviours, using a 5-point Likert scale response format (0 = never, 1 = rarely, 2 = sometimes, 3 = often, 4 = always). The items are presented in the Appendix.
Statistical analyses
Analyses were conducted with Mplus, version 7 (Muthén & Muthén, 2012). Because the distribution of the variables was non-normal, the maximum likelihood estimation with robust standard errors (MLR) was used. Confirmatory fac-tor analysis (CFA) was used to test the fit of the three-factor model in each of the four groups: male students, fe-male students, elementary school students and middle
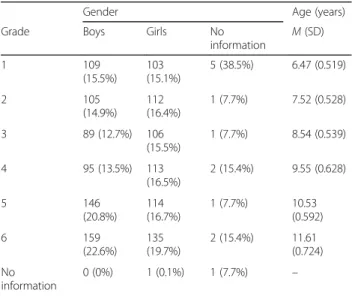
Table 1Distribution of students according to grade and gender
Gender Age (years)
Grade Boys Girls No
information
M(SD)
1 109
(15.5%) 103(15.1%) 5 (38.5%) 6.47 (0.519)
2 105
(14.9%) 112 (16.4%)
1 (7.7%) 7.52 (0.528)
3 89 (12.7%) 106
(15.5%) 1 (7.7%) 8.54 (0.539)
4 95 (13.5%) 113
(16.5%)
2 (15.4%) 9.55 (0.628)
5 146
(20.8%) 114(16.7%) 1 (7.7%) 10.53(0.592)
6 159
(22.6%) 135 (19.7%)
2 (15.4%) 11.61 (0.724) No
information 0 (0%) 1 (0.1%) 1 (7.7%) –
school students. To assess the global fit of the tested models, the following criteria were used: the chi-square (χ2)
values, the ratio between the chi-square and the degrees of freedom (χ2/df), the comparative fit index (CFI), the root
mean square error of approximation (RMSEA) and the standardized root mean square residual (SRMR). Model fit was considered acceptable whenχ2/df was lower than 3.00,
CFI values were higher than .90, RMSEA lower than .08 and SRMR lower than .10 (Schermelleh-Engel, Moosbrug-ger, & Müller, 2003). Composite reliability was calculated for each factor and values higher than .70 were considered adequate (George & Mallery, 2002; Hair, Black, Babin, & Anderson, 2009).
After fitting the model separately, in a second step, multi-group CFA was performed to test the invariance of the structure across genders and educational levels, following the guidelines indicated by van de Schoot, Lugtig, and Hox (2012) and Byrne (2012). First, a configural model (model 0), where loadings and intercepts were freely estimated, was tested. In model 1, metric invariance was tested, where the factor loadings were constrained but the intercepts were freely estimated. In model 2, scalar invariance was tested, where both loadings and intercepts were constrained to be equal across both samples. Evidence for the invariance of the model across both samples is achieved when the con-straint of parameters performed in testing the subsequent models does not worsen the fit indices. To perform this comparison, the Satorra–Bentler scaled chi-square differ-ence test was calculated (ΔSB−χ
2
). The comparison index Bayesian information criteria (BIC) was also used: the model with the lowest value was considered to be the one that best represents the data. Moreover, two additional cri-teria were considered, as recommended by Cheung and Rensvold (2002) and Chen (2007): (a) the difference in CFI (ΔCFI) that should be equal or lower than .01 and (2) the
difference in RMSEA (ΔRMSEA) that should be equal or
lower than .015. When full scalar invariance was not achieved, partial invariance was established by estimating freely the parameters identified after examining the La-grange multiplier tests. After establishing the invariance of the factor structure, differences in the latent means between the gender groups and the educational-level groups were calculated.
Results
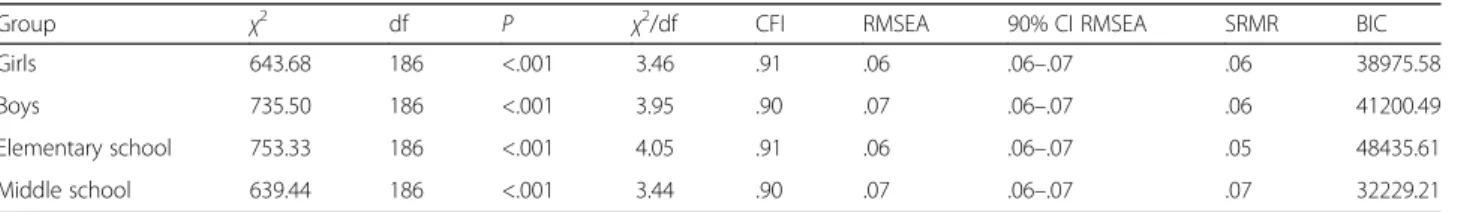
Table 2 presents the model fit for each gender and educational-level group. The three-factor model had an acceptable fit in all gender and educational-level groups, as indicated by the CFI, RMSEA and SRMR values, al-though the χ2/df slightly exceeded the reference values.
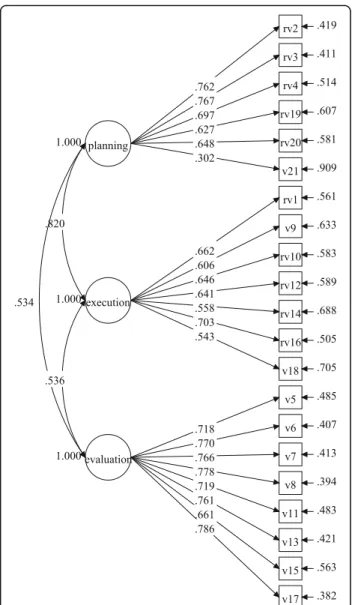
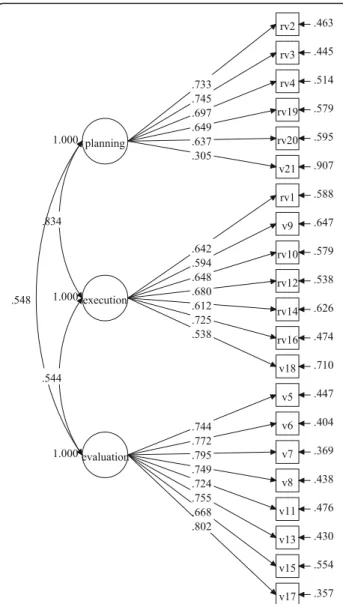
Figures 1 and 2 show the factor loadings for the items in each gender group, and Figs. 3 and 4 display the factor loadings in each educational level. As can be seen in Figs. 1, 2, 3 and 4, all factor loadings were higher than .30.
Reliability
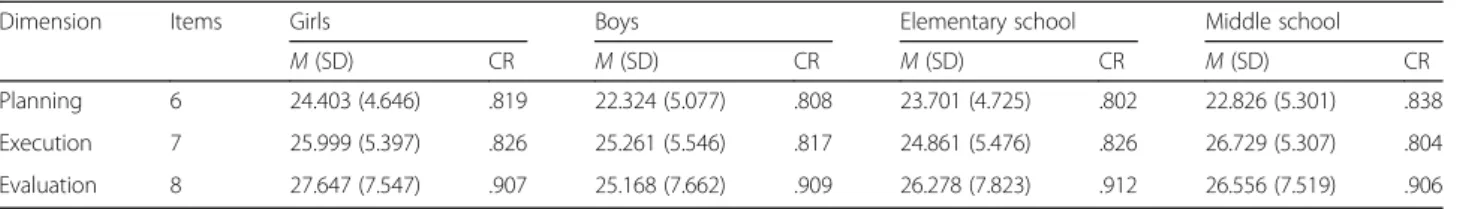
Table 3 presents descriptive statistics and the reliability test-ing results as a function of gender and educational levels. Composite reliability values were higher than .80 for all subscales in all four groups and were particularly high for the evaluation subscale.
Gender invariance
Table 4 shows the results of the invariance testing across gender and educational levels. Regarding the gender invari-ance testing, the results for the configural model (model 0) indicated an acceptable fit, although theχ2/df was out of the
cut-off value of 3.00. The metric invariance model (model 1) fitted equally well, given that the ΔSB−χ
2
was non-significant, and the CFI and RMSEA differences did not ex-ceed the reference values. The chi-square test of differences indicated that the scalar invariance model testing for boys and girls (model 2) fitted worse than model 1. Although the
ΔRMSEA was lower than .015, theΔCFI exceeded .01. The modification indices flagged the intercept of item 14, sug-gesting that it was not invariant. As a result, another model (model 3) was run to test partial scalar invariance. In this model, the identified intercept was unconstrained. Although theΔSB−χ
2
was significant, theΔCFI andΔRMSEA were lower than the reference values (see Table 4). Moreover, model 3 had the lowest BIC of all models. Taken together, these results indicate that model 3 did not fit worse than model 1, and provide evidence for the existence of partial strong factorial invariance across boys and girls. The com-parison of the latent means indicated that girls obtained higher scores than boys in all three dimensions: planning (ΔM = .45, p< .001), execution (ΔM = .18, p< .01) and
Table 2Model fit for the three-factor model by gender and educational level
Group χ2 df P χ2/df CFI RMSEA 90% CI RMSEA SRMR BIC
Girls 643.68 186 <.001 3.46 .91 .06 .06–.07 .06 38975.58
Boys 735.50 186 <.001 3.95 .90 .07 .06–.07 .06 41200.49
Elementary school 753.33 186 <.001 4.05 .91 .06 .06–.07 .05 48435.61
Middle school 639.44 186 <.001 3.44 .90 .07 .06–.07 .07 32229.21
evaluation (ΔM = .34,p< .001). The results were similar for the execution dimension if item 14 was excluded in the comparison of latent means (ΔM = .20,p< .01).
Educational-level invariance
Regarding the educational-level invariance testing, the re-sults for the configural model (model 0) indicated an ac-ceptable fit, with all indices (exceptingχ2/df) being within
the reference values. The chi-square test of differences indi-cated that the metric invariance model (model 1) fitted
worse than the configural model. However, the ΔCFI and
ΔRMSEA tests did not exceed the reference values and
model 1 had a lower BIC than model 0, supporting the in-variance of the factor loadings across students from both educational levels. The results for model 2 that tested scalar invariance indicated a poorer fit compared to the previous model: the chi-square test of differences was significant, the BIC value was higher than the one obtained for model 1
and the ΔCFI was higher than .01. The inspection of the modification indices led us to identify four intercepts (inter-cepts of items 12, 14, 16 and 18) that could improve the fit of the model if released, suggesting that these were not in-variant. Consequently, a fourth model was run to test partial scalar invariance, where loadings and intercepts were con-strained, excepting the four intercepts that were identified as non-invariant. Releasing these intercepts led to an improve-ment in the model fit (see Table 4). Therefore, partial meas-urement invariance across the elementary school and the middle school sample was established, and differences in the latent means between both groups were subsequently com-puted. When compared with the elementary school stu-dents, middle school students had lower results in planning (ΔM =−.17,p< .01). However, no differences between
elem-entary and middle school students were found in execution (ΔM = .01,p= .92) and evaluation (ΔM = .04,p= .53). If the
four items that had non-invariant intercepts were excluded (all from the execution dimension) in the comparison of la-tent means, the results were similar, as no differences be-tween elementary and middle school students were found in homework execution strategies (ΔM =−.01,p= .93).
Discussion
The Ktpc is an instrument constructed to assess students’ homework behaviour, as reported by parents or other tu-tors. Homework behaviour is related with what students do when dealing with homework, how they approach their work and how they manage their personal resources and homework settings (Valle et al., 2015). The first goal of this study was to test the fit of a model composed of three fac-tors—planning, execution and evaluation—to the data ob-tained with the Ktpc in four groups: boys, girls, students from elementary school and students from middle school.
The results from confirmatory factor analysis offer support to the validity of the instrument, with an acceptable fit of the proposed theoretical model to the data in all four groups. The three dimensions of the model are theoretically defined as essential self-regulated processes in homework execution: homework planning, homework execution and homework evaluation. In essence, the Ktpc provides information about how frequently an individual uses self-regulated strategies to complete assignments. Thus, students who score high on this scale will often regulate their behaviours, thoughts and emotions to finish homework and to associate the execution of the assignments to school outcomes.
The second goal was to explore the reliability of the results obtained in the Ktpc. Composite reliability results indicate that the scores in the Ktpc are highly reliable.
The third goal of this study was to investigate the meas-urement invariance of the three-dimensional structure
Fig. 3Factor loadings for the three-factor model in the elementary school group
between boys and girls and between students from elementary and middle schools. The results of this study dicated that the three-dimensional structure is partially in-variant between boys and girls and between students from elementary and middle schools, thus allowing meaningful comparisons across groups. Gender differences were found in all three self-regulation dimensions of the homework, and these differences were favourable to girls. These find-ings are consistent with the bulk of research which indi-cates that not only are girls usually more self-regulated but they also invest more time and effort and apply better self-regulation strategies in completing homework (Rosário et al., 2006; Weis et al., 2013; Xu & Corno, 2006; Xu & Wu, 2013). However, these are contrary to the findings of Hong et al. (2009) which found no gender differences in home-work planning and self-checking as measured by the SAQ. The differences in the cultural settings (Portugal versus China) and the differences in the educational levels assessed can explain the divergence between the results of the present study and the ones obtained in the study by Hong et al. (2009).
Differences were also found between elementary and mid-dle school students, but only in homework planning. Elem-entary school students had higher results in planning when compared with middle school students. This result may re-flect the progressive decreasing in the involvement in the studying activities and in the positive attitudes towards homework as the students advance in the educational sys-tem (Rosário et al., 2005). Hong et al. (2009) had also found that students from the 11th grade planned homework less than the 7th grade students. Taken together, these and our results can indicate that homework planning decreases as the school grade increases and that this decrease starts at early stages, but this hypothesis must be investigated using a longitudinal design in the future.
Although the differences in the groups’latent means were similar, whether the non-invariant items were considered or excluded, future gender and educational-level compari-sons of the scores obtained in the Ktpc should be inter-preted cautiously, given that only partial measurement invariance was obtained.
All the items with non-invariant intercepts belonged to the execution subscale and had in common the fact that they are all related with the necessary self-control and ability to manage homework execution without the
help of others, such as an adult (see the Appendix). Although research has shown that students tend to become gradually more autonomous in homework completion as they grow older, it has also indicated that students with higher academic achievement search more the adult super-vision than students with lower academic achievement (for a review, see Corno & Mandinach, 2004). Additionally, the benefits of family help during homework completion are unclear. The results of some studies (e.g. Xu, 2007; Xu, Du, & Fan, 2016) indicated that family help was positively asso-ciated with the development of homework management abilities, but other studies (e.g. Silinskas, Kiuru, Aunola, Lerkkanen, & Nurmi, 2015) showed that excessive help, especially when children are perceived by their mothers as not very autonomous, led to poorer academic performance. Consequently, future studies should explore the pertinence of maintaining these items in the Ktpc.
Conclusions
Although literature on self-regulation and homework is growing, fewer studies focus specifically on the metric prop-erties of questionnaires of homework self-regulation behav-iours, and as far as we know, no instruments have been developed to assess these behaviours in children from the initial school grades. The Ktpc is a step taken towards that goal and presents itself as a promising and reliable measur-ing instrument focused on the process of homework com-pletion. This scale may also help teachers to develop interventions to foster self-regulated learning through homework improvement. Future research should focus on gathering other types of validity evidence for the Ktpc, such as the one based on the relationship to other variables. It would be particularly important to study the relationship of the scores in homework planning, execution and self-evaluation with the academic achievement across different school subjects and specific subject matters.
Endnotes 1
In Portugal, elementary school, also known as the first cycle of basic education, comprises grades 1 to 4 (children aged between 6 and 10 years old). Middle school comprises the second cycle of basic education (grades 5 to 6; children aged between 10 and 12 years old) and the third cycle of basic education (grades 7 to 9; children aged between 12 and 15 years old).
Table 3Descriptive statistics and reliability coefficients
Dimension Items Girls Boys Elementary school Middle school
M(SD) CR M(SD) CR M(SD) CR M(SD) CR
Planning 6 24.403 (4.646) .819 22.324 (5.077) .808 23.701 (4.725) .802 22.826 (5.301) .838
Execution 7 25.999 (5.397) .826 25.261 (5.546) .817 24.861 (5.476) .826 26.729 (5.307) .804
Evaluation 8 27.647 (7.547) .907 25.168 (7.662) .909 26.278 (7.823) .912 26.556 (7.519) .906
Table 4Measurement invariance across genders (N= 1387) and educational levels (N= 1398)
Model χ2 df p χ2/df CFI RMSEA 90% CI RMSEA SRMR BIC ΔSB−χ2(df) ΔCFI ΔRMSEA
Gender
Model 0: configural 1378.467 372 <.001 3.706 .903 .062 .059–.066 .059 80267.581 – – –
Model 1: metric 1408.690 393 <.001 3.584 .902 .061 .058–.065 .063 80141.507 24.302 (21) .001 .001
Model 2: scalar 1545.190 414 <.001 3.732 .891 .063 .059–.066 .077 80138.773 147.374 (21)*** .011 .002
Model 3a: partial scalar 1528.940 413 <.001 3.702 .892 .062 .059–.066 .077 80127.547 128.712 (20)*** .010 .001
Educational level
Model 0: configural 1392.982 372 <.001 3.745 .904 .063 .059–.066 .059 80759.100
Model 1: metric 1451.976 393 <.001 3.695 .901 .062 .059–.066 .068 80666.025 56.208 (21)*** .003 .001
Model 2: scalar 1749.108 414 <.001 4.225 .875 .068 .065–.071 .080 80851.854 339.662 (21)*** .026 .006
Model 3b: partial scalar 1537.974 410 <.001 3.751 .894 .063 .059–.066 .071 80632.473 90.717 (17)*** .007 .001
CFIcomparative fit index,RMSEAroot mean square error of approximation,SRMRstandardized root mean square residual,BICBayesian information criterion,ΔSB−χ2Satorra–Bentler scaled chi-square difference test
***p < .001
aEstimating freely the intercept of item 14 in both samples
bEstimating freely the intercepts of items 12, 14, 16 and 18 in both samples
Psicologia:
Reflexão
e
Crítica
(2017) 30:8
Page
8
of
Appendix
Acknowledgements
This study was partially conducted at the Psychology Research Centre (UID/PSI/ 01662/2013), University of Minho, and supported by the Portuguese Foundation for Science and Technology and the Portuguese Ministry of Science, Technology and Higher Education, through national funds, and co-financed by FEDER, through COMPETE2020, under the PT2020 Partnership Agreement (POCI-01-0145-FEDER-007653). The first author is also supported by grant SFRH/BPD/102549/ 2014 from the Portuguese Foundation for Science and Technology.
Authors’contributions
IC made substantial contributions to the conception and design, statistical data analysis and interpretation and discussion of the results. JC made substantial contributions to the conception and design and the interpretation and discussion of the results. CS made substantial contributions to the conception and design and the acquisition of the data. IR made substantial contributions to the conception and design, acquisition of the data, and interpretation and discussion of the results. All four authors were involved in drafting the manuscript and revising it critically for important intellectual content, gave final approval of the version to be published and agreed to be accountable for all aspects of the work in ensuring that questions related to the accuracy or integrity of any part of the work are appropriately investigated and resolved.
Competing interests
The authors declare that they have no competing interests.
Ethics approval and consent to participate
An informed consent form was distributed to the parents of these students informing them of the objectives of the study and asking for their collaboration.
Publisher’s Note
Springer Nature remains neutral with regard to jurisdictional claims in published maps and institutional affiliations.
Author details
1Centro de Investigação em Estudos da Criança (CIEC), Universidade do
Minho, Braga, Portugal.2Centro de Investigação em Psicologia para o
Desenvolvimento (CIPD), Universidade Lusíada - Norte, Porto, Portugal.
3Escola de Psicologia, Universidade do Minho, Braga, Portugal.
Received: 20 December 2016 Accepted: 20 March 2017
References
Byrne, BM. (2012).Structural equation modeling with Mplus: Basic concepts, applications and programming. New York: Routledge Academic. Table 5Homework Behavior Questionnaire (Ktpc)
Item (in Portuguese) English translation Dimension
1. Quando sente dificuldades a realizar o trabalho de casa, desiste de os fazer.*
When he/she feels difficulties in performing homework, he/she gives up the task.*
Execution
2. Demora muito tempo a iniciar a realização do trabalho de casa.*
It takes him/her a long time to initiate homework.*
Planning
3. Cria desculpas para não fazer
o trabalho de casa.*
He/she makes up excuses to avoid homework.*
Planning
4. Tem de ser lembrado/a para fazer o trabalho de casa.*
He/she only performs homework if someone reminds him/her.*
Planning
5. Quando acaba de fazer os trabalhos de casa avalia o seu desempenho, ou seja, aquilo que fez.
When he/she finishes homework, he/she evaluates what he/she did.
Evaluation
6. Quando acaba de fazer os trabalhos de casa avalia a eficácia do seu planeamento, ou seja, se planeou bem o que tinha de fazer.
When he/she finishes homework, he/she evaluates if his/her work was adequately planned.
Evaluation
7. Quando acaba de fazer os trabalhos de casa avalia a sua qualidade.
When he/she finishes homework, he/she evaluates the quality of the final result.
Evaluation
8. Quando acaba de fazer os trabalhos de casa relê as respostas.
When he/she finishes homework, he/she reads his/her answers again.
Evaluation
9. Parece confiar nas suas capacidades para resolver os trabalhos de casa.
He/she trusts his/her abilities to perform homework.
Execution
10. Costuma ficar frustrado/a e angustiado/a com os trabalhos de casa.*
He/she usually gets angry and frustrated with the homework. *
Execution
11. Quando acaba de fazer os trabalhos de casa revê o que fez e verifica se completou todas as tarefas.
When he/she finishes homework, he/she re-examines what he/she did and check if all tasks were completed.
Evaluation
12. Precisa de ajuda para fazer o trabalho de casa.*
He/she always needs help to perform homework.*
Execution
13. Quando acaba de fazer os trabalhos de casa revê a apresentação das respostas no caderno.
When he/she finishes homework, he/she re-examines the answers presentation in his/her workbook.
Evaluation
14. À mínima dificuldade sentida durante a realização do trabalho de casa pede logo ajuda.*
He/she always asks immediately for help when he/she feels even a little difficulty in homework.*
Execution
15. Quando acaba de fazer os trabalhos de casa faz uma previsão das respostas correctas.
When he/she finishes homework, he/she tries to guess how many correct answers he/she wrote.
Evaluation
16. Pede sempre ajuda quando faz o trabalho de casa, para acabar mais depressa.*
He/she always asks for help when doing homework, so that he/she can finish as soon as possible.*
Execution
17. Quando acaba de fazer os trabalhos de casa revê a forma como o trabalho de casa está organizado.
When he/she finishes homework, he/she checks if the information is well organized.
Evaluation
Table 5Homework Behavior Questionnaire (Ktpc)(Continued)
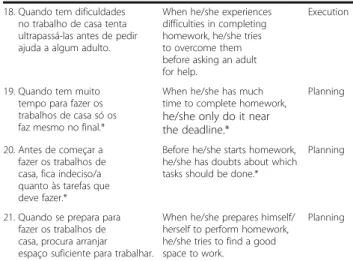
18. Quando tem dificuldades no trabalho de casa tenta ultrapassá-las antes de pedir ajuda a algum adulto.
When he/she experiences difficulties in completing homework, he/she tries to overcome them before asking an adult for help.
Execution
19. Quando tem muito tempo para fazer os trabalhos de casa só os faz mesmo no final.*
When he/she has much time to complete homework,
he/she only do it near the deadline.*
Planning
20. Antes de começar a fazer os trabalhos de casa, fica indeciso/a quanto às tarefas que deve fazer.*
Before he/she starts homework, he/she has doubts about which tasks should be done.*
Planning
21. Quando se prepara para fazer os trabalhos de casa, procura arranjar espaço suficiente para trabalhar.
When he/she prepares himself/ herself to perform homework, he/she tries to find a good space to work.
Planning
Chen, FF. (2007). Sensitivity of goodness of fit indexes to lack of measurement invariance.Structural Equation Modeling: A Multidisciplinary Journal, 14, 464–
504. doi:10.1080/10705510701301834.
Cheung, GW, & Rensvold, RB. (2002). Evaluating goodness-of-fit indexes for testing measurement invariance.Structural Equation Modeling: A Multidisciplinary Journal, 9, 233–255. doi:10.1207/S15328007SEM0902_5. Cooper, H. (2001).The battle over homework: Common ground for administrators,
teachers, and parents(2nd ed.). Thousand Oaks: Sage Publications. Cooper, H. (1989).Homework. White Plains: Longman.
Cooper, H, Robinson, J, & Patall, E. (2006). Does homework improve academic achievement? A synthesis of research, 1987–2003.Review of Educational Research, 76(1), 1–62.
Corno, L. (2000). Looking at homework differently.The Elementary School Journal, 100(5), 529–548.
Corno, L, & Mandinach, EB. (2004). What we have learned about student engagement in the past twenty years. In D McInerney & S Van Etten (Eds.),Big Theories Revisited(Vol. 4, pp. 297–326). Greenwich: Information Age Publishing. Coulter, F. (1979). Homework: A neglected area of research.British Educational
Research Journal, 5, 21–33.
Epstein, JL, & Van Voorhis, FL. (2001). More than minutes: Teachers’roles in designing homework.Educational Psychologist, 36(3), 181–193.
Fan, H, Xu, J, Cai, Z, He, J, & Fan, X. (2017). Homework and students’achievement in math and science: A 30-year meta-analysis, 1986–2015.Educational Research Review, 20, 35–54.
George, D, & Mallery, P. (2002).SPSS for Windows step by step: A simple guide and reference(4th ed.). Boston: Allyn & Bacon.
Hair, JF, Black, WC, Babin, BJ, & Anderson, RE. (2009).Multivariate data analysis
(7th ed.). Upper Saddle River: Prentice Hall.
Hong, E, Peng, Y, & Rowell, LL. (2009). Homework self-regulation: Grade, gender, and achievement-level differences.Learning and Individual Differences, 19(2), 269–276. doi:10.1016/j.lindif.2008.11.009.
Iflazoglu, A, & Hong, E. (2012). Relationships of homework motivation and preferences to homework achievement and attitudes in Turkish students.
Journal of Research in Childhood Education, 26, 57–72. doi:10.1080/02568543. 2011.632066.
Lau, C, Kitsantas, A, & Miller, A. (2015). Using microanalysis to examine how elementary students self-regulate in math: A case study.Procedia - Social and Behavioral Sciences, 174, 2226–2233. doi:10.1016/j.sbspro.2015.01.879. Lee, W, Lee, M, & Bong, M. (2014). Testing interest and self-efficacy as predictors of
academic self-regulation and achievement.Contemporary Educational Psychology, 39, 86–99. doi:10.1016/j.cedpsych.2014.02.002.
Muthén, LK, & Muthén, BO. (2012).Mplus user’s guide(7th ed.). Los Angeles: Muthén & Muthén.
Núñez, J, Suárez, N, Cerezo, R, González-Pienda, J, Rosário, P, Mourão, R, & Valle, A. (2015). Homework and academic achievement across Spanish compulsory education.
Educational Psychology, 35(6), 726–746. doi:10.1080/01443410.2013.817537. Rademacher, JA. (2000). Involving students in assignment evaluation.Intervention
in School and Clinic, 35(3), 151–156.
Regueiro, B, Suárez, N, Valle, A, Núñez, JC, & Rosário, P. (2015). La motivación e implicación en los deberes escolares a lo largo de la escolaridad obligatoria.
Revista de Psicodidáctica, 20(1), 47–63. doi:10.1387/RevPsicodidact.12641. Rosário, P, Mourão, R, Núñez, J, González-Pienda, J, & Valle, A. (2006). SRL and EFL
homework: Gender and grade effects.Academic Exchange Quarterly, 10(4), 135–140. Rosário, P, Mourão, R, Soares, S, Chaleta, E, Gracio, L, Núñez, J, & González-Pineda, J. (2005). Trabalhos de casa, tarefas escolares, auto-regulação e envolvimento parental.Psicologia em Estudo, 10(3), 343–351.
Schermelleh-Engel, K, Moosbrugger, H, & Müller, H. (2003). Evaluating the fit of structural equation models: Tests of significance and descriptive goodness-of-fit measures.Methods of Psychological Research Online, 8(2), 23–74. Silinskas, G, Kiuru, N, Aunola, K, Lerkkanen, M-K, & Nurmi, J-E. (2015). The
developmental dynamics of children’s academic performance and mothers’
homework-related affect and practices.Developmental Psychology, 51(4), 419–
433. http://doi.org/10.1037/a0038908.
Trautwein, U, & Koller, O. (2003). The relationship between homework and
achievement—still much of a mystery.Educational Psychology Review, 15(2), 115–145. Valle, A, Pan, I, Regueiro, B, Suárez, N, Tuero, E, & Nunes, AR. (2015). Predicting
approach to homework in Primary school students.Psicothema, 27(4), 334–340. Valle, A, Regueiro, B, Núñez, J, Rodriguez, S, Piñeiro, I, & Rosário, P. (2016).
Academic goals, student homework engagement, and academic achievement in elementary school.Frontiers in Psychology, 7, 463. doi:10. 3389/fpsyg.2016.00463.
van de Schoot, R, Lugtig, P, & Hox, J. (2012). A checklist for testing measurement invariance.European Journal of Developmental Psychology, 9(4), 486–492. Weis, M, Heikamp, T, & Trommsdorff, G. (2013). Gender differences in school
achievement: The role of self-regulation.Frontiers in Psychology, 4, 442. doi:10. 3389/fpsyg.2013.00442.
Xu, J, Fan, X, & Du, J. (2015). Homework management scale: Confirming the factor structure with middle school students in China.Psychology in the Schools, 52(4), 419–429.
Xu, J. (2007). Middle-school homework management: More than just gender and family involvement.Educational Psychology, 27, 173–189.
Xu, J. (2008). Validation of scores on the homework management scale for middle school students.The Elementary School Journal, 109(1), 82–95. Xu, J. (2011). Homework purpose scale for middle school students: A validation
study.Middle Grades Research Journal, 6(1), 1–13.
Xu, J. (2015). Investigating factors that influence conventional distraction and tech-related distraction in math homework.Computers & Education, 81, 304–314. Xu, J, & Corno, L. (2006). Gender, family help, and homework management
reported by rural middle school students.Journal of Research in Rural Education, 21(2), 1–13.
Xu, J, Du, J, & Fan, X. (2016). Self-regulation of mathematics homework behavior: An empirical investigation.The Journal of Educational Research. http://doi.org/ 10.1080/00220671.2015.1125837.
Xu, J, & Wu, H. (2013). Self-regulation of homework behaviour: Homework management at the secondary school level.The Journal of Educational Research, 106, 1–13.
Yang, F, & Xu, J. (2015). Examining the psychometric properties of the Homework Management Scale for high school students in China.Journal of
Psychoeducational Assessment, 33(3), 268–277.
Zimmerman, BJ. (2000). Attaining self-regulation: A social cognitive perspective. In M Boekaerts, PR Pintrich, & M Zeidner (Eds.),Handbook of self-regulation
(pp. 13–39). San Diego: Academic.
Submit your manuscript to a
journal and benefi t from:
7 Convenient online submission
7Rigorous peer review
7 Immediate publication on acceptance
7Open access: articles freely available online
7 High visibility within the fi eld
7Retaining the copyright to your article