Article
Printed in Brazil - ©2017 Sociedade Brasileira de Química0103 - 5053 $6.00+0.00*e-mail: [email protected]
#Current address: Instituto de Pesquisas Energéticas e Nucleares, Cidade Universitária, Butantã, 05508-900, São Paulo-SP, Brazil.
§A. Amorim and L.S. Parreiracontributed equally to this work.
Electrooxidation of Mixed Ethanol and Methanol Solutions on PtSn/C
Electrocatalysts Prepared by the Polymeric Precursor Method
Aline Amorim,§ Luanna S. Parreira,§ Júlio César M. Silva# and Mauro C. dos Santos*
Laboratório de Eletroquímica e Materiais Nanoestruturados, Centro de Ciências Naturais e Humanas, Universidade Federal do ABC,
Rua Santa Adélia 166, 09210-170 Santo André-SP, Brazil
Different mass ratio proportions of PtSn (m/m) electrocatalysts with 20% metal loading on a carbon support were prepared for use in ethanol:methanol solutions oxidation reactions. PtSn/C (3:1) (91% alloy degree, lattice parameter of 0.399 nm and mean crystallite size 4.8 nm) presented the best activity for oxidation of mixed solutions. The highest normalized current (ethanol:methanol 80:20) was 4.2 mA mgPt-1 (measured after 1800 seconds at 0.5 V). Therefore,
the PtSn/C (3:1) electrocatalyst with an atomic ratio of 65:35 enhanced both the electronic effect and bifunctional mechanism in (ethanol:methanol 80:20), which resulted in the formation of CO2
at low potentials, as well as the highest amount of by-products than ethanol and methanol.
Keywords: electrooxidation, PtSn/C, electrocatalysts, FTIR-ATR in situ, ethanol:methanol solutions
Introduction
The evolution of technology makes the search for new energy sources necessary, preferably using renewable alternative fuels.1,2 The use of PEMFCs (proton exchange membrane fuel cells) that turn chemical energy into electrical energy has been widely studied as an alternative due to its high efficiency and low greenhouse gases emission.3-5
However, PEMFCs have a high cost due to the use of a Pt electrocatalyst and difficulties related to the transport and storage of hydrogen.6-9 Therefore, other fuel options, such as methanol and ethanol,10-15 have been studied because they are liquids and have a relatively high energy density.16
For the methanol oxidation reaction, formaldehyde, formic acid, CO and CO2 are produced, and methanol is the least reactive among these molecules in production of CO2.17 Therefore, the rate-determining step in methanol oxidation to CO2 is associated with the conversion of methanol to formaldehyde (i.e., oxidation of the first two electrons). In addition, the slow kinetics of methanol as well as its crossover and toxicity are problematic.18
Ethanol can be obtained from biomass and has a higher energy density (8.0 kW h kg-1) compared to that of methanol (6.1 kW h kg-1),19,20 but the oxidation of ethanol may involve a complex reaction pathway, and may be produced CO, acetaldehyde, acetic acid, CO2 as well as 2-carbon intermediates.21,22
Therefore, a mixture of ethanol and methanol can provide new reaction pathways, which may favor the formation of different intermediates and contribute to more effective electron transfer than that during oxidation in pure solutions. These pathways may improve the electrocatalytic activity. Therefore, investigation of the oxidation reactions of different ratios of these mixed solutions is important for determining the ideal ratio of each alcohol for future use in direct alcohol fuel cells.
Electrooxidation of Mixed Ethanol and Methanol Solutions on PtSn/C Electrocatalysts J. Braz. Chem. Soc. 1092
Thus, Wongyao et al.23 suggested that different proportions of PtSn/C can be used as electrocatalysts because an anode composed of this material will selectively adsorb ethanol.
Taking into account previous studies,14,24,25 PtSn/C (3:1) with an alloy degree of approximately 92% was one of the best materials reported for ethanol oxidation. Additionally, to optimize the DAFC performance using mixed alcohols (i.e., ethanol and methanol) the electrocatalyst used for the anode must selectively adsorb an alcohol, especially ethanol (e.g., PtSn/C (3:1)).
In this context, the goal of this study was to investigate the oxidation of mixed ethanol and ethanol solutions with various ratios using PtSn/C electrocatalysts with mass ratios of 3:1, 1:1 and 1:3 aiming to maximize the ethanol adsorption. Additionally, the current densities and formed by-products were maximized at low potentials compared to those of ethanol and methanol solutions.
Experimental
Preparation of the electrocatalysts
The PtSn electrocatalysts were prepared using the polymeric precursor method according to a previously reported protocol.14,24 Citric acid (CA) was dissolved in ethylene glycol (EG) at a 1:4 molar ratio at 60 °C. Different amounts of H2PtCl6·7 H2O and SnCl2·H2O were added to obtain 3:1, 1:1 and 1:3 mass ratios. The metal:CA:EG molar ratio of 1:50:200 was maintained. The catalysts were supported in an appropriate amount of Vulcan XC-72 (Cabot Corporation®) that was added to the resin (20% metal mass load on carbon). Then, the mixtures were homogenized in an ultrasonic bath for an hour and thermally treated at 400 °C for 2 hours under a N2 atmosphere.
Physical characterization
Energy dispersive spectroscopy (EDS) technique using a scanning electron microscopy (FESEM JMS-6701F JEOL) operating at 20 kV was used in order to measure the chemical composition of PtSn/C electrocatalysts. X-ray diffraction (XRD) analyses were performed using a Bruker diffractometer with a CuKα radiation source that was operated in continuous scan mode (2° min−1) from 20 to 80° (2θ degrees) to determine the crystalline phases and estimate the mean crystallite sizes. Morphological measurements were obtained using a transmission electron microscopy (TEM) technique on a FEI Tecnai G2 20 TEM instrument operating at 200 kV. The average particle size was estimated using the Image J software package, and more than 200 different particles were analyzed.
Electrochemical measurements
The electrochemical characterization was performed using cyclic voltammetry (v = 0.05 V s-1), and the activity of the materials was evaluated by cyclic voltammetry (v = 0.01 V s-1) and chronoamperometry (0.5 V for 1800 s). All of the electrochemical measurements were performed at room temperature using an Autolab 302N potentiostat in a H2SO4 (0.5 mol L−1) solution in the presence and absence of ethanol and methanol mixtures (1 mol L-1) with various EtOH:MeOH ratios (i.e., 100:0, 80:20, 60:40, 40:60, 20:80 and 0:100). In addition, a conventional three-electrode electrochemical cell was used, and this cell consisted of a 2 cm2 Pt plate as the counter electrode, a reversible hydrogen electrode (RHE) as the reference electrode and a glassy carbon electrode as the support for the working electrodes.
Spectroelectrochemical in situ ATR-FTIR (attenuated total reflectance Fourier transformed infrared spectroscopy) measurements were performed using a Varian® 660 IR spectrometer equipped with a MCT detector cooled with liquid N2, a MIRacle with a Diamond/ZnSe Crystal Plate (Pike®) ATR accessory and a special cell, as described by Silva et al.,14 using a conventional three-electrode scheme. The electrocatalytic activity of the materials was studied using a 0.1 mol L−1 HClO
4 solution containing ethanol and methanol mixtures with various EtOH:MeOH ratios (i.e., 100:0, 80:20, 60:40, 40:60 and 20:80). All spectroelectrochemical measurements were carried out in duplicate. The working electrodes were prepared using 3 µL of electrocatalytic dispersion.
Results and Discussion
The elemental composition of PtSn/C electrocatalysts was measured by EDS as shown in Table 1. In general, the percentage of carbon Vulcan XC - 72 in the samples was 80 ± 2% and the oxygen percentage increases with Sn amount in the electrocatalysts (11-16%).
Figure 1a shows the XRD patterns of the PtSn/C (3:1), (1:1) and (1:3) electrocatalysts. The peaks positions are also included for reference. Significant alloy formation was
Table 1. Chemical semiquantitative analysis by EDS for PtSn/C electrocatalysts prepared by polymeric precursor method
Electrocatalyst Mass ratio / % Atomic ratio / %
Pt Sn Pt Sn
PtSn/C (3:1) 77 23 67 33
PtSn/C (1:1) 51 49 41 59
observed for PtSn/C (3:1) based on a shift in the 2θ values for the Pt peaks. The alloying degree (91%) and TEM (Figure 1b) morphology/mean particle diameter results were very similar to those reported by Silva et al.14 However, in the PtSn/C (1:1) and PtSn/C (1:3) electrocatalysts, barely any alloy formation was observed, and different sizes and mean particle distributions were observed compared to that for PtSn/C (3:1). As expected, high amounts of Sn increased the formation of SnO2 in the electrocatalysts.26 In addition, the peaks observed for SnO2, carbon and Pt are consistent with those reported in the literature.27
Based on the results in Figure 1a, the lattice parameters and crystallite sizes of the electrocatalysts were calculated from the Pt (200) peak position and are presented in Table 2. The lattice parameter (α) was calculated based on equation 1,28 and the crystallite size (τ) was calculated from equation 2.
(1)
(2)
In these equations, h, k and l are the Miller indexes, λ
is the wavelength, n is the reflection order, θ is the incident X-ray angle, k is the shape coefficient (k = 0.9), and β is the full width at half maximum. For all of these cases except PtSn/C (3:1), the lattice parameter calculated was consistent with the expected value because the Pt lattice parameter was approximately 3.917,24 and the slight displacement (especially for PtSn/C (1:1) and PtSn/C (1:3)) was due to
an increase in the amount of SnO2 in the electrocatalysts because the lack of alloy formation decreases the lattice parameter.29
In addition, the observed crystallite sizes are consistent with those observed by Silva et al.,14 who employed the polymeric precursor method to produce PtSn/C (3:1) electrocatalysts with a high alloy degree and crystallite sizes of approximately 5 nm. Due to the low alloy formation in the PtSn/C (1:1) (39%) and PtSn/C (1:3) electrocatalysts, their crystallite sizes were expected to be high because an increase in SnO2 results in an increase in the crystallite size,20,30 and the diffraction peaks become larger.
Figure 2a shows the cyclic voltammograms of all of the studied electrocatalysts in acidic media. The hydrogen adsorption and desorption potential regions (0.05-0.4 V) are less important for these electrocatalysts compared to those of a Pt/C electrocatalyst due to the addition of Sn decreasing the interaction between hydrogen molecules and the Pt surface. Hydrogen molecules can block Pt sites and even modify their electronic properties.31,32
The cyclic voltammograms of the catalysts indicate an increase in the current at the double layer between 0.4 and
Figure 1. (a) X-ray diffractograms of the PtSn/C (3:1), PtSn/C (1:1) and PtSn/C (1:3) electrocatalysts prepared using the polymeric precursor method. Transmission electron microscopy (b) image and (c) size distribution histogram for the PtSn/C (3:1) electrocatalyst.
Table 2. Lattice parameters and crystallite sizes calculated for all of the electrocatalysts
Electrocatalyst Lattice parameter / nm
Crystallite size / nm
Alloy degree28 / %
PtSn/C (3:1) 0.399 8.4 91
PtSn/C (1:1) 0.394 3.6 39
Electrooxidation of Mixed Ethanol and Methanol Solutions on PtSn/C Electrocatalysts J. Braz. Chem. Soc. 1094
0.8 V, which may be related to Sn oxide species. The peaks that appeared at approximately 0.66 and 0.60 V are maybe due to O2 adsorption/desorption from the dissociation of water on Sn oxide.14 In this potential region, for a lower amount of Sn in the electrocatalyst, the current values are broader, which is most likely due to a decrease in electroactive surface area (ESA) of the SnO2 species. A higher mean crystallite sizes corresponds to a lower ESA for
SnO2.30 Between 0.8 and 1 V, the peak corresponding to Pt oxidation and PtO reduction was observed, the current for this peak was the smallest for the electrocatalysts containing less Pt, as expected.
It is important to note that the results for the oxidation of ethanol, methanol and ethanol and methanol mixtures were not inserted because the electrocatalytic activity was too small using PtSn/C (1:1) and PtSn/C (1:3). Subsequent experiments were only performed using PtSn/C (3:1).
The cyclic voltammograms of the oxidation of solutions using PtSn/C (3:1) are shown in Figure 2a. As expected, the higher ethanol volume present the less positive onset oxidation potentials because the adsorption of ethanol molecules was favored for this material, which results from the change in the Pt electronic structure due to Sn.24 However, the highest normalized current peak was observed for the solution that contained only methanol, which is most likely due to the CO adsorption step.33 This step is favored in methanol and oxidizes at the highest positive potentials (in the peak current region).
The activity of the PtSn/C (3:1) electrocatalyst for the oxidation of the solutions in the potentiostatic experiments is shown in Figure 2c. The oxidation of the EtOH:MeOH (80:20) solution exhibited the highest normalized current after 1800 seconds. However, from the beginning of the oxidation reaction to 1200 seconds, the EtOH:MeOH (60:40) solution exhibited the highest normalized current.
This result indicated that in the presence of Sn, the Pt sites primarily adsorb ethanol molecules. However, the complete oxidation of ethanol is slower than that of methanol.6 The addition of a small amount of methanol could contribute to the result because some free sites on Pt and SnO2 are available to participate in the bifunctional mechanism in the methanol oxidation reaction. These sites are due to PtSn/C (3:1) not being a perfect alloy. Thus, this composition may optimize both the electronic and bifunctional effects for the oxidation of mixtures. In addition, the potential formation of a large variety of by-products using mixed solutions compared to that using ethanol and methanol may lead to the larger number of effective electrons being transferred during the oxidation processes than when CO2 is produced (with slow kinetics) at low potentials. Here, it is important to point out that the lower the current densities for oxidation the lower the kinectics. This behavior was also observed in a previous work.14 In that work using Pt
3Sn/C non-alloyed catalysts, the C−C bond breaking is favored, and a high conversion of ethanol to CO2 is obtained. However, in the case related, the kinetics are slow, and appreciable current is observed only at high potential values. For alloyed catalysts, acetic acid is preferentially formed with fast kinetics which is the case of this work.
Figure 2. (a) Cyclic voltammograms (v = 0.05 Vs-1) in H
The enhancement of activity using P3Sn/C electro-catalysts for ethanol oxidation it is suggested to be explained using FTIR and density functional theory (DFT) studies.34 Based on those studies Sn inhibits the ethanol C−C bond breaking at the step edge on Pt (211) but promotes active surface oxidant by OH formation on Pt (111) with a lower onset potential. Thus, Sn facilitates ethanol dehydrogenation and partial oxidation to acetaldehyde and acetic acid leading to a higher rate of ethanol oxidation but low selectivity to CO and CO2. The addition of methanol to ethanol solutions increases the total current densities because methanol is easier to be oxidized to CO2. For this reason, one can obtain high current densities for oxidation of mixed ethanol and methanol solutions.
Therefore, the normalized current during the chronoamperometric measurement for the oxidation of the mixed solution was the highest. This effect was confirmed by the in situ ATR-FTIR measurements (Figure 3).
Based on the results obtained from the electrochemical
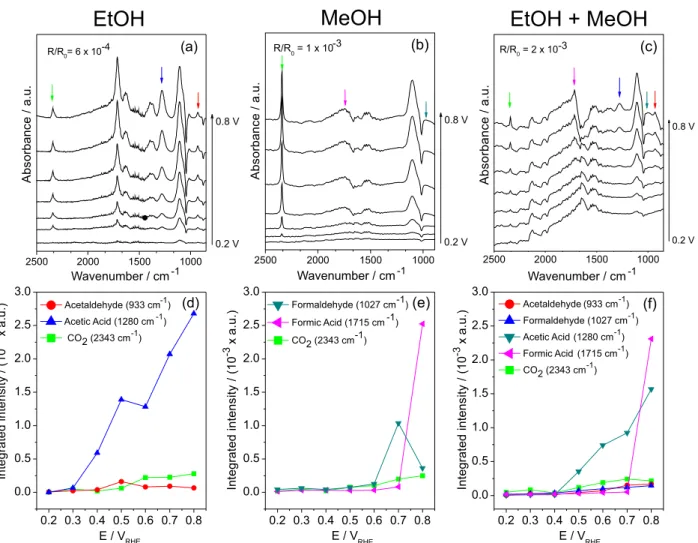
experiments, in situ ATR-FTIR measurements of the ethanol and methanol mixture with a 80:20 ratio using the PtSn/C (3:1) electrocatalyst were performed (see Figures 3c and 3f). For comparison, in situ ATR-FTIR measurements were also performed for the PtSn/C (3:1) electrocatalyst using solutions containing ethanol and methanol, as shown in Figures 3a/3d and Figures 3b/3e, respectively. These measurements were performed using HClO4 (0.1 mol L-1) to avoid sulfate adsorption.
A comparison of the results in Figures 3a and 3d to literature data indicates that the main products formed in the ethanol oxidation reaction using the PtSn/C (3:1) electrocatalyst were CO2, acetaldehyde and acetic acid with bands at approximately 2343,35 933 and 1280 cm-1, respectively. Therefore, ethanol was oxidized preferentially to acetic acid, and the integrated band intensity of CO2 was less pronounced than the acetic acid one, which was similar to the measured for acetaldehyde produced. This result indicates that the oxidation reaction preferentially occurred via transfer of 4 electrons.14
Figure 3. In situ ATR-FTIR spectra of the products and their corresponding integrated intensities obtained for the oxidation of (a) and (d) ethanol (EtOH, 1 mol L-1); (b) and (e) methanol (MeOH, 1 mol L-1); (c) and (f) mixtures of ethanol and methanol in a volume ratio of 80:20 (1 mol L-1) using the Pt
Electrooxidation of Mixed Ethanol and Methanol Solutions on PtSn/C Electrocatalysts J. Braz. Chem. Soc. 1096
As shown in Figures 3b and 3e, the main products formed in the methanol oxidation reaction were CO2, formic acid and formaldehyde with bands at approximately 2343, 1715 and 1027 cm-1,36 respectively. In addition, it is important to note that at 0.7 V, the intensities for formic acid substantially increase at 0.8 V.
The results from the in situ ATR-FTIR measurements of the PtSn/C (3:1) electrocatalyst using solutions containing EtOH:MeOH (80:20) are shown in Figures 3c and 3f. The products obtained in the oxidation reaction of ethanol and methanol mixtures are the same as those obtained in the oxidation reaction of methanol and ethanol separately, and the same bands were also observed. The integrated band intensities of acetic acid followed a similar pattern as that observed in Figure 3d. However, in this case, the pattern was less pronounced, and the low integrated band intensity of acetic acid may indicate an improving of the CO2 band intensities. In addition, in this case, the formic acid band intensities increased at 0.8 V.
Based on the electrochemical results and in situ ATR-FTIR experiments, the normalized currents were the highest for the EtOH:MeOH (80:20) mixtures using PtSn/C (3:1) due to the amount of by-products formed (an effective number of electrons were transferred compared to that for methanol and ethanol), and more CO2 was produced at low potentials during the oxidation reaction compared to that for the oxidation of ethanol and methanol separately. This result was most likely due to this composition optimizing both the electronic and bifunctional effects for the oxidation of EtOH:MeOH (80:20) mixtures. If two mixed solutions of ethanol and methanol (80:20 and 60:40) presented higher currents, ca. 3.7 mA mgPt-1, for oxidation at 0.5 VRHE than when using ethanol (2.5 mA mgPt-1) and methanol (3.4 mA mgPt-1) individual solutions, probably using a direct fuel cell containing mixed ethanol and methanol solutions will improve the power densities of the device. Further studies will be perfomed using a direct fuel cell operating with mixed ethanol and methanol solutions.
Conclusions
In this study, an ethanol and methanol mixture with a 80:20 ratio exhibited the potential for future application in direct alcohol fuel cells when the PtSn/C (3:1) electrocatalyst was used (atomic ratio of 65:35). This result may be due to this composition optimizing both the electronic and bifunctional effects for the oxidation of mixed solutions. In addition, the normalized current that was obtained was the highest due to the amount of by-products formed (an effective number of electrons were transferred compared to that for methanol and ethanol), and
the band intensities for CO2 were observed at low potentials during the oxidation reaction compared to that for ethanol and methanol separately.
Supplementary Information
The Supplementary information with EDS analysis spectra and the electrooxidation of EtOH:MeOH solutions using PtSn/C (1:1) and PtSn (1:3) is available free of charge at http://jbcs.sbq.org.br.
Acknowledgments
M. C. Santos is grateful to CNPq (grant No. 474913/2012-0, 406612/2013-7), CAPES, Instituto Nacional de Ciência e Tecnologia (INCT) Energia e Meio Ambiente (process No. 573.783/2008-0) and FAPESP (process No. 2015/10314-8) for financial support. L. S. Parreira and A. Amorim also acknowledge their Doctoral and Undergraduate Research fellowships from FAPESP (grant No. 2011/00008-2 and 2012/09664-6). J. C. M. Silva is thankful for his FAPESP Post Doc fellowship (process No. 2013/01577-0).
References
1. Hotza, D.; da Costa, J. C. D.; Int. J. Hydrogen Energy 2008, 33, 4915.
2. Maimoun, M.; Madani, K.; Reinhart, D.; Sci. Total Environ.
2016, 550, 349.
3. Merle, G.; Wessling, M.; Nijmeijer, K.; J. Membr. Sci. 2011, 377, 1.
4. Rau, M.; Cremers, C.; Tubke, J.; Int. J. Hydrogen Energy 2015, 40, 5439.
5. Wang, Y.; Chen, K. S.; Mishler, J.; Cho, S. C.; Adroher, X. C.; Appl. Energy 2011, 88, 981.
6. Zhang, L.; Zhang, J.; Wilkinson, D. P.; Wang, H.; J. Power Sources 2006,156, 171.
7. Brouzgou, A.; Song, S. Q.; Tsiakaras. P.; Appl. Catal., B 2012, 127, 371.
8. Wu, J.; Yuan, X. Z.; Martin, J. J.; Wang, H.; Zhang, J.; Shen, J.; Wu, S.; Merida, W.; J. Power Sources 2008, 184, 104. 9. Mahapatra, S. S.; Dutta, A.; Datta, J.; Int. J. Hydrogen Energy
2011, 36, 14873.
10. Xiang, X. D.; Huang, Q. M.; Fu, Z.; Lin, Y. L.; Wu, W.; Hu, S. J.; Li, W. S.; Int. J. Hydrogen Energy 2012, 37, 4710. 11. Sieben, J. M.; Duarte, M. M. E.; Mayer, C. E.; Int. J. Hydrogen
Energy 2010, 35, 2018.
12. Rana, M.; Patil, P. K.; Chhetri, M.; Dileep, K.; Datta, R.; Gautam, U. K.; J. Colloid Interface Sci. 2016, 463, 99. 13. Zhu, M.; Sun, G.; Xin, Q.; Electrochim. Acta 2009, 54,
14. Silva, J. C. M.; Parreira, L. S.; De Souza, R. F. B.; Calegaro, M. L.; Spinacé, E. V.; Neto, A. O.; Santos, M. C.; Appl. Catal., B 2011, 110, 141.
15. Freitas, R. G.; Pereira, E. C.; Christensen, P. A.; Electrochem. Commun. 2011, 13, 1147.
16. Rousseau, S.; Coutanceau, C.; Lamy, C.; Léger, J.-M.; J. Power Sources 2006, 158, 18.
17. Antolini, E.; Gonzalez, E. R.; Catal. Today 2011, 160, 28. 18. Zhou, W.; Du, Y.; Ren, F.; Wang, C.; Xu, J.; Yang, P.; Int. J.
Hydrogen Energy 2010, 35, 3270.
19. Neto, A. O.; Farias, L. A.; Dias, R. R.; Brandalise, M.; Linardi, M.; Spinacé, E. V.; Electrochem. Commun. 2008, 10, 1315. 20. Guo, Y.; Zheng, Y.; Huang, M.; Electrochim. Acta 2008, 53,
3102.
21. Shen, S. Y.; Zhao, T. S.; Wu, Q. X.; Int. J. Hydrogen Energy
2012, 37, 575.
22. Antoniassi, R. M.; Neto, A. O.; Linardi, M.; Spinacé, E. V.; Int. J. Hydrogen Energy 2013, 38, 12069.
23. Wongyao, N.; Therdthianwong, A.; Therdthianwong, S.; Energy Convers. Manage. 2011, 52, 2676.
24. De Souza, R. F. B.; Parreira, L. S.; Rascio, D. C.; Silva, J. C. M.; Teixeira-Neto, E.; Calegaro, M. L.; Spinace, E. V.; Neto, A. O.; Santos, M. C.; J. Power Sources 2010, 195, 1589. 25. Parreira, L. S.; Rascio, D. C.; Silva, J. C. M.; De Souza, R. F.
B.; D’Villa-Silva, M.; Calegaro, M. L.; Spinacé, E. V.; Neto, A. O.; Santos, M. C.; Int. J. Chem. 2012, 4, 38.
26. Gupta, S. S.; Singh, S.; Datta, J.; Mater. Chem. Phys. 2009, 116, 223.
27. Correa, P. S.; Silva, E. L.; Silva, R. F.; Radtke, C.; Moreno, B.; Chinarro, E.; Malfatti, C. F.; Int. J. Hydrogen Energy 2012, 37, 9314.
28. Comalti, F.; Antolini, E.; Gonzalez, E. R.; J. Electrochem. Soc.
2007, 154, B39-B47.
29. Almeida, T. S.; Kokoh, K. B.; De Andrade, A. R.; Int. J. Hydrogen Energy 2011, 36, 3803.
30. Guo, Y.; Zheng, Y.; Huang, M.; Electrochim. Acta 2008, 53, 3102.
31. Jiang, L.; Hsu, A.; Chu, D.; Chen, R.; Int. J. Hydrogen Energy
2010, 35, 365.
32. Corradini, P. G.; Antolini, E.; Perez, J.; J. Power Sources 2015, 275, 377.
33. Freitas, R. G.; Santos, M. C.; Oliveira, R. T. S.; Bulhões, L. O. S.; Pereira, E. C.; J. Power Sources 2006, 158, 164.
34. Jin, J.-M.; Sheng, T.; Lin, X.; Kavanagh, R.; Hamer, P.; Hu, P.; Hardacre, C.; Martinez-Bonastre, A.; Sharman, J.; Thompsett, D.; Lin, W.-F.; Phys. Chem. Chem. Phys. 2014, 16, 9432. 35. De Souza, R. F. B.; Parreira, L. S.; Silva, J. C. M.; Simões, F.
C.; Calegaro, M. L.; Giz, M. J.; Camara, G. A.; Neto, A. O.; Santos, M. C.; Int. J. Hydrogen Energy 2011, 36, 11519. 36. Liu, F.; Yan, M.; Zhou, W.; Jiang, Z.; Electrochem. Commun.
2003, 5, 276.
Submitted: May 23, 2016
Published onine: September 29, 2016