Article
0103 - 5053 $6.00+0.00*e-mail: [email protected]
Identiication and Quantiication of Furanic Compounds in Tequila and Mezcal
using Spectroscopy and Chemometric Methods
Ana C. Muñoz-Muñoz,a Juan L. Pichardo-Molina,b Gabriel Ramos-Ortíz,b
Oracio Barbosa-García,*,b José L. Maldonado,b Marco A. Meneses-Nava,b
Nancy E. Ornelas-Soto,b,c Antonio Escobedoa and Pedro L. López-de-Albac
aCentro de Investigación y Asistencia en Tecnología y Diseño del Estado de Jalisco,
Av. Normalistas 800, 44270 Guadalajara, Jal., México
bCentro de Investigaciones en Óptica, A.P. 1-948, 37000 León, Gto., México
cInstituto de Investigaciones Cientíicas, Universidad de Guanajuato, Cerro de la Venada s/n,
CP 36040 Guanajuato, Gto., México
Neste artigo, duas bebidas mexicanas com denominação de origem controlada (DOC), tequila e mezcal, foram facilmente discriminadas por espectrofotometria UV-Vis e métodos quimiométricos. Os espectros foram registrados na faixa de 250-400 nm; a principal característica foi uma banda larga centrada em torno de 280 nm, cuja amplitude varia segundo o tipo de bebida e de marca. No entanto, diferenças adicionais foram identiicadas através de análise multivariada, mostrando uma distinção clara entre as bebidas. Usando RP-HPLC com detector ultravioleta, os compostos que têm origem na banda de absorção foram determinados. Portanto, o espectro de cada bebida na faixa de comprimento de onda de 250-330 nm aproximadamente, mostrou uma mistura particular de furfural (FUR), 2-acetilfurano (2AF) e 5 methylfurfural (5MF). Além disso, os espectros de absorção das misturas de FUR, 2AF e 5MF foram registrados em diferentes concentrações e com um modelo de mínimos quadrados parciais (PLS), as concentrações desses compostos foram previstas em amostras de teste e em licores. Quando estes resultados foram comparados com os obtidos por HPLC, os coeicientes de correlação foram de R ≥ 0,920. Portanto, esta metodologia
apresenta um método alternativo para identiicar e quantiicar alguns compostos furanos em tequilas brancas e mezcales. Além destes resultados, a metodologia pode ser realizada in situ e resultados especíicos no controle de qualidade podem ser obtidos em poucos minutos.
In this paper, two Mexican white spirits with appellationd’origen contrôlée (AOC), i.e., tequila and mezcal were easily discriminated by using UV-Vis spectrophotometry and chemometric techniques. The spectra were recorded in the range of 250-400 nm and their main feature is a broad band centered about 280 nm whose amplitude changes according to the type of beverage and brand, however, additional differences are pointed out through multivariate analysis that makes a fair differentiation between the beverages. By using RP-HPLC with UV detector, the compounds that originate the absorption band were determined. Thus, the spectrum of each beverage in the wavelength range of 250-330 nm, approximately, is a particular mixture of furfural (FUR), 2-acetylfuran (2AF) and 5-methylfurfural (5MF). Further, the absorption spectra of mixtures of FUR, 2AF and 5MF standards were recorded at several concentrations and by using a partial least square model (PLS), the concentrations of those compounds were predicted in test and spirit samples. When these results were compared to those obtained by HPLC, the correlation coeficients were R ≥ 0.920. Therefore, with this methodology one builds up an alternative method
to identify and quantify some furanic compounds in white tequilas and mezcals. In addition to these results, the methodology can be performed on site and results about speciic quality controls can be obtained within minutes.
Introduction
Tequila and mezcal are two traditional Mexican distilled beverages with similar production phases, both having the AOC. Tequila must be made exclusively from Agave tequilana Weber blue variety, whereas mezcal is made from different agave species, among them A. salmiana, A. angustifolia and A. potatorum.1,2 The production of both
beverages begins with the cooking of the agave stems. During the cooking phase several chemical reactions occur, including the conversion of the complex carbohydrates of inulin into simple fermentable sugars. The production of furanic compounds such as furfurals also occurs by the well known Maillard reaction.3,4 These furanic compounds
(FUR, 2AF and 5MF), however, are of particular concern due to their association with hepatocellular adenomas and carcinomas when they are present at high levels.5,6 As a
result the Mexican regulations currently allow a maximum permissible concentration of furfural of 4 mg per 100 mL anhydrous alcohol (AA) in tequilas.
After cooking, the agave stems are crushed and shredded to extract the sugar-juice which is subsequently fermented. The juice that results from the fermentation process, known as “mosto”, is distilled twice to obtain a clear spirit which is called white tequila or white mezcal. For both spirits, sugars are used in different percentages that affect their quality and classiication. According to the oficial Mexican regulations,2 tequila can be classiied as
100% agave when 100% of the sugars come from Agave tequilana Weber blue variety;and as mixed when no less than 51% of the sugars come from this agave type (with the other resultant sugar content typically from sugar cane). In the case of mezcal, the Mexican regulation1 deines mezcals
as type I and type II. For type I, only sugars from the agave speciied in this regulation are allowed to be used where as for type II, up to 20% of different sugar sources can be used.
Recent studies have been performed to approach chemical characterization and authentication of tequilas and mezcals.7-13 However, for some routine tests intended
to keep or improve the quality control during fabrication, or to differentiate between two similar beverages as white tequilas and mezcals, still one has to make use of methods which are time consuming (with a time response of hours) or to make use of expensive equipment which might not be at hand.14,15 In this paper we focus on an
alternative screening method when a quick test is required. With this screening method we do not expect to certify the authenticity of spirits but helping to quantify some compounds through alternative ways, differentiate among similar beverages, or to screen the production on site for quality control. Thus, it is shown that spectrophotometry
combined with multivariate calibration methods represents a possibility to reduce the demand of sample analysis using chromatographic techniques when a semi-quantitative result is desired. Some works have shown the effectiveness of applying chemometric methods to different spectroscopic techniques. For example, NIR and Mid-IR spectra to estimate the ripeness of wine grapes and discrimination of Cognacs,16,17 and to FT-IR, UV and luorescence spectra
for the characterization and classiication of wine and brandies18-20 or the determination of several compounds
such as sugars,21,22 dyes23 and stimulants24 in drinks. For the
case of tequila, chromatic analysis and chemometrics tools have been applied to FT-IR and UV-Vis absorption spectra to discriminate between 100% agave and mixed tequilas as well as among tequilas from different brands.25-28 As of the
present time, however, no study has been reported which uses UV absorption spectrophotometry to discriminate tequilas from mezcals, nor which attempts to identify the individual chemical components responsible for the UV spectral behavior of these spirits by using RP-HPLC.
Experimental
Reagents
All experiments were performed with analytical reagent grade chemicals. Furfural (FUR), 2-acetylfuran (2AF) and 5-methylfurfural (5MF) standards were purchased from Sigma-Aldrich (Toluca, México). HPLC grade methanol and acetonitrile were purchased from Caledon (Georgetown, Canada).
Apparatus and software
Acquisition of absorbance spectra was performed using a Lambda 900, Perkin-Elmer spectrophotometer. The absorbance data were registered in the 250-400 nm region. All measurements were recorded in a 10 mm quartz cell. The Unscrambler© and MatLab R12© software
were used for the multivariate analysis calculations and STATGRAPHICS Centurion XV.II. was used for statistical calculations.
Preparation of synthetic samples of FUR, 2AF and 5MF for multivariate calibration
standard with ethanol:water (40:60%, v/v) in a 100 mL volumetric lask. A suitable aliquot of working solution of each compound were placed in a 10 mL volumetric lask in order to obtain the desired concentrations (0.13-1.21 for FUR, 0.08-0.50 for 2AF and 0.28-1.18 mg per 100 mL AA for 5MF) and the mixture was diluted to the mark with ethanol:water (40:60%, v/v). Then, 2 mL of these solutions were transferred into the 10 mm quartz cell and the absorption spectra were recorded in a range of 250-400 nm in steps of 0.5 nm.
Procedure for the sample analysis
For the multivariate analysis 82 and 23 samples of white tequilas and mezcals, respectively, were used. Samples were purchased at liquor stores looking not to have bottles from the same batch; a few of them were obtained directly from the distillery, however. The absorption spectra of all samples were measured by taking less than 3.0 mL of the bottled spirits and were placed directly into a 10 mm quartz cell. When the absorbance of a given sample had values higher than the most concentrated of calibration set, the sample was then diluted 1:1, 1:2 or 1:3 (v/v) according to the sample with ultrapure water in order to ensure the furanic concentrations in the range of calibration and the linearity test. The inal results of absorbance and concentration presented in Tables and Figures were adjusted by the used dilution factor. The measurements were made between 250 and 400 nm.
HPLC method
Calibration curves were established for FUR, 2AF and 5MF present in with tequila and white mezcal samples. For that purpose, 10.0 mg of each compound was placed in a 10 mL volumetric lask and dissolved in ethanol:water (40:60%, v/v). Beginning with this solution, ive additional calibration levels were prepared by serial dilution with ethanol:water (40:60%, v/v) using the average furfural concentration of the samples as the mid-point of the calibration curve. Within the range of concentrations injected, the detector response was linear for each compound (R = 0.9995). Subsequently, 12 samples of mixed tequilas, 8 samples of 100% agave tequilas, and 7 of mezcals of type I were analyzed by HPLC. The samples were iltered through cellulose membranes of 0.45 µm pore diameter and were injected directly.
The chromatographic studies were performed on a Varian HPLC system equipped with a ProStar 230 ternary LC pump, and a ProStar 335 UV-Vis diode array detector. The separation of spirit samples and standard solutions was performed at 25 ºC on a 250 × 4.6 mm i.d., 5 µm particle
size, Spherisorb ODS column (Waters, USA) protected with a precolumn of the same material and using an injection volume of 20 µL. Two solvents were used: a mobile phase A consisting of water:methanol (10:90%, v/v), and a mobile phase B consisting of water:methanol:acetonitrile (2:1:1, v/v), both acidiied with 2 mmol L-1 formic acid. A constant
proportion of 90% phase A and 10% phase B was used at a low rate of 1 mL min-1. For quantiication purposes, an
absorption wavelength of 280 nm was chosen due to its proximity to the maximum response for each compound. The UV spectra in the range of 250-400 nm were also recorded for each sample. The compounds were identiied by comparing the retention time, and the UV-Vis spectra with those of the standards, and through the analysis of the matrix spike samples.
Multivariate analysis
In order to sort the 105 samples of spirits according to their category (tequilas and mezcals), we made use of principal components analysis (PCA). Briely, PCA linearly transforms a data matrix X (in our case, each row contains data relating to an absorption spectrum), such that the new variables, or principal components, are ranked according to their variance; the irst being the new variable with the maximum variance; the second the one with the next largest variance and so on.29 When the matrix X is transformed into
the matrix PC, the irst column of PCcorresponds to the irst principal component, the next to the second one and so on. Thus, the unsupervised PCA (cross-validation method) was applied to our tequila and mezcal samples to investigate for differences between the corresponding absorption spectra, and discriminate the samples. On the other hand, partial least square (PLS) is a method for constructing predictive models when the factors are highly collinear. The PLS method emphasizes the prediction of the responses, and not the understanding of the underlying relationship between variables. PLS uses factor analysis to compress the size of the spectra and to remove redundant information. Generally, PLS uses information about the property of interest (in our case the furanic concentration values) along with sample variance in the compression process to create factors, that are correlated with the property of interest.30
concentrations were comprised in the calibration set range. The compositions of the calibration and prediction sets are shown in Table 1. Finally, the PLS model was performed using the cross-validation method and employed to predict the concentration of the above mentioned compounds on the UV-Vis spectra of 20 tequilas (100% agave and mixed) and 7 mezcals, which were previously analyzed by HPLC.
Results and Discussion
Inluence of variables
The inluence of the pH and the alcohol percentage on the absorbance of the standard compounds of FUR, 5MF and 2AF were tested. For the irst case, the pH was modiied with slightly additions of HCl or NaOH and three solutions were prepared containing 0.5 mg per 100 mL AA of FUR, 2AF and 5MF and KCl 0.5 mol L-1 each; the solutions
were kept stirred all the time. The results show that the absorbance of FUR, 2MF or 5MF is independent of the pH at a wide range, i.e., 3-11. For the case of alcohol similar results were obtained when the alcoholic percentage was changed in a 10-70% (v/v) range. The calibration curves were linear in the working concentrations.
Spectral characteristics of tequila and mezcal samples
Representative absorption spectra of 4 tequilas (solid line) and 4 mezcals (dotted lines) in the range of 250-400 nm are shown in Figure 1. For reference, the average absorption spectra for all the studied tequilas (82 samples) and mezcals (23 samples) are also plotted (bold lines). It is important to remark that all samples are colorless solutions; therefore they do not contain any additional colouring or caramel additive. This igure show a typical broad band with a peak intensity located near to 280 nm (with small variations between samples). This broad absorption band has also been reported in other spirits, such as whiskies and it has been used for discriminate spirits.10,24,30 For whiskies, it was reported that absorbance
patterns could be established for speciic Scotch brands; therefore any variation out of range of the established values could signify an adulteration. For the discrimination among tequilas, Barbosa-Garcia et al.,25 and Jones et al.,26 used
the measured spectra with chemometrics calculations and methods based upon chromatic analysis of the broadband, respectively. However, these studies were conducted without the aid of chromatography to support the analysis. For the case of white tequilas and mezcals, Figure 1 shows that mezcal samples have higher absorption values than
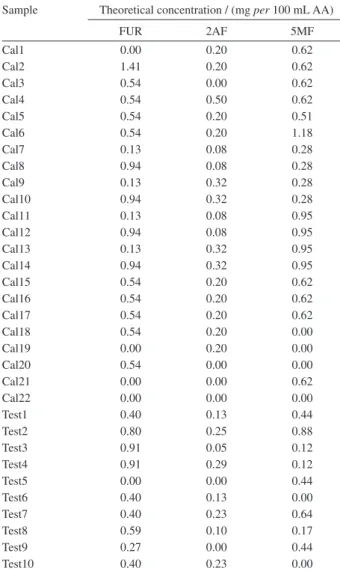
Table 1. Composition of calibration (Cal1-Cal22) and validation (Test1-Test10) sets
Sample Theoretical concentration / (mg per 100 mL AA)
FUR 2AF 5MF
Cal1 0.00 0.20 0.62
Cal2 1.41 0.20 0.62
Cal3 0.54 0.00 0.62
Cal4 0.54 0.50 0.62
Cal5 0.54 0.20 0.51
Cal6 0.54 0.20 1.18
Cal7 0.13 0.08 0.28
Cal8 0.94 0.08 0.28
Cal9 0.13 0.32 0.28
Cal10 0.94 0.32 0.28
Cal11 0.13 0.08 0.95
Cal12 0.94 0.08 0.95
Cal13 0.13 0.32 0.95
Cal14 0.94 0.32 0.95
Cal15 0.54 0.20 0.62
Cal16 0.54 0.20 0.62
Cal17 0.54 0.20 0.62
Cal18 0.54 0.20 0.00
Cal19 0.00 0.20 0.00
Cal20 0.54 0.00 0.00
Cal21 0.00 0.00 0.62
Cal22 0.00 0.00 0.00
Test1 0.40 0.13 0.44
Test2 0.80 0.25 0.88
Test3 0.91 0.05 0.12
Test4 0.91 0.29 0.12
Test5 0.00 0.00 0.44
Test6 0.40 0.13 0.00
Test7 0.40 0.23 0.64
Test8 0.59 0.10 0.17
Test9 0.27 0.00 0.44
Test10 0.40 0.23 0.00
Figure 1. Absorption spectra of 4 samples of 100% agave tequilas and 4
tequila samples and this is in concordance with the HPLC results; this absorption increase can be related with the higher furanic content in mezcals as compared to tequilas.
HPLC method
The HPLC method was validated for linearity, accuracy, precision and repeatability. Standard solutions were stable for at least 30 days when stored at 4 °C (conirmed by re-assaying the solution). Accuracy was conirmed by spiking a control sample of white tequila with three concentrations (80, 100, and 120% of the mid-point concentration of the calibration curve) of the standard compounds. The spiked samples were assayed under optimized conditions and recovery rates were between 88.7% (2AF, low spike) and 109.06% (FUR, high spike). Precision (intra- and interday) of the assay was veriied by analyzing the control sample of white tequila three times on three consecutive days (RSD ≤ 1.3%). Repeatability was conirmed by evaluating
the consistency of retention times and the relative standard deviations of the detector response.
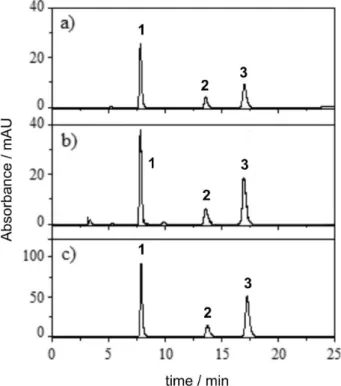
The analysis with HPLC was performed by direct injection of 20 samples of white tequila (100% agave and mixed) and 7 of white mezcal. Figure 2 shows the chromatograms of a sample of (a) mixed tequila, of (b) 100% agave tequila and of (c) mezcal. Three compounds, FUR, 2AF and 5MF were identiied in each sample; no other peaks were observed in the 250-400 nm range. The identiied compounds have been
previously reported in the literature9,12,32 and are commonly
present as components of tequila and mezcal samples. Table 2 shows, in the HPLC column for each compound, the measured and mean concentrations expressed in mg
per 100 mL AA. In this Table the PLS prediction and mean concentration of the compounds for mixted, 100% agave tequilas and mezcals are reported and discussed. The average concentration for FUR, 2AF and 5MF in mixed tequilas was 0.62, 0.38 and 0.53; in 100% agave tequilas was 1.17, 0.44 and 0.94; and in mezcals was 2.71, 0.49 and 2.11 mg per 100 mL AA, respectively. All measured values of the compounds in the complete set of tequilas are within the Mexican Regulations.2 It should be pointed
out that for mezcals there is no restriction for the content of furfural in the Mexican Regulations.1 By comparing
the values between mixed and 100% agave tequilas it is found that the latter have a higher content of the furanic compounds. This result is not surprising, as the production of Maillard compounds3 such as furfurals originates from the
cooking of the agave heads to produce fermentable sugars during tequila or mezcal production. Since no cooking is necessary in the use of fermentable sugars such as of sugar cane, these compounds are not produced and thus lower quantities are found in mixed tequilas. Therefore, it has been suggested that the concentration of furanic compounds may be used for discrimination between 100% blue agave and mixed tequilas.12 The measurements also show a higher
content of furanic compounds in mezcals as compared to tequilas. This result might be explained by differences in the raw material or by the often rudimentary manner in which mezcal is produced (i.e., cooking, fermentation and distillation processes). Therefore, the HPLC results suggest that tequila and mezcal could be differentiated according to their furanic content and this is also shown below through UV-Vis spectroscopy.
Analysis of synthetic samples by PLS method
The performance of the PLS model, calibrated by measuring the UV-Vis absorption spectra of solutions containing FUR, 2AF and 5MF at the speciied concentration range, showed a good correlation to the cross-validation of each compound (R ≥ 0.914). The statistical parameters
obtained in the analysis of the calibration and validation sets are summarized in Table 3. The mean recovery values for each analyte, as mentioned above, were 102.50, 92.25 and 99.11, respectively. It is thought that 2AF presents relatively low recoveries due to its lowest concentration compared to the other two furanic components and because its UV spectrum is overlapped completely by the FUR spectrum.33
This can be seen in Figure 6 and it is discussed later.
Analysis of tequila and mezcal samples by chemometric methods
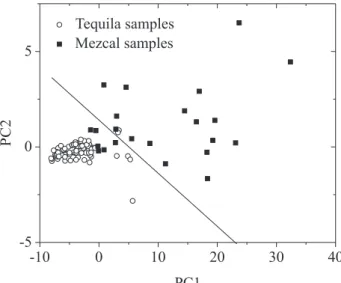
Figure 3 shows the results of the PCA calculation performed on the UV-Vis spectra data in the 250-400 nm region. For this case, PC1 (x-axis) versus PC2 (y-axis), shows the best discrimination between tequilas and mezcals, and the percent of variance for these components was 97.6 and 1.5%, respectively. In Figure 3 a small dispersion in the PC1-PC2 space is shown for the case of tequilas, while for mezcal samples a larger dispersion is observed. On the other hand, when the irst loading vector was plotted as a function
of the wavelength (data not shown), the region that offers the maximum discrimination between tequilas and mezcals comes from the changes of the maximum absorbance located around 280 nm; this wavelength corresponds to the maximum absorbance of the mixture of the three compounds. This Figure also shows a solid line (the line border decision) that separates tequilas from mezcals and it was calculated by using linear discrimination analysis (LDA) to the irst two principal scores. Two tequilas and six mezcals were not well classiied, giving as a result that 97% of tequilas and 74% of mezcals were well classiied using the proposed PCA and LDA models.
Table 2. HPLC and PLS quantitative analysis of furanic compounds in mixed (No.1-12), 100% agave Tequila (No.13-20) and mezcals samples (No. 21-27)a
Sample furfural 2-acetyl furan 5-methylfurfural
HPLC PLS HPLC PLS HPLC PLS
1 0.8 0.84 0.34 0.24 0.69 0.68
2 0.25 0.49 0.48 0.45 0.28 0.36
3 1.11 1.29 0.45 0.36 1.30 1.36
4 0.78 0.91 0.28 0.24 0.84 0.80
5 0.61 0.50 0.24 0.18 0.33 0.30
6 0.63 0.65 0.28 0.21 0.48 0.42
7 1.03 1.18 0.77 0.70 0.73 0.68
8 0.69 0.76 0.43 0.48 0.57 0.53
9 0.43 0.61 0.30 0.32 0.28 0.24
10 0.39 0.29 0.18 0.14 0.32 0.28
11 0.38 0.34 0.51 0.61 0.28 0.23
12 0.27 0.28 0.31 0.26 0.29 0.34
Mean 0.62 (0.15) 0.68 0.38 (0.29) 0.35 0.53 (0.20) 0.52
13 1.44 1.26 0.43 0.44 1.58 1.69
14 0.66 0.68 0.38 0.33 0.77 0.80
15 0.98 1.20 0.53 0.51 0.41 0.50
16 1.03 1.22 0.54 0.49 0.43 0.46
17 0.51 0.46 0.34 0.32 0.37 0.31
18 1.52 1.55 0.28 0.36 1.01 0.97
19 0.90 0.87 0.40 0.35 0.85 0.61
20 2.30 2.26 0.59 0.47 2.09 2.00
Mean 1.17 (0.20) 1.19 0.44 (0.25) 0.41 0.94 (0.20) 0.92
21 1.52 1.86 0.16 0.32 1.22 1.27
22 2.23 1.66 0.23 0.35 3.29 2.62
23 3.29 4.27 0.30 0.34 3.85 3.42
24 6.08 7.81 1.26 1.45 2.84 2.76
25 1.40 1.88 0.48 0.80 0.48 0.59
26 3.38 4.62 0.60 0.82 2.78 3.01
27 1.05 1.40 0.37 0.35 0.34 0.36
Mean 2.71 (0.11) 3.36 0.49 (0.24) 0.63 2.11 (0.18) 2.00
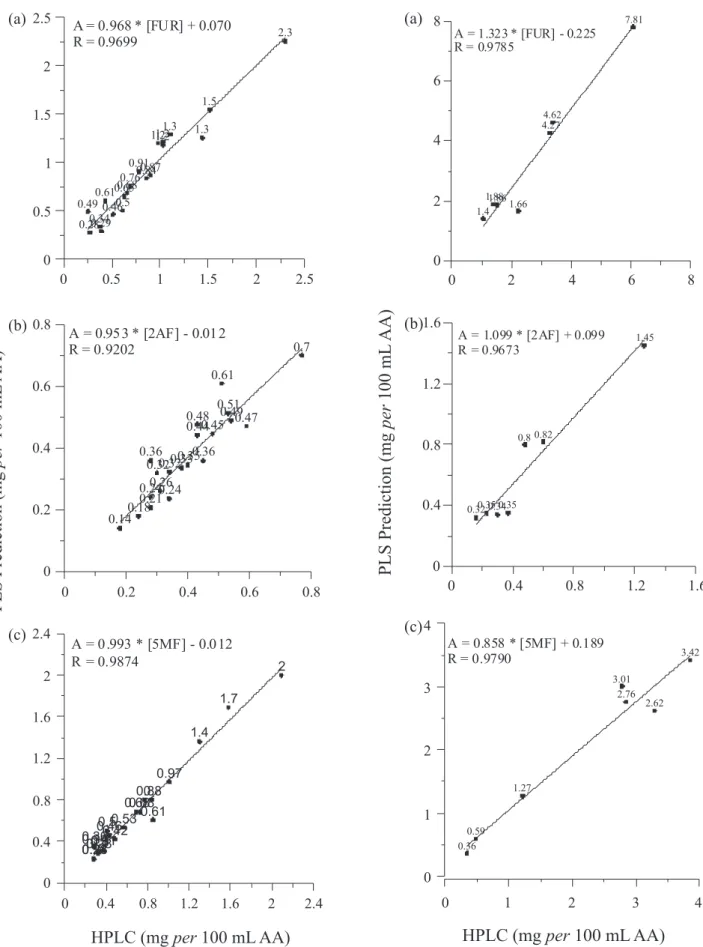
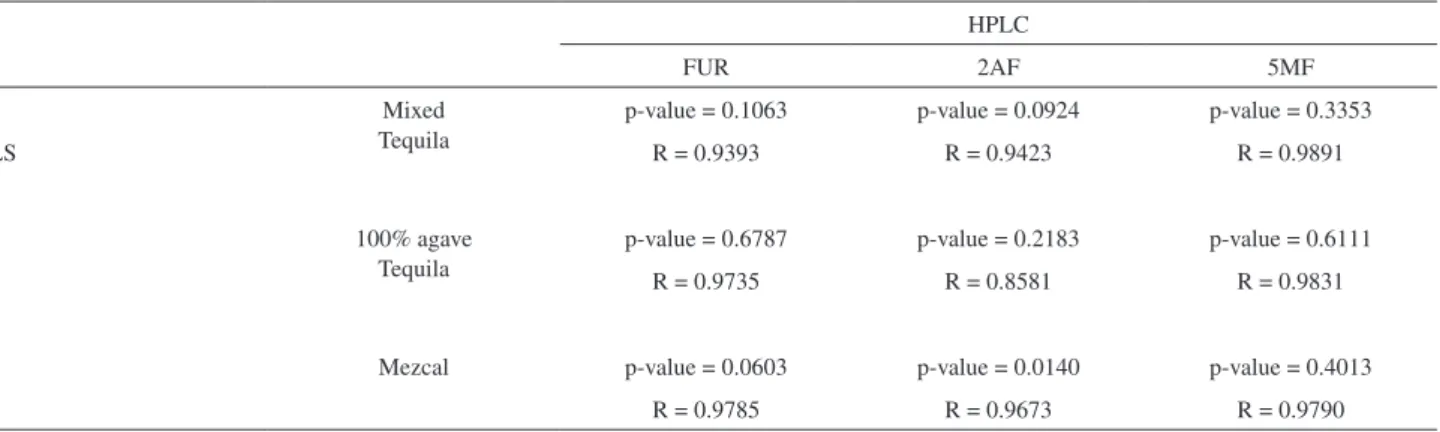
Table 2 presents the results for the prediction of FUR, 2AF and 5MF concentrations for tequilas and mezcals as determined by introducing the UV-Vis spectra data of these spirits into the PLS model. The obtained average concentration for FUR, 2AF and 5MF in mixed tequilas was 0.68, 0.35 and 0.52; in 100% agave tequilas was 1.19, 0.41 and 0.92; and in mezcals was 3.36, 0.63 and 2.00, respectively. The predicted quantity values showed a good agreement with those obtained by HPLC and the correlation coeficients are shown in Figures 4 and 5 for tequilas and mezcals, respectively. The HPLC and PLS results were statistically compared by using paired sample t-test and a summary is presented in Table 4. The comparison of the p-value and
α = 0.05 (a p-value ≥α is desirable) with a conidence level
of 95.0% indicates that there was no statistically signiicant differences in the means of the PLS method and the reference HPLC method for the three analytes of tequilas samples (mixed and white). In Table 5, similar results were obtained for FUR and 5MF of mezcal samples, while, the means of the methods for 2AF of mezcal samples present statistically signiicant differences. This latter result might be due to the overlapped of the UV spectra of FUR and 2AF and, because the intensity difference of the absorption maxima is higher than in tequila samples (Figure 6). Therefore, the poor signal of 2AF introduces signiicant errors in the prediction of its concentration in mezcal samples; this is not the case of tequilas where the intensity difference is not high.33 However, as mentioned above, the HPLC and PLS
results were found highly correlated (correlation coeficient 0.9673 for 2AF), indicating a relatively strong relationship between both methods (Table 5). It should be noted that the Mexican standards regulate only the content of FUR, which is clearly determined by the alternative method in all the analyzed samples.2
The good agreement between the HPLC measurements and the PLS model can also be observed by reconstructing the absorption spectra of tequila and mezcal samples by summing the absorption spectrum of each chemical component at the corresponding concentration obtained through the PLS model. For instance, Figure 6 shows the spectra of ethanol:water (40:60%, v/v) solutions of FUR, 2AF and 5MF (solid lines) with the corresponding concentration predicted by PLS, in this case for one tequila (sample 18) and one mezcal (sample 24). Hence
Table 3. Statistical parameters obtained from the analysis of the calibration and validation sets by PLS method
FUR 2AF 5MF
Parameters for calibration (cross-validation)
Factors 3 3 3
Predicted error sum of squares (PRESS) 1.927 0.764 1.177
Standard error of prediction (SEP) 0.296 0.191 0.217
Relative error of prediction (REP, %) 15.83 22.02 8.06
Correlation Coeficient (R) 0.978 0.914 0.994
Parameters for prediction (analysis of the validation set, 10 synthetic samples)
Factors 3 3 3
REP (%) 8.45 23.41 6.57
Root mean square of prediction (RMSEP) 0.134 0.124 0.128
Correlation Coeficient (R) 0.995 0.950 0.994
LOD (mg /100 mL AA) 0.06 0.03 0.01
Mean Recovery (%) 102.50 92.25 99.11
SDa 8.72 15.04 7.06
aStandard deviations for recoveries of the 10 samples.
Figure 3. PCA scatter plot obtained from the absorption spectra of tequilas
Figure 4. Concentration of FUR (a), 2AF (b) and 5MF (c) as measured by HPLC versus the predicted concentration determined using the multivariate calibration method (PLS) for tequilas.
Figure 6. Absorption spectra of synthetic solutions of the individual
components dissolved at concentrations determined by PLS for a) tequila (sample 18) and for b) mezcal (sample 24). The dashed line represents the absorption spectra of the corresponding tequila and mezcal samples.
the sum of the spectra of these three components gives a very good approximation of the original spectrum (dotted lines) of the corresponding beverages. The calculated curve, however, does show some disagreement near to 250 nm of the measured spectra. This might be due to other compounds that have absorbance maxima below 250 nm and in consequence were not detected by HPLC. Nevertheless, the correlation between the absorbance of the spirits and the concentration of FUR, 2AF and 5MF is indicative that a simple optical method can be implemented in the beverage industry to quantify these furfurals directly from spectroscopic measurement.
After double distillation, tequilas and mezcals look alike, i.e., they are clear beverages, with similar smell and alcoholic content. A similar problem is faced when one wants to differentiate one bottle of 100% agave tequila from another bottle of non 100% agave tequila. Thus, chromatographic methods should be used to classify among
Table 4. Comparison between PLS method and reference HPLC method using paired samples t-test
Type of sample
Analytes Mean SD Std. Error 95% conidence interval t
statistic
p-value Correlation
Lower Upper
Mixed
tequila FUR 0.0592 0.1165 0.0336 −0.0012 0.1196 1.7593 0.1063 0.9393
2AF −0.0317 0.0595 0.0172 −0.0625 −0.0008 −1.8430 0.0924 0.9423
5MF −0.0142 0.0487 0.0140 −0.0394 0.0111 −1.0076 0.3353 0.9891
100% agave
tequila FUR 0.0200 0.1309 0.0463 −0.0677 0.1077 0.4320 0.6787 0.9735
2AF −0.0275 0.0575 0.0203 −0.0660 0.0110 −1.3525 0.2183 0.8581
5MF −0.0212 0.1129 0.0399 −0.0969 0.0544 −0.5322 0.6111 0.9831
Mezcal
FUR 0.6500 0.7446 0.2814 0.1031 1.1969 2.3095 0.0603 0.9785
2AF 0.1471 0.1135 0.0429 0.0637 0.2305 3.4289 0.0140 0.9673
5MF −0.1100 0.3223 0.1218 −0.3467 0.1267 −0.9028 0.4013 0.9790
Table 5. Analysis of statistically signiicant differences in the means of the PLS method and the reference HPLC method by comparison of the p-value and α = 0.05 with a conidence level of 95.0%
HPLC
FUR 2AF 5MF
Mixed Tequila
p-value = 0.1063 p-value = 0.0924 p-value = 0.3353
PLS R = 0.9393 R = 0.9423 R = 0.9891
100% agave Tequila
p-value = 0.6787 p-value = 0.2183 p-value = 0.6111
R = 0.9735 R = 0.8581 R = 0.9831
Mezcal p-value = 0.0603 p-value = 0.0140 p-value = 0.4013
these spirits. To do so one should take the samples to the laboratory since the corresponding test cannot be performed on site and perform the corresponding chromatography studies. However, from the results it can be suggested that absorption spectroscopy and chemometric methods can be used to discriminate between the two categories of tequilas and between tequilas and mezcals. This could be done on site since today one can purchase miniature spectrometer in the UV-Vis region and the used software for multivariate calculations is neither dificult to use nor dificult to purchase. With the HPLC studies reported in this paper, it is shown that each spirit brand has a characteristic mixture of FUR, 5MF and 2AF that gives rise to the characteristic absorption band in the 250-400 nm region. Thus, any variation of this mixture by means of changing concentrations will induce an adulteration of the spirit. This was the case when three bottles from well known tequilas brands were purchased in the street market (i.e., not at the liquor store) and compared through the proposed method with those purchased at the liquor store. Clear differences emerged from the PCA calculations; furthermore, some differences could be seen directly by looking at and comparing raw spectra. In contrast to liquid chromatography, for the discussed methodology, sample preparation is not required; data acquisition and analysis are relatively simple and integrated. An automated and compact device (low cost UV-Vis spectrometers are widely available in the market) employing this method can be implemented in any distillery as an economical means of monitoring the production process of these white spirits. On the other hand, the utility of this method for other common categories of tequila and mezcal such as caramel-colored and aged spirits is the subject of further studies. It is necessary, for example, to determine if the compounds from barrels or caramel would interfere with the UV absorptions of the target compounds.
Conclusions
In summary, with HPLC the concentration and proportion of FUR, 5MF and 2AF in white tequilas and mezcals were measured. For the case of white tequilas, these compounds exhibited higher concentrations in 100% agave tequilas than in mixed tequilas. By comparing white type tequilas and mezcals, the average concentration of furanic content was higher in mezcals. In this work it is shown that similar results to those obtained by HPLC can be achieved by applying chemometric methods (PLS and PCA) to the UV-Vis absorption spectra of those spirits. The performed statistical study established no signiicant difference in the determination of the three analytes
in tequila samples and of FUR and 5MF in mezcals by using either PLS or HPLC methods. Therefore, the proposed PLS method may serve to achieve fast and reliable screening test results. A simple PCA calculation groups the beverages according to the corresponding furanic content and thus a good discrimination among the beverages is obtained. In contrast with chromatographic methods, the preliminary results obtained with the optical technique introduced in this study, in conjunction with multivariate calculations, imply that no sample preparation and no long analysis time are needed for identifying and quantify characteristic compounds of those two Mexican spirits with appellation of origin. Simple calculations are performed and results can be obtained within short times (near to 5 min). Furthermore, miniature spectrophotometers and software can easily be purchased in the market, so the method can be performed in situ at any distillery or laboratory as a fast screening technique. It is important to note that these studies can be realized with different white distilled beverages.
Acknowledgments
This work was partially supported by the State-Guanajuato-Council for Science and Technology, CONCyTEG, through grant 06-04-k117-106. Ana Celia Muñoz-Muñoz is a graduate student at Posgrado en Procesos Biotecnológicos, Universidad de Guadalajara, whose research has been inanced by Consejo Nacional de Ciencia y Tecnología CONACYT-México (grant 170940).
References
1. Mexican ministry of commerce and industry; Regulation, Alcoholic Drinks-Mezcal Specifications, NOM-070 SCFI; Diario Oicial de la Federación: México, 1994, pp. 30-41. 2. Mexican ministry of commerce and industry; Regulation,
Alcoholic Drinks-Tequila Specifications, NOM-006 SCFI; Diario Oicial de la Federación:México, 2005, pp. 26-47. 3. Wang, Y.; Chi-Tang, H.; J. Agric. Food Chem. 2008, 56, 11997.
4. Mangas, J. J.; Rodríguez, R.; Moreno, J.; Suarez, B.; Blanco, D.; J. Agric. Food Chem.1997, 45, 4076.
5. Crews, C.; Castle, L.; Trends Food Sci. Technol. 2007, 18, 365. 6. Adams, T. B.; Doull, J.; Goodman, J. I.; Munro, I. C.; Newberne,
P.; Portoghese, P. S.; Smith, R. L.; Wagner, B. M.; Weil, C. S.; Woods, L. A.; Ford, R. A.; Food Chem. Toxicol. 1997, 35, 739.
7. Ávila-Reyes, J. A.; Almaraz-Abarca, N.; Delgado-Alvarado, E. A.; González-Valdez, L. S.; Valencia, G.; Durán, E.; Food Res. Int.2010, 43, 296.
9. Benn, S. M.; Peppard, T. L.; J. Agric. Food Chem.1996, 44, 557.
10. Lachenmeier, D. W.; Sohnius, E. M.; Attig, R., López, M. G.;
J. Agric. Food Chem.2006, 54, 3911.
11. León-Rodríguez, A.; González-Hernández, L.; De la Rosa, A. P. B., Escalante-Minakata, P.; López, M. G.; J. Agric. Food Chem. 2006, 54, 1337.
12. Muñoz-Rodríguez, D.; Wrobel, K.; Wrobel, K.; Eur. Food Res. Technol. 2005, 221, 798.
13. Vallejo-Cordoba, B.; Gonzalez-Cordova, A.; Montoya, M. E.;
J. Agric. Food Chem. 2004, 52, 5567.
14. Dragone, G.; Mussatto, S. I.; Oliveira, J. M.; Teixeira, J. A.;
Food Chem.2009, 112, 929.
15. Ceballos-Magaña, S. G.; Jurado, J. M.; Martín, M. J.; Pablos F.; J. Agric. Food Chem.2009, 57, 1372.
16. Herrera, J.; Guesalaga, A.; Agosin, E.; Meas. Sci. Technol.2003, 14, 689.
17. Picque, D.; Lieben, P.; Corrieu, G.; Cantagrel, R.; Lablanquie, O.; Snakkers, G.; J. Agric. Food Chem.2006, 54, 5220. 18. Guillén, D.; Palma, M.; Natera, R.; Romero, R.; Barroso, C.;
J. Agric. Food Chem.2006, 53, 2412.
19. Urbano, M.; Luque de Castro, M.; Perez, P.; García-Olmo, J.; Gómez-Nieto, M.; Food Chem. 2006, 97, 166.
20. Sádecká, J.; Tóthová, J.; Májek, P.; Food Chem.2009, 117, 491.
21. Dias, L. G.; Veloso, A. C. A.; Correira, D. M.; Rocha, O.; Torres, D.; Rocha, I.; Rodrigues, R. L.; Peres, M. A.; Food Chem.2009, 113, 246.
22. Tewari, J. C.; Dixit, V.; Byoung-Kwan, C.; Malik, K. A.;
Spectrochim. Acta, Part A. 2008, 71, 1119.
23. López-de-Alba, P. L.; Wróbel-Kaczmarczyk, K.; Wróbel, K.; López-Martínez, L.; Amador-Hernández, J.; Anal. Chim. Acta 1996, 330, 19.
24. López-Martínez, L.; López-de-Alba, P. L.; García-Campos, R.; León-Rodríguez, L. M.; Anal. Chim. Acta2003, 493, 83. 25. Barbosa-García, O.; Ramos-Ortiz, G.; Maldonado, J. L.;
Pichardo-Molina, J. L.; Meneses-Nava, M. A.; Landgrave, J. E. A.; Cervantes-Martínez, J.; Spectrochim. Acta, Part A 2007, 66, 129.
26. Jones, G. R.; Deakin, A. G.; Spencer, J. W.; Meas. Sci. Technol. 2009, 20, 025304, doi:10.1088/0957-0233/20/2/025304; http:// iopscience.iop.org.
27. Jones, G. R.; Deakin, A. G.; Brookes, R. J.; Spencer, J. W.;
Meas. Sci. Technol. 2009, 20, 075305,
doi:10.1088/0957-0233/20/7/075305; http://iopscience.iop.org.
28. Lachenmeier, D.; Richling, E.; López, M.; Frank, W.; Schreier, P.; J. Agric. Food Chem.2005, 53, 2151.
29. Jolliffe, I. T.; Principal Component Analysis, Springer-Verlag: New York, 1986.
30. Geladi, P.; Kowlaski, B. R.; Anal. Chim. Acta 1986,185, 1.
31. MacKenzie, W. M.; Aylott, R. I.; Analyst2004, 129, 607. 32. Muñoz-Muñoz, A. C.; Grenier, A. C.; Gutiérrez-Pulido, H.;
Cervantes-Martínez, J.; J. Chromatogr., A2008, 1213, 218. 33. Brereton, R. G.; Analyst2000, 125, 2125.