Short Report
Printed in Brazil - ©2016 Sociedade Brasileira de Química 0103 - 5053 $6.00+0.00
*e-mail: [email protected]
Vitamin C Determination by Ultraviolet Spectroscopy and Multiproduct Calibration
Dayane A. Santos, Karen P. Lima, Paulo H. Março and Patrícia Valderrama*
Universidade Tecnológica Federal do Paraná (UTFPR), CP 271, 87301-899 Campo Mourão-PR, Brazil
In this work the vitamin C was determined in industrialized nectar juices through ultraviolet (UV) spectroscopy and multiproduct multivariate calibration, based on partial least squares (PLS) regression. Since samples with different flavors, sugar content (light or not) were together in the model construction, it can be considered as a multiproduct and, due to the heterogeneity of the samples, it was necessary to optimize the calibration and validation sets by outliers elimination. The model was developed and validated by the evaluation of the figures of merit such as: accuracy, sensitivity, analytical sensitivity, adjust, linearity, relative prediction deviation, limits of detection and quantification, indicating that the multiproduct model developed from UV spectroscopy and PLS regression can be used in the industrial routine analysis as an alternative to titration or other time and reagent consuming methods. Here, it was evidenced that the UV-PLS multiproduct model provides advantages as being free of sample preparation steps, is suitable to be updated in order to measure other parameters, does not generates residues and is feasible to be implemented for on-line monitoring. Furthermore, the application of multivariate calibration in multiproduct models is extremely attractive from the industrial point of view.
Keywords: vitamin C, UV spectroscopy, multiproduct calibration, PLS
Introduction
Vitamin C or L-ascorbic acid is an essential nutrient for human health,1 widely known for its potent antioxidant
properties. It can be used in high-doses and has being pointed out as presenting benefits in the treatment of Alzheimer’s disease.2 Among the multiple roles played
by this vitamin, its primary functions are to act as a cofactor for reactions requiring reduced iron or copper metalloenzyme and as a protective antioxidant which better reacts in aqueous phases, both intra- and extracellularly. Scientific evidences show that ascorbic acid plays an important rule on the corneal epithelium, the stroma and the endothelium, acting over the maintenance of its functions and ultra-structures.3 Furthermore, epidemiologic
studies have associated greater plasma vitamin C levels with reduced risk of chronic diseases, including cancer and cardiovascular disease, as well as higher physical performance in the elderly.4
The wide variety of ready-to-drink beverages has driven market to give special attention to it,5 and so, fruit nectar,
which is by definition a non-fermented ready-to-drink beverage, obtained from the edible part of the fresh fruit
diluted in water, in which may or not be added of sugars and acids. The preference for beverages classified as nectars has trend to grow due to its convenience and low price and, besides the wide range of flavors commercially available, has the possibility for being used in the production of low-calorie beverages (classified as light ones) in a feasible way to the industries. These low-calorie beverages are referred to the ones in which the sugars content, normally added in conventional beverages, are entirely replaced by natural or artificial sweeteners.6 In both cases, conventional or
low-calorie fruit nectars, vitamin C is used as a conserving reagent.
Nowadays, several methods based on high performance liquid chromatography (HPLC) have already being proposed in order to determine vitamin C content in beverages,7,8 and foods.9,10 Nonetheless, methods such as
capillary zone electrophoresis,11 and voltammetry have
being used to determine vitamin C in different samples, as pharmaceutical preparations and fresh fruit juice.12
Recently, ultra performance liquid chromatography (UPLC) and HPLC were proposed to determine vitamin C in beverages and vitamin tablets.13
about the chemical structures of the compounds due to chromophore absorptions.14 By ensuring this, the spectral
region can be analyzed with the aid of chemometric methods of multivariate calibration to quantify different constituents in samples such as beverages.14,15 Nonetheless,
the Association of Official Analytical Chemists,16 proposes
that, when vitamin C is found in low concentration, as in fruit juices, the Tillman’smethod is recommended. This method is based on the reduction of the 2,6-dichlorophenol indophenol by the vitamin C and was used in this research as reference method, which results were used for multiproduct multivariate calibration (i.e., only one multivariate calibration model to predict the same property of interest in different products) to UV spectroscopy in order to determine vitamin C content in industrialized nectar juices.
From these observations, the aim of the present study was to evaluate a multiproduct multivariate calibration model derived from UV spectroscopy to determine vitamin C in beverages from different fruit nectar. In this purpose, the model is a multiproduct because samples with different flavors and differing on sugar content (conventional and light) were together in the model construction.
The local calibration models of one-product have some disadvantages as a large number of computations required for each prediction in routine analysis, besides the fact that each specific calibration equation can only be used for a small population of samples and each sample must be clearly identified to be able to select the best prediction equation.14,17 In addition, maintenance of the one-product
multivariate calibration models can be as laborious as the multi-product ones. Thus, to save time on updates, it is worthwhile to investigate if multi-product models can be developed.14,18
Multiproduct multivariate calibration can be used to construct a multivariate calibration model from different products. In our case, juices of different flavors were used to provide a particular parameter, the vitamin C content. The early studies came from nineties decade,19,20
and the goals were evaluations of the performance of new algorithms. Posteriorly, in 2000 and 2006,17,18 the
multiproduct calibration was recovery but using non-linear calibration methods, which are not easily implemented in practical applications, such as routine analysis in industry. Recently, preliminary studies combining UV spectroscopy and linear method based on partial least squares (PLS) to construct multiproduct multivariate calibration model was proposed.14 In those study, vitamin C and carbohydrates
were determined in industrialized juices, but only yellow samples were employed to build the model. In another study the total acidity was evaluated in nectar juice, suggesting
the possibility to build multiproduct calibration models by the PLS regression method.6
Experimental
Samples and reagents
A total of 123 samples of fruit nectar were purchased in different Brazilian marketplaces. The flavors employed were: grape (9 samples), white grape (3 samples), light grape (6 samples), peach (9 samples), light peach (6 samples), pear (3 samples), strawberry (3 samples), passion fruit (9 samples), light passion fruit (3 samples), mango (9 samples), light mango (6 samples), apple (12 samples), lemon (3 samples), orange (12 samples), light orange (3 samples), guava (6 samples), light guava (6 samples), cashew (3 samples), light cashew (6 samples) and pineapple (6 samples). Table S1, in Supplementary Information, shows the sample compositions.
The following reagents were used for the Tillman’s method: ascorbic acid (Impex, Wood Dale, USA), 2,6-dichlorophenol indophenol sodium salt (Sigma-Aldrich, St. Louis, USA), indigo carmine (Sigma-(Sigma-Aldrich, St. Louis, USA), metaphosphoric acid, glacial acetic acid and hydrochloric acid (Vetec, Rio de Janeiro, Brazil), sodium bicarbonate, sodium hydroxide and potassium biphthalate (Alphatec, Macaé, Brazil), phenolphthalein 1% (Sigma-Aldrich, St. Louis, USA).
Tillman’s method
Initially, 3 solutions were prepared as follows: solution 1: acid solution, prepared by solubilizing 15 g of metaphosphoric acid in 40 mL of glacial acetic acid and then adding 450 mL of distilled water, being stirred and filtered; solution 2: vitamin C solution, prepared by solubilizing 100 mg of vitamin C, previously dried, in 100 mL of the solution 1 in a volumetric flask (100 mL) and then, diluted 10 times in the same acid solution; solution 3: Tillman’s solution, prepared by solubilizing 42 mg of sodium bicarbonate in 50 mL of distilled water, adding 50 mg of 2,6-dichlorophenol indophenol sodium salt was under stirring until total dissolution of the dye. Then, this solution was filtered and diluted in 200 mL of distilled water in a volumetric flask.
(solution 1) in order to calculate the Tillman’s factor (F) according to equation 1:
(1)
The titration of the fruit nectar was done by using 40 mL of filtered sample mixed with 40 mL of the solution 1. From this mixture it was taken 10 mL, which was then titrated with the Tillman’s solution. The vitamin C content was calculated through the equation 2:
(2)
where, V is the Tillman’s solution volume (mL) used in the titration, F is the Tillman’s factor and A is the sample volume (mL).
Tests were carried out to detect interferent ions as Fe2+,
Sn2+ and Cu2+. To this, two drops of methylene blue 0.05%
were added in 10 mL of a solution 1:1 (v/v), containing fruit nectar and solution 1.
Apparatus, software and multiproduct multivariate calibration
The spectra were obtained with an Ocean Optics spectrophotometer model USB-650 UV-VIS (Dunedin, USA) and using a 1 mm quartz cuvette. All spectra were obtained in the range from 200 to 400 nm (1 nm step) without any sample preparation. The spectra were obtained once the sample containers were opened, and then there was no storage. The data were treated in MATLAB version R2007b (The Math-Works, Natick, USA). The PLS calculations were carried out with the PLS-Toolbox version 5.2. The outliers detection and figures of merit calculations were carried out with a homemade program developed in the laboratory.
The PLS method has been discussed in detail in relevant references.21-23 In this case, the data matrix X was
constituted by the UV spectra of nectar fruit samples and the vector y contained the reference values for vitamin C content, obtained from the Tillman’s method. The model was developed with mean center pre-processing.
Sometimes, samples behaving different from the bulk of the data (outliers) can occur by different reasons, such as laboratory error, samples from another population, instrument error and others.22 In this research the outliers
were detect based on leverage,24 unmodeled residuals
in spectra,22,24 and unmodeled residuals in dependent
variables.22 The leverage and unmodeled residuals in spectra
and dependent variable were evaluated at the calibration
set, while the outliers were evaluated by the leverage and unmodeled residuals in spectra at the validation set, as suggested by American Society for Testing and Materials (ASTM E1655-05).24
It is not uncommon, when outliers are eliminated in a first model and the model is rebuilt, to find new outliers in this second model.25 In this research, it was also verified and
the outliers test was relaxed: (i) the first model was built on an initial calibration set; (ii) outliers were detected based on leverage, unmodeled residuals in spectra and dependent variables were removed; (iii) a second model was built, with the same variables latent number; (iv) outliers detected based on leverage, unmodeled residuals in spectra and dependent variables were removed from the second model; (v) a third model was built, with the same variables latent number; (vi) outliers in the validation set were evaluated.
The validation of the proposed multiproduct multivariate model was certified through the determination of figures of merit, such as, accuracy, linearity, sensitivity, analytical sensitivity, adjustment, limits of detection and quantification. The determination was done based on previous publications,25,26 and the equations were presented
in the Table 1.
The residual prediction deviation (RPD) was utilized to estimate the predictive ability of the model.27 This
parameter is more suitable for absolute comparisons and can be estimated for calibration (RPDcal) and validation
(RPDval) as shown in Table 1.
Results and Discussion
The calibration and validation data sets were composed by 94 and 29 samples, respectively, selected by the Kennard-Stone algorithm.28 According to this algorithm,
the first sample selected is the one with largest distance from the center of the data, and the next sample is the most far from the first sample, and so on, until completing the selected number of samples for the calibration set. In this way, Kennard-Stone algorithm was used within each group of samples to ensure that all flavors, light and conventional juices were well represented in calibration and validation sets. The Figure 1 shows the spectra of all samples in the spectral range used in the model development.
residuals in spectral data. This procedure resulted in 79 and 25 samples for calibration and validation, respectively.
Root mean square error of cross validation (RMSECV) was utilized to select the optimum model dimension. In this case, the minimum RMSECV for the calibration samples, obtained by contiguous block cross validation of
nine samples, result the choice of four latent variables for mean-centered model development. The figures of merit for the model are shown in Table 2.
Table 1. Equations 3 to 11 for figures of merit
Figure of merit Equation
Accuracy
nv 2 i i a i=1
ˆ (y – y ) RMSEP =
nv
∑
(3)
b
RMSEC =
nc – nVL + 1
nc 2 i i i=1
ˆ (y – y )
∑
(4)
Relative prediction deviation
c cal
cal
DP
RPD =
RMSECV (5)
d val
val
DP
RPD =
RMSEP (6)
Sensitivity sensitivity = 1e
b
|| || (7)
Analytical sensitivity δ
xf|
|| |
sensitivity
analytical sensitivity = (8)
Analytical sensitivity-1 analytical sensitivity =–1 1
analytical sensitivity (9)
Limit of detection limit of detection = 3.3δx || || = 3.3 xb δ 1
sensitivity (10)
Limit of quantification limit of quantification = 10δx || || =b 10δx 1
sensitivity (11)
aRMSEP = root mean square error of prediction, where nv is number of samples in the validation set; y
i is reference value of the sample i; ŷ is the predicted
value of the sample i; bRMSEC = root mean square error of calibration, where nc is the number of samples in the calibration set, y
i is reference value of
the sample i; ŷ is the predicted value of the sample i; nVL is number of latent variables. In the equation for RMSEC, the “+ 1” is added when the data are mean center; cRDP
cal = residual prediction deviation for calibration, where DPcal is the standard deviation of reference values in the calibration set;
RMSECV is root mean square error of cross validation; dRDP
val = residual prediction deviation for validation, where DPval is the standard deviation of
reference values in the validation set; eb = regression coefficients vector; fδx = estimate for the instrumental noise.
Figure 1. UV spectra of the industrialized nectar juices; (a) calibration data set; and (b) validation data set.
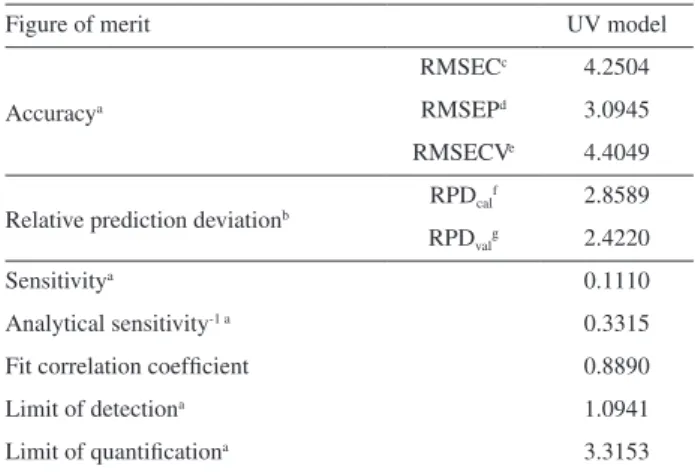
Table 2. Analytical figures of merit for the multiproduct PLS model
Figure of merit UV model
Accuracya
RMSECc 4.2504
RMSEPd 3.0945
RMSECVe 4.4049
Relative prediction deviationb RPDcal
f 2.8589
RPDvalg 2.4220
Sensitivitya 0.1110
Analytical sensitivity-1 a 0.3315
Fit correlation coefficient 0.8890
Limit of detectiona 1.0941
Limit of quantificationa 3.3153
aResults in mg per 100 mL-1; bdimensionless units; cRMSEC = root mean
square error of calibration; dRMSEP: root mean square error of prediction; eRMSECV = root mean square error of cross validation; fRDP
cal = residual
prediction deviation for calibration; gRDP
val = residual prediction deviation
Accuracy represented by root mean square error of calibration (RMSEC), root mean square error of prediction (RMSEP) and RMSECV showed that model dimension was properly chosen and the model was not over fitted. These parameters incorporate random and bias errors. Then, accuracy can also be represented by the fit of the reference values against the predicted ones and the slope, the intercept, correlation coefficient.26 Figure 2 shows the
fit of the multiproduct model, presented by plotting the reference values against the estimated values for vitamin C. The slope and intercept for this linear fit are also presented in the Figure 2, while the correlation coefficient is presented in Table 2. The correlation coefficient value, 0.8890, was considered satisfactory since previous research reported coefficient value around 0.7 when the reference method is the titration method.6,25,29
Residual prediction deviation (RPD) is the ratio of natural variation in the samples to the size of probable errors occurring during the prediction, and it is more useful for comparing models on different data sets or in absolute terms. It was calculated for the calibration and validation sets and presented values of 2.86 and 2.42 for calibration and prediction, respectively, which was above 2.4, the lower limit desired for calibration equations.30
The sensitivity, presented in Table 1, showed appropriate results taking into account the analytical range of the model (0.74-39.25 mg per 100 mL). However, because of the preprocessing used in PLS model development, the analytical sensitivity is more suitable for evaluate the sensitivity of an multivariate calibration method. Considering a perfect fit of the model and that the spectral noise represent the large source of error, the inverse of the analytical sensitivity (or analytical sensitivity-1) allows for
the establishment of a minimum concentration difference
which is discernible by the analytical method in the range of concentrations where it was applied.27 Based on this,
it is possible to distinguish samples with concentration difference of vitamin C of 0.33 mg per 100 mL.
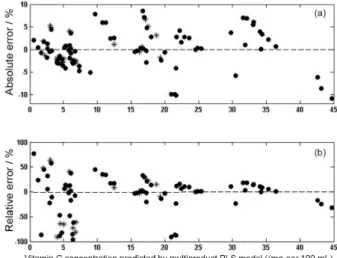
Residuals plot from calibration and validation samples are shown in Figure 3, and were used to evaluate linearity of the multiproduct model. The absolute and relative errors (most of samples around 20%) are randomly distributed. These results suggest that this data set fit on a linear model.22,27 To confirm the model linearity, Figure 4 show
the histogram for the student residuals whose distribution resemble a Gaussian behavior. The Jarque-Bera test confirm that the student residuals are normally distributed at 95% of confidence level.24,31
Limits of detection and quantification for the multiproduct model show results coherent with the measured quantities and the RMSEP obtained. The results obtained for the figures of merit showed that the proposed
Figure 2. Reference values against the values estimated by the PLS multiproduct model. Calibration samples (●); validation samples (∗).
Figure 4. Histogram of the student residuals.
method based on UV spectroscopy and multiproduct multivariate calibration is promising. Furthermore, the UV-PLS is a low cost, fast and sample preparation free methodology.
Conclusions
A method to determine vitamin C by UV spectroscopy and multiproduct multivariate calibration based on PLS is suitable to be constructed. The multiproduct model was optimized by outlier detection and it was validated by calculation of the figures of merit, showing promising results. The model showed an appropriate sensitivity capacity and values for accuracy, limits of detection and quantification, besides other figures of merit presented results which indicates that the multiproduct model developed by UV spectroscopy can be used in the industrial routine analysis as an alternative to titration or even others methods. By comparing with the traditional ones, the UV-PLS multiproduct model present advantages as no sample preparation, capacity for being updated to others parameters, is waste free and present possibilities for on-line monitoring.
Supplementary Information
Supplementary data are available free of charge at http://jbcs.sbq.org.br as PDF file.
Acknowledgments
The authors thank CAPES (Coordenação de Aperfeiçoamento de Pessoal de Nível Superior) for fellowship to Dayane A. Santos.
References
1. Sapei, L.; Hwa, L.; Procedia Chem.2014, 9, 62.
2. Murakami, K.; Irie, K.; Shimizu, T. In Diet and Nutrition in Dementia and Cognitive Decline; Martin, C. R.; Preedy, V., eds.; Academic Press: Kidlington, 2014, ch. 61.
3. Serra, H. M.; Suárez, M. F.; Espósito, E.; Urrets-Zavalía, J. A. In Handbook of Nutrition, Diet and the Eye; Preedy V., ed.; Academic Press: Kidlington, 2014, ch. 31.
4. Ishigami, A.; Yokoyama, T. In Aging: Oxidative Stress and Dietary Antioxidants; Preedy, V., ed.; Academic Press: Kidlington, 2014, ch. 12.
5. Zulueta, A.; Esteve, M.; Frasquet, I.; Frígola, A.; Food Chem.
2007, 103, 1365.
6. Santos, D. A.; Lima, K. P.; Março, P. H.; Valderrama, P.; Braz. J. Food Res. 2015, 6, 1.
7. Mattila, P. H.; Hellstrom, J.; McDougall, G.; Dobson, G.; Pihlava, J. M.; Tiirikka, T.; Stewart, D.; Karjalainen, R.; Food Chem. 2011, 127, 1216.
8. Valente, A.; Sanches-Silva, A.; Albuquerque, T. G.; Costa, H. S.; Food Chem. 2014, 154, 71.
9. Spínola, V.; Llorent-Martínez, E. J.; Castilho, P. C.; J. Chromatogr. A2014, 1369, 2.
10. Mazurek, A.; Jamroz, J.; Food Chem. 2015, 173, 543. 11. Chiari, M.; Nesi, M.; Carrea, G.; Righetti, P. G.; J. Chromatogr.
A1993, 645, 197.
12. Pournaghi-Azar, M. H.; Ojani, R.; Talanta 1997, 44, 297. 13. Klimczak, I.; Gliszczynska-Swiglo, A.; Food Chem. 2015, 175,
100.
14. Santos, D. A.; Março, P. H.; Valderrama, P.; Braz. J. Anal. Chem.
2013, 12, 495.
15. Martelo-Vidal, M. J.; Vázquez, M.; Food Chem. 2014, 158, 28. 16. Latimer, G. W.; Official Methods of Analysis of the Association of Official Analytical Chemistry, 15th ed.; AOAC: Arlington,
1990, vol. 2, p. 1058.
17. Berzaghi, P.; Shenk, J. S.; Westerhaus, M. O.; J. Near Infrared Spectrosc.2000, 8, 1.
18. Micklander, E.; Kjeldahl, K.; Egebo, M.; N∅rgaard, L.; J. Near Infrared Spectrosc.2006, 14, 395.
19. Naes, T.; Isaksson, T.; Appl. Spectrosc.1992, 46, 34. 20. Wang, Z.; Isaksson, T.; Kowalski, B. R.; Anal. Chem. 1994, 66,
249.
21. Geladi, P.; Kowalski, B. R.; Anal. Chim. Acta1986, 185, 1. 22. Martens, H.; Naes, T.; J. Chemometrics1989, 4, 441. 23. Brereton, R. G.; Analyst2000, 125, 2125.
24. ASTM E1655-05: Standards Practices for Infrared, Multivariate, Quantitative Analysis, Pennsylvania, 2005.
25. Valderrama, P.; Braga, J. W. B.; Poppi, R. J.; J. Agric. Food Chem.2007, 55, 8331.
26. Valderrama, P.; Braga, J. W. B.; Poppi, R. J.; Quim. Nova2009,
32, 1278.
27. Botelho, B. G.; Mendes, B. A. P.; Sena, M. M.; Quim. Nova
2013, 36, 1416.
28. Kennard, R. W.; Stone, L. A.; Technometrics1969, 11, 137. 29. Valderrama, P.; Braga, J. W. B.; Poppi, R. J.; J. Braz. Chem.
Soc.2007, 18, 259.
30. Piantavini, M. S.; Pontes, F. L. D.; Uber, C. P.; Stremel, D. P.; Sena, M. M.; Pontarolo, R.; Spectrochim. Acta, Part A2014,
125, 396.
31. Jarque, C. M.; Bera, A. K.; Int. Stat. Rev. 1987, 55, 163.
Submitted: November 28, 2015