Mechanism of Insulin Emission in Matrix
Assisted Laser Ionization
F. Fern´andez-Lima
1, V. M. Collado
2, C. R. Ponciano
2, L. S. Farenzena
2,
E. Pedrero
3, and E. F. da Silveira
2 1Instituto Superior de Tecnolog´ıas y Ciencias Aplicadas,
Ave Salvador Allende esq Luaces, s/n, CP 10600, Ciudad de la Habana, Cuba
2
Pontif´ıcia Universidade Cat´olica, CP 38071, Rio de Janeiro, 22452-970, Brazil
3
Physics Faculty-IMRE, University of Havana, Cuba
Received on 9 September, 2004
In the present paper the emission of intact insulin quasi-molecular ion [M+H]+
during laser ablation (MALDI) is studied. It was observed in particular that the insulin TOF molecular peak increases as the laser power increases. The DE-Vestal method for the initial velocity measurements was improved theoretically including the distance (d0)until the free expansion regime can be considered. According to the present analysis, thev0
parameter given by the DE-Vestal method is interpreted as the initial velocity that the desorbed ion would have if no collision occurs in the plasma. The improved method interpretsv0as the “final” initial velocity, i.e., as
the velocity that the desorbed ions have when the plasma free expansion starts and, effectively, collisions no longer occur. The new method allows also the determination ofd0, the distance to the solid when the free
expansion starts. The data fitting shows that the distance (d0)has a linear dependence on the laser’s intensity. Extrapolation of these values gives I = 0.69 G W cm−2as the minimum energy density necessary to produce
high density plasma during the insulin ions desorption when usingαCHCA matrix.
1
Introduction
Lasers have been used in the last three decades to produce high-temperature and high-density plasmas for fusion de-vices by vaporizing a small amount of material with high-powered nanosecond pulses. Great instrumental develop-ments have been accomplished in the last 15 years but there is still a lacking of a satisfactory understanding of the chemical-physical phenomena involved in laser ablation. One of the major applications of laser ablation in modern biological analysis is the matrix-assisted laser desorption/ ionisation mass spectrometry technique (MALDI-MS) [1,2]. As it is typical for the history of the desorption techniques, progress has been driven by the empirical experience, rather than by a more profound understanding of the underlying physical-chemical processes. In the early 1990’s, in or-der to provide first–oror-der correction for the initial distrib-ution of emitted ions, the delayed extraction (DE) technique was introduced to improve mass resolution and sensitivity in time-of-flight (TOF) mass spectrometry (MS) coupled with MALDI.
In a first set of experiments, the initial velocity of the MALDI ions has been thoroughly investigated and it was concluded that it is the superior tool to characterize the laser ablation of the MALDI process [3,4]. The importance of the initial velocity analysis of desorbed ions is twofold: i) the absolute value of the average initial velocity, in respect to practical performance of MALDI/DE-TOF systems, is needed for accurate calibration procedures, and ii) the width
of the velocity distribution is an important factor for mass resolution.
Numerous experiments on the velocity measurements of laser desorbed ions and neutrals and theoretical calculations have been reported [3-9]. Average initial velocities of sam-ple ions vary between 300 and 1000 m/s and between 300 and 1700 m/s for matrix ions. The effect of matrix substance and wavelength has been analyzed for several peptide, pro-tein and DNA samples up to 25000 u [3]; however, laser irra-diance influence has not been explored systematically. Most of these reports were carried out routinely at low irradiation regimes, and the initial velocity was considered as the first moment of the distribution of the velocity component in the TOF expansion. However, these considerations break down when the interaction of the desorbed ions in the plume is not negligible.
2
Theory
In linear two-stage acceleration TOF system, the initial ion velocity (vo) can be determined as an approximation
from the slope of the curve of flight time vs extraction delayed. For this purpose, flight times and their depen-dence on the delay time are measured and an analytical so-lution/approximation of the flight time equation is used to determinevo(DE-Vestal method [3,11,12]).
Briefly, the time-of-flight (TOF) equations can be writ-ten as functions of the two grid distances (d1andd2), the field free drift length (L), the delay time (τ), the sample tar-get potentials (U0andU1:initiallyU0switches intoU1after the delay time τ), the first grade potential (U0), the mass (m)and the charge (q) as follows:
T OF(τ, v0) =T OF(0,0) +τ+
η τ−2d1 vR v 0 vR +
τ−ηd1 vR v 0 vR 2 (1)
whereη=R√R L
2d1+
R
1+√R
d2
d1−1,vR=
2q
m(U1−U0)
andR = U1−U0
U1 .
TOF(0,0) is the time of flight for an ion “emitted” with v0= 0 and extracted promptly (τ= 0):
T OF(0,0) = d1
vR/2 + d2
vR/2
√
R
1 +√R
+ L
vR
√
R. (2)
which represents the sum of time intervals that the ion takes to travel the distancesd1,d2andLrespectively.
Assuming τ << d1/v0, v0 << vR and considering
the plot TOF(τ,v0)−τ versusτ, the slope of the function (d(T OF −τ)/dτ)can be written as:
d(T OF −τ)
dτ =η v0
vR = v0
vref
(3)
wherevref =vηR = 1
R3/2 L
2d1+ R 1+√R
d2 d1−1
2q
m(U1−U0)
Although the width and overall shape of the velocity dis-tribution are equally important parameters in any theoretical understanding of the plume expansion process, the above DE-Vestal method does not allow separation of these para-meters [13].
One sees from equation (3), that the initial velocityv0of the desorbed ions can be determined from the measurements of the slope d(T OF −τ)/dτ. In fact, the distributions of the slope of each part of the TOF peak allow, in principle, the determination of the initial velocity distribution.
Methods relying on the measurement of the drift veloc-ity in a field-free region are very sensitive to residual electric fields. Penetration of the accelerating field into the field-free zone leads to an overestimate of the initial velocity. The ef-fect of the residual field is function of(m/q)−1so it is less important at high mass-to-charge ratio, but it can cause sub-stantial errors for low mass-to-charge ratio.
In a higher order approximation, the shape of the veloc-ity distribution should also be taken into account. At short
extraction delays, the ions may have not reached their “fi-nal” initial velocity and collisions with neutrals can slow ions down. The time lag, until a free expansion regime can be considered, has been estimated from hydrodynamic cal-culations to be about 50-100 ns [14]. Therefore, the time lag also depends on the laser irradiance due to the substantial interaction between ions and neutrals.
In order to estimate the volume occupied by this ini-tially expanding and interacting system, as function on the laser irradiance, a new parameter,d0, can be introduced into the equation (1): the lengthd0corresponds to the distance travelled by the desorbed ions until their velocity becomes constant (“final” initial velocity). Once the free expansion regime is reached, their “final” initial velocity is considered as the new “initial” velocity for the movement described by the equation (1). The “final” initial velocities of the plasma ions were calculated by the code TOF12 [10], developed by the authors, taking into account the leakage field effect in-fluences on the ion dynamics inside the spectrometer.
3
Experimental
I) Instrumentation
Experiments were performed in a two-acceleration re-gion linear mass spectrometer equipped with a delayed field extraction system. A pulsed-nitrogen laser radiation (337 nm) is brought into focus on the target with a 30oincidence
angle.
The ions are detected with a microchannel plate (ion-electron conversion) and the delivered signals are digital-ized at a rate of 500 MHz by a Tektronix TD520 digitizing oscilloscope (2 ns resolution). The ion extraction region is composed of two stages, each one ending by a 90 % trans-mission grid. The drift tube length L is 276.5±0.1 mm and the distanced2from the first to the second grid is 20.0±0.1 mm. (See Fig. 1).
d1 d2 L
TABLE 1. Comparison of DE-Vestal method with the improved new method results.
Laser intensity in [G W cm−2]
DE-Vestal method initial velocity [m/s]
“Final” initial velocity [m/s]
Expansion distance d0
[µm]
0.9 404±122 362±110 50.0±15
1.1 643±95 573±85 75.0±11
1.3 633±35 576±32 115.0±6
1.5 442±196 414±184 180.0±20
The distanced1 from the target to the first grid is 2.43
±0.1 mm. The delayed extraction was set in such way that the target voltage is held to a potential ofU0i = 10.99 kV
before the application of the ion extraction pulse and then switched toU1=12.50 kV (U0iwas a correction of the
leak-age field influences). The first grid potential is permanently held atU0= 11.00 kV and the second grid is grounded. The extraction field was trigger using the laser pulse photo de-tector signal. Each spectrum represents ten-shot average ac-quisition. The delayed time was varied from 300 to 600 ns, and the laser pulse intensity was varied from 0.9 to 1.5 G W cm−2.
II) Sample preparation
For the standard dried droplet method preparation, sam-ples were prepared by applying 10µL ofαCHCA matrix so-lution plus 1µL of insulin (Sigma) solution on a stainless-steel sample plate. Matrix solution was 10 mg/mL of 4-Hydoxy-α-cyanocinnamic acid in a mixture of acetonitrile / water (7:3 v/v). Analyte concentration was 0.1mg/mL in 0.3% Trifluoroacetic acid (TFA) aqueous solution.
4
Results and Discussion
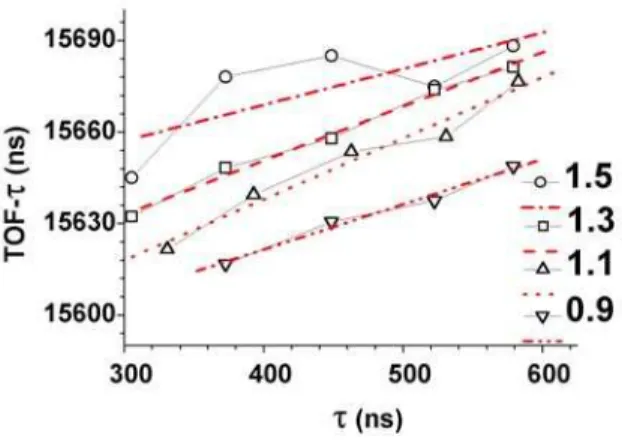
In the present section, mechanisms involved in the matrix-analyte ablation and emission yields as a function of the laser irradiance are discussed. An important point, in order to evaluate the initial velocity using the DE-Vestal method, is the criterion for choosing the reference point of the TOF peak ions signal in the case of MALDI-DE-TOF. In a pre-vious work, the evolution of the peak shape for an initial Gaussian like velocity distribution was analyzed as function of the delayed time and the experimental spectrometer con-ditions [15]. In order to determine the initial velocity by the DE method, the peak centroide was considered the ref-erence point for the TOF value, and FWHM the TOF peak centroide error. Fig. 2a shows the experimental spectra of the insulin ion (M+H)+
for the case of 1.3 G W cm−2laser intensity and its correspondent maximum and centroide evo-lution. One sees that no dramatic changes occur in the peak shape as the extraction field is delayed. Most of the TOF peak shift is merely due toτ, the time interval between the laser shot and the application of the external electric field to extract the ions. The time difference between the TOF peak shift andτ, TOF-τ, is the relevant quantity that allows the
v0determination.
15,6 15,9 16,2 16,5 16,8 17,1 0,05
0,10 0,15 0,20 0,25
S
ig
n
a
l I
n
te
n
s
it
y
(
a
.u
.)
TOF (µµµµs)
Laser Intensity 1.3 G W cm-2
τ τ τ τ (ns)
583 531 463 393 331
Figure 2. (a) The experimental spectra of the insulin ion (M+H)+
for the case of 1.3 G W cm−2 laser intensity. (b) The maximum
and the centroide evolution of the TOF peak for different applied delayed extraction time,τ.
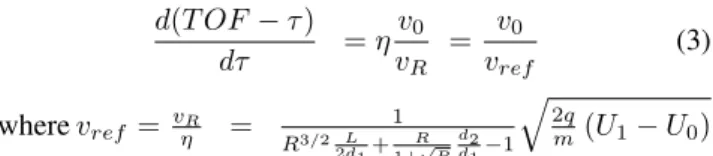
Figure 3. The flight time (TOF -τ)vs extraction delayed time (τ)
for the different applied irradiances. The laser intensity values are given in [G W cm−2].
Figure 4. Starting point (d0distance) for the consideration of the “final” initial velocity as function of the applied laser intensity.
The DE-Vestal method for initial velocity lead to values which are larger than the “final” initial ones, because equa-tion (1) does not take into account that ions cannot be accel-erated by the external field while the plasma density is too high. The two values reported in the literature [3,4] (there is no reference to the applied irradiance) are lower than the one presented here (both are∼311 m/s, very close to that cor-responding to our lowest applied irradiance). Thed0values
grow linearly as function of the laser applied intensity (at a rate of 194) as shown in Fig. 4. Extrapolation of these val-ues gives I = 0.69 G W cm−2as the minimum energy density
necessary to produce high density plasma during the insulin ion desorption withαCHCA as matrix. Note that, when us-ing lesser than I = 0.69 G W cm−2(which impliesd0= 0),
the DE-Vestal method and the new method presented here are equivalent, i.e. predict the same “final” initial veloc-ity value. There are no significant differences in the “final”
initial velocities values (I = 1.1-1.3 G W cm−2)up to the
highest applied laser irradiance (I = 1.5 G W cm−2)when
the effect of kinetic energy loss is clearly seen. We have also observed that, for laser irradiances higher than 1.5 G W cm−2, the collision effects are responsible for the
reduc-tion of the insulin (M+H)+ ions signal, till the production
of the TOF signal is completely extinguished for laser inten-sities larger than 1.6 G W cm−2. The energy incorporated
with the increase in laser irradiance reverts in collisions, de-sexcitations and fragmentations of the insulin (M+H)+ions.
Further studies of insulin (M+H)+ions stability or
neutral-ization as function of temperature could reveal more infor-mation of the ablation of this kind of systems.
5
Conclusions
The emission of intact insulin ion molecules during laser ablation (MALDI) is studied. It was observed in particular that the insulin TOF of the molecular peak increases as the laser power increases. The DE-Vestal method for the ini-tial velocity measurements was improved theoretically with the inclusion of the distance (d0)in the TOF equation,
treat-ing the free expansion regime correctly. Accordtreat-ing to the present analysis, thev0parameter given by the DE-Vestal
method is interpreted as the initial velocity that the desorbed ion would have if no collision occurs in the plasma. The im-proved method interprets v0as the “final” initial velocity,
i.e., as the velocity that the desorbed ions have when the plasma free expansion starts and, effectively, collisions no longer occur. The new method allows also the determina-tion ofd0, the distance to the solid when the free expansion
starts. The data fitting shows that the distance (d0)has a
linear dependence on the laser’s intensity. Extrapolation of these values gives I = 0.69 G W cm−2as the minimum
en-ergy density necessary to produce high density plasma dur-ing the insulin ions desorption when usdur-ingαCHCA matrix.
6
Acknowledgments.
The authors acknowledge the Centro Latinoamericano de F´ısica, FAPERJ and CNPq for the partial support of this work.
References
[1] M. Karas, F. Hillenkamp, Anal. Chem.60, 2299 (1988). [2] K. Tanaka, Y. Ido, S. Akita, Y. Yoshida, and T. Yoshida, Rap.
Comm. in Mass Spec.2, 155 (1998).
[3] P. Juhasz, M. L. Vestal, and S. A. Martin, J. Am. Soc. Mass Spectrom.8, 209 (1997).
[4] M. Gl¨uckmann, M. Karas, J. Mass Spectrom.34, 467 (1999). [5] R. C. Beavis, B. T. Chait, Chem. Phys. Lett.181, 479 (1991).
[6] T. Huth-Fehre, C.H. Becker, Rapid. Commun. Mass Spec-trom.5, 378 (1991).
[8] V. B¨okelmann, B. Spengler, and R. Kaufmann, Eur. Mass Spectrom.1, 81 (1995).
[9] T. W. D. Chan, I. Thomas, A. W. Colburn, and P. J. Derrick, Chem. Phys. Lett.222, 579 (1994).
[10] V. M. Collado, PhD Dissertation, Catholic University of Rio de Janeiro, 2001.
[11] P. Juhasz, M. T. Roskey, I. P. Smirnov, L. A. Haff, M. L Vestal, and S. A. Martin, Anal. Chem.68, 941 (1996).
[12] M. L. Vestal, P. Juhasz, and S. A. Martin. Rap. Comm. in Mass Spec.9, 1044(1995).
[13] M. Gl¨uckmann, M. Karas, J. Mass Spectrom.34, 467 (1999).
[14] A. Vertes, G. Irinyi, R. Giijbels. Anal. Chem. 65, 2389 (1993).