Effects of visual and auditory stimuli in a choice reaction
time task
Viviane Freire Bueno, Luiz Eduardo Ribeiro-do-Valle
Universidade de São Paulo, São Paulo, SP, Brazil
Abstract
The effect produced by a warning stimulus(i) (WS) in reaction time (RT) tasks is commonly attributed to a facilitation of sensorimotor mechanisms by alertness. Recently, evidence was presented that this effect is also related to a proactive inhibition of motor control mechanisms. This inhibition would hinder responding to the WS instead of the target stimulus (TS). Some studies have shown that auditory WS produce a stronger facilitatory effect than visual WS. The present study investigated whether the former WS also produces a stronger inhibitory effect than the latter WS. In one session, the RTs to a visual target in two groups of volunteers were evaluated. In a second session, subjects reacted to the visual target both with (50% of the trials) and without (50% of the trials) a WS. During trials, when subjects received a WS, one group received a visual WS and the other group was presented with an auditory WS. In the irst session, the mean RTs of the two groups did not differ signiicantly. In the second session, the mean RT of the two groups in the presence of the WS was shorter than in their absence. The mean RT in the absence of the auditory WS was signiicantly longer than the mean RT in the absence of the visual WS. Mean RTs did not differ signiicantly between the present conditions of the visual and auditory WS. The longer RTs of the auditory WS group as opposed to the visual WS group in the WS-absent trials suggest that auditory WS exert a stronger inhibitory inluence on responsivity than visual WS.
Keywords: temporal expectancy; proactive inhibition; visual warning; auditory warning; reaction time.
Received 20 June 2012; received in revised form 24 November 2012; accepted 28 November 2012. Available online 28 December 2012.
Viviane Freire Bueno and Luiz Eduardo Ribeiro-do-Valle, Laboratory of Research in Psychophysiology, Department of Physiology and Biophysics, Biomedical Sciences Institute, São Paulo, University of São Paulo, SP, Brazil. Correspondence regarding this article should be directed to: Viviane Freire Bueno, Avenida Prof. Lineu Prestes 1524, Departamento de Fisiologia e Biofísica, Instituto de Ciências Biomédicas, Universidade de São Paulo, São Paulo, SP 05508-000, Brazil. Phone: +55 11 30917364. E-mail: [email protected]
Introduction
Several studies have demonstrated that the presentation of a spatially noninformative stimulus, usually called a warning stimulus(i) (WS), reduces reaction time (RT) to a subsequently presented target stimulus (TS; for review, see Niemi & Näätänen, 1981). This effect is commonly attributed to the alertness produced by the WS (Posner, Nissen, & Klein, 1976). Alertness may be thought to involve two very different processes—arousal and temporal expectancy—that can be mobilized independently (Del Fava & Ribeiro-do-Valle, 2004; see also Weinbach & Henik, 2012). Arousal is a process that increases the general excitability of
brain circuits (for a clear deinition of arousal, see
Coull, 1998; Gazzaniga, Ivry, & Mangun, 1998). It
occurs immediately after the WS and has a relatively short duration. Temporal expectancy is most commonly
referred to as a process that induces a time-dependent
increase in the excitability of a speciic sensorimotor circuit (Jennings, Van der Molen, & Steinhauer, 1998; Miller, & Anbar, 1981; Sanders, 1966; Sullivan,
Urakawa, & Cossey, 1996; Van der Heijden, 1992). It strongly depends on the relative probability of the occurrence of a relevant event at each moment.
Three recent studies presented evidence that a WS can also cause a reduction of basal responsivity. Squella (2007) showed that simple RT is longer when a spatially noninformative visual prime stimulus is presented 100 ms before the target stimulus in all trials of the session than when it is never presented in the session. Jaffard, Benraiss, Longcamp, Velay, & Boulinguez (2007) and Boulinguez, Ballanger, Granjon, & Benraiss (2009) showed that simple RT is much longer in visual WS-absent trials that are mixed with visual WS-present trials within the same block than in visual WS-absent trials that occur alone in a separate block.1
1The TS used by Jaffard et al. (2007) and Boulinguez et al.
(2009) consisted of the letter “X,” which occurred randomly 10
degrees to the left and right of the ixation point. This TS was
not presented in 20% of the trials to reduce the occurrence of premature responses. In one block of trials, only the TS was presented. In another block of trials, the TS was always preceded by a WS represented by two peripheral squares centered 10
1 (Continuation) In yet another block of trials, the TS was presented
alone in half of the trials and preceded by the WS in the other half of the trials. The asynchrony between the onset of the WS and the onset of the TS varied from 100 to 1100 ms in 100-ms increments in the study by Jaffard et al. (2007) and from 100 to 500 ms in 200-ms increments in the study by Boulinguez et al. (2009). The intertrial interval varied continuously between 3100 and 3600 ms in both studies. From the 300-ms stimulus onset asynchrony onward, reaction time was several tenths of milliseconds longer in the WS-absent trials of the mixed block than in the WS-present trials of this block or the WS-absent and WS-present trials of the pure blocks, which did not differ among themselves.
range of WS onset–TS onset asynchronies (i.e., stimulus onset asynchrony [SOA]) was used.
Methods
Participants
Eighteen male and six female undergraduate students (mean age ± SD, 22 ± 1 years) were tested. They were divided into two groups—the visual WS group and auditory WS group—consisting of 12 individuals each. All subjects had normal or corrected-to-normal vision and normal audition as determined by a visual acuity test performed on each eye and auditory sensitivity test performed on each ear. No subject was aware of the purpose of the study, and none of the subjects had previous experience with RT tasks. Written informed consent was obtained from all participants. This study was approved by the Ethics Committee of the Biomedical Sciences Institute of São Paulo University.
Materials
The participants were tested in a dimly illuminated (< .1 cd/m2) and sound-attenuated room. Subjects sat at
a table with their head positioned in a chin and forehead rest. A 17-inch cathode-ray-tube video monitor (refresh rate, 60 Hz; screen resolution, 640 × 480 pixels) and two speakers, one on each side of the video monitor (60 cm center to center) were mounted on a frame over the table. The center of the monitor’s screen was 57 cm away at eye level. The front of each speaker was 88 cm from the corresponding ear. The monitor was dark gray, and its luminance was 8.7 cd/m2. The participants were instructed to keep their eyes on a white ixation
point (75.5 cd/m2 luminance) at the center of the
screen and to respond to visual TSs presented on the left or right side of the screen by pressing left- or right-side keys located on the table. The TS could be
preceded by a lash of a thin region around the border
of the screen (visual WS) or a tone emitted by both speakers (auditory WS). A computer controlled by
a protocol developed using MEL Professional v. 2
software (Psychology Software Tools, USA) generated the stimuli and recorded the responses. The use of
sensitive microswitches (Microsoft, USA) as response
keys and a game port of a sound card (SoundBlaster, USA) to provide input from the response keys to the computer provided 1-ms time precision for response latency measurements.
Procedure
Upon arrival in the laboratory, the participants were randomly divided into two groups. Each participant completed two test sessions on separate days, not more than 7 days apart. These sessions lasted ~40 min. Before each session, the participant received a brief written description of the testing protocol. A more detailed oral explanation was provided in the testing room after the
participant was shown the ixation point, WS, TS, and
The neuroimaging and electrophysiological evidence presented by Jaffard et al. (2007) and Boulinguez et al. (2009), respectively, indicated the occurrence of the proactive inhibition of response triggering (i.e., tonic inhibition of motor control mechanisms) in blocks in which WS-absent and WS-present trials are mixed. According to these authors, this type of strategy would be adopted by the participants to avoid responding to the WS. The conclusions of these two studies should be applicable to both visual WS and WS of other modalities such as audition.
Auditory WS tend to inluence responsivity more
than visual WS. For example, Bertelson & Tisseyre (1969) and Davis & Green (1969) described a slightly larger decrease in RT after auditory WS than after visual
WS. Posner et al. (1976) reported a signiicant decrease
in RT after an auditory WS and no RT change after a
visual WS. More recently, Fernandez-Duque & Posner
(1997) reported a decrease in RT after an auditory WS that was twice the decrease produced by a visual WS.
The larger behavioral effects of auditory WS than visual WS suggest that the auditory modality has a greater ability to mobilize the alertness process. Unknown, however, is whether the auditory modality also has a greater ability to mobilize the proactive inhibition of the response triggering process. The present study examined this possibility.
The behavioral effects of visual and auditory WS were compared using the mixed-block design and choice RT task. The comparison of RTs in visual WS-absent trials and auditory WS-absent trials would indicate the relative ability of the two modalities to mobilize the proactive inhibition of the response triggering process.
More speciically, a longer RT in the auditory
WS-absent trials than in the visual WS-WS-absent trials would indicate that the auditory WS is more able to mobilize this process than the visual WS. The comparison of the facilitatory effects produced by the auditory WS and visual WS (represented in each case by the difference between the RTs in the WS-present and WS-absent trials) would indicate the relative ability of the two modalities to mobilize the alertness process. A larger effect for the auditory WS than for the visual WS would
conirm the previous reports that the former WS is more
able to mobilize this other process than the latter WS. To ensure that the results are not related to the strength of the proactive inhibition of response triggering or strength of
response keys. The participant then performed several practice trials.
The irst session determined the baseline performance
levels of the two groups of participants in the discrimination task. It consisted of six blocks of 48 trials. Each trial began
with the appearance of the ixation point. After 1850–2350 ms plus a ixed interval of 50, 100, 200, 400, 800, or 1600
ms, depending on the block, the TS appeared 1.4 degrees
to the left or right of the ixation point. This stimulus
was either a circle (2.4 degree diameter and .04 degree
thickness) or ellipse-like igure (two 2.4 degree arcs of
a circle; 5.0 degree diameter and .04 degree thickness).2
Both stimuli were light gray, had 34.8 cd/m2 luminance,
and lasted 100 ms. Each of the four conditions (i.e., a TS
represented either by a circle or an ellipse-like igure and appearing either to the left or right of the ixation point)
occurred 12 times in random order during each block of
the irst session.
The participants were instructed to respond with the left hand to TS that appeared on the left side of the screen and respond with the right hand to TS that appeared on the right side of the screen, regardless of the shape of the TS. The trial ended with a message that lasted 200
ms at the site of ixation. The message consisted of the
participant’s RT in milliseconds when the participant responded between 150 and 1000 ms after TS onset. The word “anticipated” was displayed when the participant responded less than 150 ms after TS onset, and the word “slow” was displayed when the participant responded more than 1000 ms after TS onset. The word “incorrect” was displayed when the participant responded with the wrong hand. RT was presented in blue and error messages were presented in red. The next trial began immediately after the disappearance of the message. Error trials were repeated.
The second session consisted of six blocks of 96 trials. In half of the trials in each block, the conditions
were exactly the same as in the irst session. In the
other half of the trials, the TS was preceded by the WS. For one group of participants (visual WS group), the WS was an empty gray rectangle (15.5 degrees wide, 11.5 degrees high, and .04 degrees thick) with 23.2 cd/m2 luminance that lasted 50 ms. This stimulus was perceived by the participants as a licker of the
screen. For the other group of participants (auditory WS group), the WS was a 300-Hz pure tone (sine wave, nonharmonic, with intensity >20 dB) with an intensity of 57 dB sound pressure level (SPL; 15 ms linear onset and offset ramps) and a duration of 50 ms. This stimulus was perceived by the participants as a low-pitched click. Trials with and without WS occurred in random order. The asynchrony between the onset of the WS and onset of the TS (SOA) varied by block; delays of 50, 100, 200, 400, 800, and 1600 ms occurred uniformly for one block each. The order of these SOA blocks was
balanced across participants. After correct responses, a blue asterisk appeared on the screen; after incorrect responses, a red asterisk appeared on the screen. The next trial began immediately after the disappearance of
the message. Similar to the irst session, error trials were
repeated.
Data analysis
The data acquired during both sessions were
analyzed. Mean RTs were calculated for each participant
and each condition. Slow responses and wrong hand responses were also tallied for each participant and each condition. A mixed design repeated-measures analysis of variance (ANOVA) was performed on RT data obtained during each session. The ANOVA of the data
of the irst session used group assignment (visual WS
or auditory WS) as the between-subjects factor and the
ixed interval value (50, 100, 200, 400, 800, or 1600 ms)
plus the 1850- to 2350-ms interval values as the within-subjects factor. The ANOVA of the data of the second session used group assignment (visual WS or auditory WS) as the between-subjects factor and SOA value (50, 100, 200, 400, 800, or 1600 ms) and WS occurrence (absent or present) as the within-subjects factors. When appropriate, data were further analyzed using the Newman-Keuls test; p-value ≤ .05 was adopted as the signiicance threshold in all of the tests.
Results
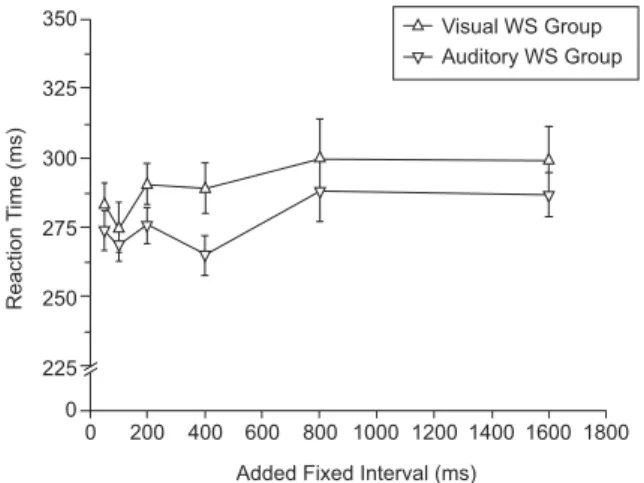
Figure 1 depicts the mean RTs of both the visual
WS and auditory WS groups across the six ixed interval values during the irst session. The pattern of results
yielded a main effect of SOA (F5,110 = 4.74, p < .01) but not group (F1,22 = 1.47, p = .24). Mean RT was longer for
the 800 ms SOA than for the 50, 100, and 400 ms SOAs (p = .04, p < .01, and p = .04, respectively) and longer for the 1600 ms SOA than for the 50, 100, and 400 ms SOAs (p = .03, p < .01, and p = .04, respectively). No group × ixed interval interaction was found (F5,110 = 0.55, p = .74).
2Target stimuli with two shapes were used to allow comparisons
between the indings of the present study and the inding of future studies on the inluence of WS on shape discrimination.
0 200 400 600 800 1000 1200 1400 1600 1800 Added Fixed Interval (ms)
Reaction
T
ime (ms)
350
325
300
275
250
225 0
Visual WS Group Auditory WS Group
Figure 2 depicts the mean RTs of both the visual WS and auditory WS groups in the WS-absent and -present conditions and across the six SOA values during the second session. The pattern of results yielded main effects of SOA (F5,110 = 11.34, p < .01) and WS occurrence (F1,22 = 80.71, p < .01). Mean RT was longer
for the 800 ms SOA than for the 100 and 200 ms SOAs (p < .01 and p = .02, respectively) and longer for the 1600 ms SOA than for the 50, 100, 200, 400, and 800 ms SOAs (p < .01 in all cases). Mean RT was shorter for the
WS-present trials than for the WS-absent trials. A group × WS occurrence interaction was found (F1,22 = 23.85, p
< .01). The post hoc analysis related to this interaction demonstrated that mean RT was shorter when the visual WS was present than when it was absent (p = .02) and when the auditory WS was present than when it was absent (p < .01). Mean RT was longer when the auditory
WS was absent than when the visual WS was absent (p = .04), but mean RT did not differ between the conditions in which the auditory WS was present and the condition in which the visual WS was present (p = .87). An SOA × WS occurrence interaction was found (F5,110 = 2.95, p
= .02). The post hoc analysis related to this interaction
demonstrated that mean RT was shorter when the WS was present than when it was absent for the six SOAs (p = .04 for the 50 ms SOA and p < .01 for the other SOAs). No interactions between group, SOA, and WS occurrence were found (F5,110 = 1.05, p = .39).
Tables 1 and 2 in the Appendix show the mean RTs
in all of the conditions in the irst and second sessions
for each group of participants. Tables 3 and 4 in the Appendix show the complete results of the ANOVAs
performed on the data of the irst and second sessions
plus the corresponding effect sizes.
A difference was observed between performance in the visual and auditory WS groups in the
WS-absent conditions of the second session. To conirm
that this difference was caused by the occurrence of the WS in this session and not simply attributable to an intrinsic difference in responsivity between groups, analyses of covariance (ANCOVAs) were performed on RTs collapsed across the six SOA values using the
RTs obtained in the irst session as a covariate. The
results of these additional analyses were analogous to those described above. In the WS-absent condition, a difference in RT was found between the visual WS and auditory WS groups (F1,21 = 5.63, p = .03), but no
signiicant difference was found between these groups
in the WS-present condition (F1,21 = .46, p = .51). In both conditions, the slope of the regression lines that related
RTs in the second session to RTs in the irst session did not differ signiicantly between groups.
Errors were relatively rare. During the visual WS
group’s irst session, anticipations, inversions (wrong
hand responses), and omissions occurred in 15 (.43%), 20 (.57%), and 0 (.00%) trials, respectively. During the
irst session of the auditory WS group, anticipations,
inversions, and omissions occurred in 14 (.40%), 25 (.71%), and 6 (.17%) trials, respectively. During the second session of the visual WS group, anticipations, inversions, and omissions occurred in 22 (.31%), 63 (.90%), and 2 (.03%) trials, respectively. During the second session of the auditory WS group, anticipations, inversions, and omissions occurred in 26 (.37%), 57 (.81%), and 9 (.13%) trials, respectively. Kolmogorov-Smirnov test did not show any difference between groups
Reaction T ime (ms) Reaction T ime (ms) 350 325 300 275 250 225 350 325 300 275 250 225 0 0 0 0 200 200 400 400 600 600 800 800 1000 1000 1200 1200 1400 1400 1600 1600 1800 1800 Stimulus Onset Asynchrony (ms)
Stimulus Onset Asynchrony (ms) Visual WS Absent Visual WS Present
Auditory WS Absent Auditory WS Present
Figure 2. Mean (±SEM) reaction time of the visual warning stimulus group and auditory warning stimulus group in the warning stimulus absent and present trials across the six stimulus onset asynchronies in the second session.
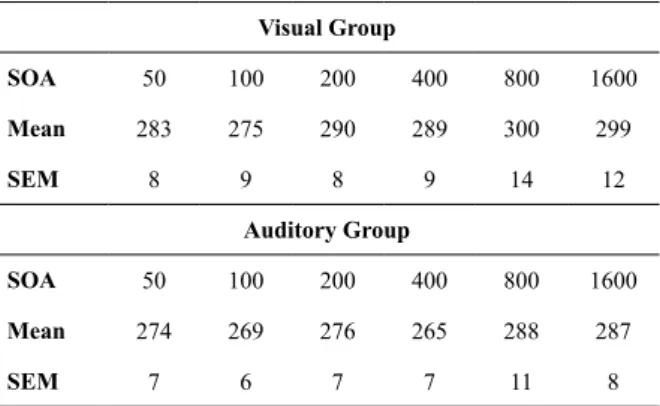
Table 1. Mean (±SEM) reaction times of the visual and auditory warning stimulus groups in the irst session for the six stimulus onset asynchronies (SOA)
Visual Group
SOA 50 100 200 400 800 1600
Mean 283 275 290 289 300 299
SEM 8 9 8 9 14 12
Auditory Group
SOA 50 100 200 400 800 1600
Mean 274 269 276 265 288 287
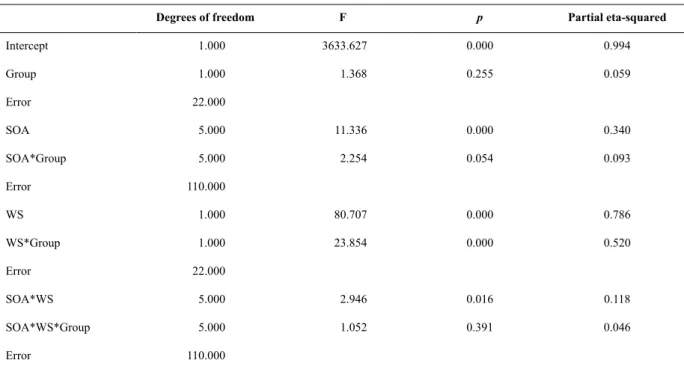
Table 4. Results of the ANOVA performed on the data of the second session
Degrees of freedom F p Partial eta-squared
Intercept 1.000 3633.627 0.000 0.994
Group 1.000 1.368 0.255 0.059
Error 22.000
SOA 5.000 11.336 0.000 0.340
SOA*Group 5.000 2.254 0.054 0.093
Error 110.000
WS 1.000 80.707 0.000 0.786
WS*Group 1.000 23.854 0.000 0.520
Error 22.000
SOA*WS 5.000 2.946 0.016 0.118
SOA*WS*Group 5.000 1.052 0.391 0.046
Error 110.000
Note: The effect size (partial eta-squared) for each term is also shown.
Table 2. Mean (±SEM) reaction times of the visual and auditory warning stimulus groups in the second session for the six stimulus onset asynchronies (SOA) and the warning stimulus (WS) absent and present (respectively, A and P) conditions
Visual Group
SOA 50 100 200 400 800 1600
WS A P A P A P A P A P A P
Mean 273 275 273 266 282 267 283 271 285 279 291 282
SEM 7 8 7 6 8 9 9 8 9 8 8 7
Auditory Group
SOA 50 100 200 400 800 1600
WS A P A P A P A P A P A P
Mean 300 281 288 267 288 263 305 268 307 274 323 297
SEM 9 8 9 8 7 4 10 6 7 6 10 8
Table 3. Results of the ANOVA performed on the data of the irst session
Degrees of freedom F p Partial eta-squared
Intercept 1.000 2915.691 0.000 0.993
Group 1.000 1.470 0.238 0.063
Error 22.000
SOA 5.000 4.739 0.001 0.177
SOA*Group 5.000 0.552 0.736 0.024
Error 110.000
for anticipation errors, inversion errors, or omission
errors that occurred in the irst session. Wilcoxon test
did not show any differences between the total number of anticipation errors in the WS-present trials and total number of these errors in the WS-absent trials for both groups. Wilcoxon test also did not show any differences between the total number of omission errors in the present trials and total number of these errors in the WS-absent trials for both groups. Wilcoxon test showed that the total number of inversion errors was higher in the WS-present trials than in the WS-absent trials for the visual WS group (total number of errors in each condition, 3 and 9, respectively; p = .01) but not for the auditory WS group (total number of errors in each condition, 4 and 6, respectively). The former result suggests the occurrence of some speed–accuracy trade-off for the visual WS group.
Discussion
This study compared the effects of an auditory WS and visual WS in a choice RT task. Data analysis demonstrated that the RT of the visual WS group and
RT of the auditory WS group did not differ signiicantly in the irst session in which the WS were absent. It
also demonstrated that the RT of the auditory WS group was longer than the RT of the visual WS group in the WS-absent trials of the second session. It further demonstrated that the RT of the visual WS group and the
RT of the auditory WS group did not differ signiicantly
in the present trials. For both groups, RT in the WS-present trials was shorter than in the WS-absent trials.
Most of the observed effects were quite stable across the
range of SOAs tested.
The results obtained in the second session indicate
that the auditory WS inluenced the responsivity of
the participants more than the visual WS. It led to a reduction of responsivity, more clearly demonstrated by the poorer performance of the auditory WS group than the visual WS group in the WS-absent trials. Note that
this inding cannot be explained by naturally lower basal
responsivity of the auditory WS group than of the visual WS group because these groups performed similarly in
the irst session.
The responsivity reduction exhibited by the auditory WS group was presumably sustained during the block and was very likely caused by the proactive inhibition of the response triggering process described by Jaffard et al. (2007) and Boulinguez et al. (2009). The possibility that it occurred only in the WS-absent trials as a consequence, for example, of some confusion generated by the absence of the reference event represented by the WS in the trials sequence does not have any empirical support.
If it is accepted that the relatively long RT of the auditory WS group in the WS-absent trials of the second session was caused by the proactive inhibition of response triggering, then the shorter RT of this group in the WS-present trials may be attributable to transient inhibition of this tonic inhibition (i.e., disinhibition) of the motor
control mechanisms by the WS. This possibility was suggested by Boulinguez et al. (2009) to explain the faster RTs of their participants in the WS-present trials than in the WS-absent trials of their mixed block. Another possibility that must be considered, however, is that our result was due to direct transient facilitation of the sensorimotor mechanisms by the auditory WS. This explanation appears to be more appropriate than the former possibility because it can better account for the similar effects produced by our auditory WS across the full range of SOAs (i.e., a suppression of motor control mechanisms inhibition should have led to a larger effect of the WS in the case of the longest SOA because proactive inhibition of response triggering was apparently more intense for this SOA). Additionally, it can account for the
inding that an auditory WS presented in mixed blocks
increased sensory processing (Pinheiro &
Ribeiro-do-Valle, 2011). It also places the current indings in line with other indings from our laboratory (Del Fava &
Ribeiro-do-Valle, 2004) and laboratories of other researchers (e.g., Fernandez-Duque & Posner, 1997).
The present results obtained in the visual WS group do not allow one to determine whether the visual
WS negatively inluenced responsivity. However, considering our previous indings (Squella, 2007) and the indings of Jaffard et al. (2007) and Boulinguez et al.
(2009), it can be supposed that the addition of the visual WS to the task in the second session caused a sustained small reduction of responsivity in the participants by tonically inhibiting their motor control mechanisms and that the presentation of the visual WS compensated for this effect for a short time by transiently facilitating the participants’ sensorimotor mechanisms.
The transient facilitation of the sensorimotor mechanisms that supposedly competed with the proactive inhibition of motor control mechanisms in the WS-present trials in the current study would have been
produced by the alertness process or, more speciically, by
its temporal expectancy component considering that the intensity of both the visual and auditory WS was below the threshold for arousal mobilization (650 cd/m2 and 70 dB, respectively, according to Ulrich & Mattes, 1996).
Because the reduction of the RT from the WS-absent condition to the WS-present condition was larger for the auditory WS than for the visual WS, one can conclude that the former stimulus was more able to mobilize temporal expectancy than the latter. Notably, Fernandez-Duque & Posner (1997) similarly interpreted the larger effects of their auditory WS than their visual WS.
delay afterward. Such an advantage of auditory WS over visual WS to signal-impending relevant events has also been suggested by other authors (Wilkins, 1981; Suied,
Susini, & McAdams, 2008).
The greater mobilization of the putative proactive inhibition of the response triggering process by the auditory WS than the visual WS might be a consequence of the greater preparation to respond induced by the former WS. By more strongly inhibiting motor control mechanisms along the block, responses to the auditory WS instead of the TS could be properly avoided. The very low number of anticipation and inversion errors observed for the auditory WS group indicates that this strategy, if indeed adopted by the participants, was fully successful in its presumed intent.
The inding in the present study that an auditory WS can negatively inluence responsivity to the visual TS
suggests using more caution when interpreting the effects of WS, particularly when their intensity is relatively low and WS-absent and -present trials are mixed within the
same blocks. The effects of the facilitatory inluence of
temporal expectancy might be superimposed on the effects
produced by the inhibitory inluence of the proactive
inhibition of response triggering. The facilitation of responsivity produced by the WS might be only relative.
Acknowledgments
The research was supported by CAPES.
References
Bertelson, P., & Tisseyre, F. (1969). The time-course of preparation:
Conirmatory results with visual and auditory warning signals.
Acta Psychologica, 30, 145-154.
Boulinguez, P., Ballanger, B., Granjon, L., & Benraiss, A. (2009). The paradoxical effect of warning on reaction time: Demonstrating proactive response inhibition with event-related potentials. Clinical Neurophysiology, 120, 730-737.
Coull, J. T. (1998). Neural correlates of attention and arousal: Insights from electrophysiology, functional neuroimaging and psychopharmacology. Progress in Neurobiology, 55, 343-361.
Davis, R., & Green, F. A. (1969). Intersensory differences in the effect of warning signals on reaction time. Acta Psychologica,
30, 155-167.
Del-Fava, F., & Ribeiro-do-Valle, L. E. (2004). Relative contribution of expectancy and immediate arousal to the facilitatory effect of an auditory accessory stimulus. Brazilian Journal of Medical and Biological Research, 37, 1161-1174.
Fernandez-Duque, D., & Posner, M. I. (1997). Relating the mechanisms
of orienting and alerting. Neuropsychologia, 35, 477-486.
Gazzaniga, M. S., Ivry, R. B., & Mangun, G. R. (1998). Attention and selective perception. In M. S. Gazzaniga, R. B. Ivry, & G. R. Mangun (Eds.), Cognitive neuroscience: The biology of the mind
(pp. 207-245). New York: Norton.
Jaffard, M., Benraiss, A., Longcamp, M., Velay, J. L., & Boulinguez,
P. (2007). Cueing method biases in visual detection studies. Brain Research, 1179, 106-118.
Jennings, J. R., Van der Molen, M. W., & Steinhauer, S. R. (1998).
Preparing the heart, eye, and brain: Foreperiod length effects in a nonaging paradigm. Psychophysiology, 35, 90-98.
Miller, J., & Anbar, R. (1981). Expectancy and frequency effects on
perceptual and motor systems in choice reaction time. Memory and Cognition, 9, 631-641.
Niemi, P., & Näätänen, R. (1981). Foreperiod and simple reaction time. Psychological Bulletin, 89, 133-162.
Pinheiro, G. B., & Ribeiro-do-Valle, L. E. (2011). Facilitation of detectability and criterion by automatic temporal expectation.
International Journal of Psychological Studies, 3, 171-177.
Posner, M. I., Nissen, M. J., & Klein, R. M. (1976). Visual dominance: An information-processing account of its origins and signiicance.
Psychological Review, 83, 157-171.
Sanders, A. F. (1966). Expectancy: Application and measurement.
Acta Psychologica, 25, 293-313.
Squella, S. A. F. (2007). Inhibitory effect of a visual prime stimulus in a simple reaction time task [Ph.D. thesis]. São Paulo, Brazil: University of São Paulo.
Suied, C., Susini, P., & McAdams, S. (2008). Evaluating warning
sound urgency with reaction times. Journal of Experimental Psychology: Applied, 14, 201-212.
Sullivan, C., Urakawa, K. S., & Cossey, V. L. (1996). Separating the effects of alertness from the effects of encoding in a pitch-imagery task. Journal of General Psychology, 123, 105-114.
Ulrich, R., & Mattes, S. (1996). Does immediate arousal enhance
response force in simple reaction time? Quarterly Journal of Experimental Psychology, 49, 972-990.
Van der Heijden, A. H. C. (1992). Selective attention in vision. London: Routledge.
Weibach, N., & Henik, A. (2012). Temporal orienting and alerting: The same or different? Frontiers in Psychology, 3, 1-3.