A
r
t
ic
le
0103 - 5053 $6.00+0.00
*e-mail: [email protected]
Simultaneous Quantification of Amphetamines and Ephedrines in Urine by GC/MS
using Analytical-Grade Acetic Anhydride/Pyridine as Derivatizing Reagents:
a Suitable Approach to Reduce Costs of Routine Analyses
Patrícia L. de Souza Bergo,a Joane M. Correa,a Tanus J. Nagem,b
Rodinei Augustia and Clésia C. Nascentes*,a
aDepartamento de Química, Universidade Federal de Minas Gerais, 31270-901 Belo Horizonte-MG, Brazil
bConfederação Brasileira de Futebol, Rua Victor Civita, 66, B1, Edifício 5 (5º andar),
Condomínio Rio Office Park, Barra da Tijuca, 22775-040 Rio de Janeiro-RJ, Brazil
Neste trabalho foi desenvolvido e validado um método quantitativo para a análise de anfetaminas e efedrinas em urina, utilizando-se anidrido acético e piridina, ambos em grau analítico, como derivatizantes. As amostras foram extraídas por extração em fase sólida (EFS), derivatizadas e em seguida analisadas por CG-EM. O método apresentou ampla faixa linear (25-1000 ng mL-1
com R2 > 0,99), alta sensibilidade (LODs variando de 0,0140 a 15,33 ng mL-1 e LOQs variando
de 0,0466 a 51,10 ng mL-1), bons índices de precisão (CV < 6% para intra- e inter-ensaios) e
excelentes índices de recuperação (87-96%) para todos os compostos estudados. Após a validação, o método foi aplicado em análises de amostras reais de urina humana nas quais ao menos um dos analitos em estudo foi identificado previamente. Em todas as amostras, anfetaminas e efedrinas foram facilmente quantificadas mostrando que a associação de anidrido acético e piridina é uma boa opção como agente derivatizante.
A GC/MS method for the simultaneous analyses of different amphetamines and ephedrines in urine employing analytical-grade acetic anhydride/pyridine as derivatizing reagents was developed and validated. Solid-phase extraction was performed on the samples, which were then derivatizated and analyzed by GC/MS. The method showed a broad linear dynamic range (25-1000 ng mL-1 with R2 > 0.99), high sensitivity (LODs of 0.0140 to 15.33 ng mL-1 and LOQs
of 0.0466 to 51.10 ng mL-1), good precision (CV < 6% for intra- and inter-assays), and excellent
extraction recovery (87 to 96%) for all the compounds studied. After validation, the method was applied in the analyses of real samples of human urine which were previously determined to contain at least one of such drugs. In all the samples, the amphetamines and ephedrines were promptly quantified, showing that the association of acetic anhydride and pyridine can be conveniently employed as a derivatizing agent.
Keywords: stimulants, amphetamines, ephedrines, GC/MS, acetic anhydride/pyridine, urine
analysis, derivatizing reagents
Introduction
Amphetamines and ephedrines constitute the major class of stimulants of the Central Nervous System (CNS). They may cause a decrease in physical and mental fatigue with the consequent increase of alertness, competitiveness, and
aggressiveness.1 These stimulants, especially the synthetic
derivatives, have been usually found in rave parties, and
illegally also abused by weight-room’s users in order to get
the “perfect body”, being as such frequently listed as illicit
substances by the anti-doping control laboratories.2 Recently,
another situation has worried healthy authorities worldwide: the systematical and abusive use of amphetamines by athletes, especially in competitions that demand use of
physical resistance and explosive power.3
A number of reports on the analysis of amphetamines and ephedrines in biological samples using gas or liquid chromatography coupled to mass spectrometry (GC/MS
or LC/MS) has been described.4-6 Although these methods
describing the analysis of specific drugs.7-9 On the other
hand, only few methods dealing with the detection of
ephedrines have been reported.10,11 As amphetamines have
a relatively high polarity and ephedrines are thermically
unstable,12 a derivatization step is usually required.
For amphetamines, acylation is the most used derivatization method. It is usually performed by using
acyl halides or anhydrides of halogenated acids.13 These
compounds, in particular fluoroacyl, are very reactive and
improve the sensitivity and resolution of the analyses,14
specially when the separation of enantiomers is required.15
However, the costs of these reagents are still high for many laboratories, including the ones located in Latin America. Furthermore, the secondary products formed during the reaction (halogen and free carboxylic acids) must be removed before injection to prevent damages to the chromatographic column.
Alternatively, anhydrides of alkyl or aryl acids, such as acetic anhydride, have been used owing to their prompt removal from the reaction medium. Moreover, if alkyl acid anhydride is still present in the samples and is injected into the chromatograph inlet, it rarely causes some extensive damages to the chromatographic column. To improve the reaction yield, derivatization is usually performed in the presence of a proton acceptor (such as pyridine), although
this is not always required.16 Anhydrides of alkyl acids are
cheaper than acyl halides or anhydrides of halogenated acids, but in many cases the costs are still high, particularly for routine analyses.
To avoid the use of costly ultra-pure derivatization reagents, efforts have been made to implement the use of alternative analytical-grade reagents. For instance, El-Haj and coworkers employed analytical-grade cyclohexanone as a convenient derivatizing reagent for the GC-MS analysis
of amphetamines.17 In this case, cyclic derivatives were
obtained as final products.
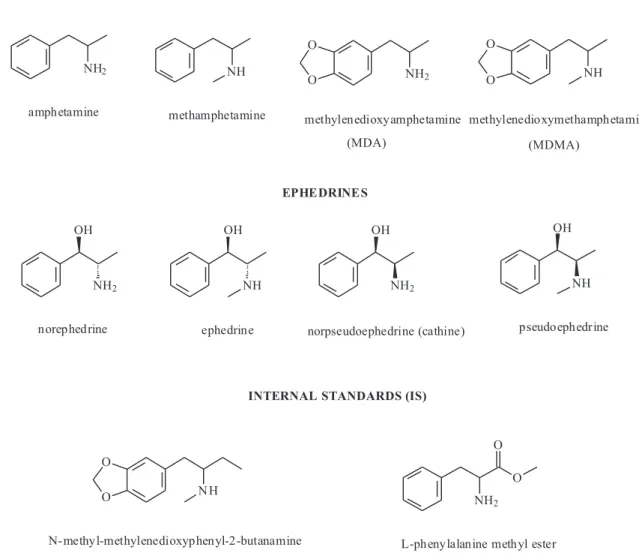
In the present study, a novel GC-MS method for the simultaneous quantitative analyses of amphetamines and ephedrines (Figure 1) by using analytical-grade acetic anhydride and pyridine as derivatizing reagents was developed and validated. Such a methodology was also applied for the analyses of real samples of human urine.
Experimental
Materials
Ephedrine–HCl (purity 99%) and L-phenylalanine (purity 99%) were purchased from Sigma-Aldrich (São Paulo, Brazil). (-)-Norpseudoephedrine-HCl (cathine-HCl) (purity
99%), (+)-pseudoephedrine-HCl (Ψ-ephedrine-HCl) (purity
98%), (+/-)-norephedrine-HCl ((+/-)-phenylpropanolamine) (purity 99%) and methamphetamine-HCl (purity 98%) (Sigma-Aldrich, St. Louis, MO) were kindly donated by The Brazilian Doping Control Lab (LADETEC, Rio de Janeiro, Brazil). Amphetamine sulfate (purity 98%) (Sigma-Aldrich, St. Louis, MO) was donated by The Forensic Institute of the Minas Gerais State Police. (+/-)-Methylenedioxyamphetamine (MDA), (+/-)-methylenedioxymethamphetamine (MDMA) and (+/-)-N-methyl-methylenedioxyphenyl-2-butanamine (MBDB) were purchased from Radian Inc. (Dallas, TX,
USA) as 1 mg mL-1 solution of free base in methanol.
Nitrogen (purity 99.999%) and helium (purity 99.999%) were purchased from White Martins (Belo Horizonte, Brazil). HPLC-grade methanol (purity 100%) was purchased from J.T.Backer (Phillipsburg, NJ, USA). Acetic anhydride, pyridine, dichloromethane and sulfuric acid, all of them in analytical grade, were purchased from Synth (São Paulo, Brazil), Merck (Darmstadt, Germany), CRQ (São Paulo, Brazil) and Microquímica (Florianópolis, Brazil), respectively. AccuBondII ODS-C18 (500 mg, 6 mL) SPE cartridges, produced by Agillent Technologies (Santa Clara, CA, USA) were donated by The Chromatography Lab of Water and Sewer Company of the Minas Gerais State (COPASA-MG).
The alkaline extraction buffer (pH 11) was prepared by
mixing 8.426g of NaHCO3 and 53.2615g of Na2CO3. The
final volume was completed with deionized water to 1 L. Both salts were purchased from Synth (São Paulo, Brazil).
L-Phenylalanine methyl ester and MBDB were used as internal standards (IS). The former was synthesized in our laboratory according to the procedure described below. MBDB was used as internal standard in the analysis of MDA and MDMA whereas L-phenylalanine methyl ester was used as internal standard for the other compounds (Figure 1). MBDB is a designer drug usually found as a contaminant in many street preparations of MDA and/or MDMA. In South America, however, there are no official reports on the MBDB abuses; hence, MBDB can be
conveniently used as an internal standard18 instead of the
quite expensive deuterated analytes.19, 20
For each analyte, including the internal standards, stock
solutions were prepared at a concentration of 500 ng mL-1. The
working standard solutions were prepared by diluting the stock
solution with methanol up to final concentrations of 0.5 ng mL-1
(except for IS) or 5.0 ng mL-1 and stored at −20 ºC.
L-Phenylalanine methyl ester (Internal Standard) synthesis
1.81 mL of sulfuric acid. The flask was placed in a water-bath for 4 hours at 85 ºC, coupled with an addition funnel, a thermometer, and a glass cap. A volume of 44.18 mL of methanol was dropped continuously into the mixture, under constant stirring. Simultaneously, the excess of methanol was continuously removed from the reaction medium.
After 4 hours, an oily phase was formed. Carbonate buffer was added to this phase to reach pH 11. Dichloromethane was added 3 times in aliquots of 20 mL. After each addition, the aqueous phase was separated and discarded.
Na2SO4 was added to the final organic phase, which was
subsequently filtered. The dichloromethane was then evaporated under reduced pressure and slight heating. The residue was weighted (3.4675 g) and dissolved in methanol to produce a solution with a final (theoretical) concentration
of 500 µg mL-1. The formation of the desired product with
high degree of purity was confirmed by GC-MS analysis (only L-phenylalanine methyl ester was detected).
Urine samples
Spiked samples
For the method optimization and validation, blank samples of human urine were taken from 10 healthy volunteers (5 males and 5 females) between 20 and 35 years old. All the volunteers declared they had not recently used any kind of stimulant. A pool of these samples was prepared and aliquots of 1 mL were spiked with the amphetamines, ephedrines, and internal standards at concentrations ranging
from 0 to 2000 ng mL-1. For the method optimization, the
concentration of each drug was 250 ng mL-1 of urine.
Real samples
Forty two (42) real urine samples containing amphetamines were investigated. They were collected from seven volunteers (four men and three women) who took a single therapeutical dose of pseudoephedrine (Dimetapp Gelcaps®, pseudoephedrine
hydrochloride, 60 mg, and brompheniramine maleate, 4 mg) whereas other two ingested a placebo dose. The urine samples from each volunteer were collected after 0, 2, 4, 6, 8 and 10 h of the ingestion. This study was previously approved by the Ethics in Research Committee of the Federal University of Minas Gerais (process number: CAAE-0233.0.203.000-06, Belo Horizonte, Brazil).
Sample preparation
Fifty microliters of each internal standard (Figure 1) were added to 1 mL of the urine samples to reach a final
concentration of 250 ng mL-1 in urine. The pH of the
medium was adjusted to 11 by using the carbonate buffer (1 mL). The mixture was vigorously stirred by vortex for 1 minute and then extracted by SPE. Each cartridge was previously conditioned with methanol (1 mL) and carbonate buffer (pH 11, 1 mL). After the passage of the sample through the cartridge, 2 mL of deionized water was added. The SPE phase was dried for 5 min and the compounds were eluted with 2 mL of methanol. The extraction was performed under moderate vacuum.
The eluates from the SPE cartridge were evaporated to
dryness under N2 stream at 40 ºC and derivatization was
performed by adding 400 µL of acetic anhydride/pyridine (3:2) to the residues in an ultrasonic bath at 50 ºC during 40 min. Different compositions of derivatizing reagent (acetic anhydride and acetic anhydride/pyridine in the ratios of 1:1 and 4:1, respectively) were also evaluated. Thereafter,
the mixtures were evaporated to dryness under N2 stream
at 40 ºC and reconstituted by 200 µL of methanol before injection of 1 µL into the GC-MS inlet. All the analyses were done in duplicate. This procedure was applied to both types of samples (spiked and real).
Instrumentation and analytical conditions
GC-MS analyses were performed in a Trace GC Ultra chromatograph, with an autosampler AI 3000, coupled to a Polaris Q Ion Trap mass spectrometer (Thermo Electron Corporation, Austin, TX, USA). A capillary column (RTx-5MS, Restec, Ireland) was used having the following specifications: size 30 m, i.d. 0.25 mm, film thickness 0.25 µm, and stationary phase composed by 5% diphenyl and 95% dimethylsiloxane.
Helium was used as carrier gas at a constant flow of
1.0 mL min-1. The inlet and the interface temperatures were
set to 250 and 275 ºC, respectively. The chromatographic conditions were set as follows: initial temperature of 70 ºC
(holding time 4 min) with increment of 20 ºC min-1 up to
160 ºC, 5 ºC min-1 to 185 ºC, 1 ºC min-1 up to 198 ºC, and
5 ºC min-1 up to 220 ºC (holding time 5 min). The inlet was
operated in the splitless mode (delay time of 5 min).
The mass spectrometer was operated in the EI (electron ionization) mode at 70 eV and it was turned on after a delay time of 9 min. The MS source temperature was 200 ºC. The mass spectra were initially acquired in the full
scan mode (range of m/z 40 to 550) in order to establish
the retention times and to select two or three characteristic ions for each compound (derivatizated analytes and IS). The quantitative analyses were performed in the SIM (single-ion monitoring) mode.
Method validation
Linearity was assessed with 1 mL of the pooled urine sample spiked with different volumes of the standard solutions to obtain calibration solutions at concentrations
of 1, 5, 10, 25, 50, 100, 250, 500, 1000 and 2000 ng mL-1
of each analyte. The concentration of the internal standards
in these samples was 250 ng mL-1. Five replicates at each
concentration were extracted, derivatizated, and analyzed as described before. The regression line was calculated using
a weighted (1/x2) linear least-square regression model.
Limit of Detection (LOD) and Limit of Quantification (LOQ) were calculated from analyses of 10 replicates of blank sample. The standard deviation (SD) of those analyses was divided by the angular coefficient of the linear equation model and multiplied by three (LOD) and ten (LOQ) times.
Precision assays were divided in intra-day precision (or intra-day reproducibility) and inter-day precision (or inter-day reproducibility). For the former, seven replicates of each sample were analyzed in the same day in intervals of 2 hours. For the last, five replicates of each sample were analyzed for seven consecutive days. Both results were expressed as the percentage coefficient of variation (%CV). Extraction recovery was evaluated by analyzing seven replicates of each sample, which one previously submitted to the extraction and derivatization steps. Seven replicates of the standard solutions in methanol at the same concentrations as above were also prepared, derivatizated, and analyzed. The recovery was calculated as the peak areas ratio between the samples and the respective methanol standard solutions. Freeze/thaw stability was assessed by analyzing five replicates of each spiked sample before and after 3 freeze/thaw cycles. For each cycle, samples were
frozen at −20 °C during 20 h, thawed, and allowed to reach
the room temperature for 4 h. The results of this assay were also presented as the coefficient of variation (%CV). This parameter was calculated for each concentration after each cycle. To evaluate the overall stability, a total coefficient of
variation (%CVtotal) was calculated for each concentration
Method application
After validation, the method was applied to the analysis of real urine samples. To these samples (1 mL), 50 µL of each internal standard solution was added. The resulting solutions were extracted, derivatizated, and analyzed according to the procedures previously described. Before quantification, a calibration curve was built in the
concentration range of 50 to 500 ng mL-1. The regression
line was calculated as in the linearity assay. When the peak area ratio was out of the calibration curve, the sample was diluted, extracted, and derivatizated again until it fitted the curve.
Results and Discussion
Mass spectra of the acetyl derivatives: selection of the diagnostic ions
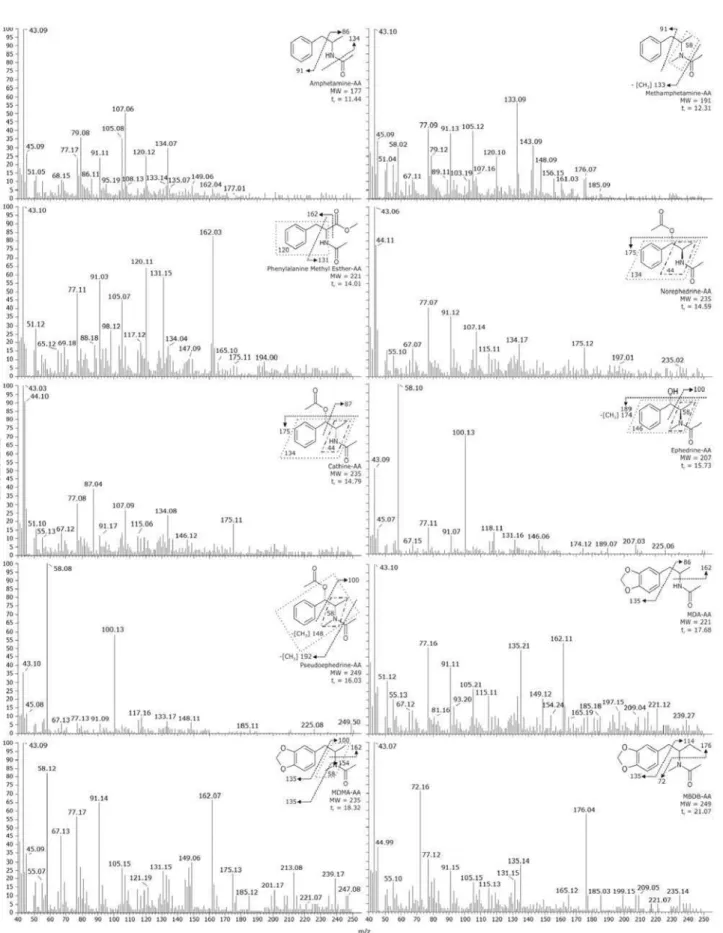
The diagnostic ions for the acetylated derivatives, as employed in the SIM analyses, are listed with the respective relative abundances in Table 1. As a general rule, these are the most characteristic ions that show a significant intensity in the full scan mass spectra (Figure 2)
of the derivatizated analytes.16 The unique retention times
(Table 1) obtained for each acetylated compound indicates that the derivatization method yielded only one derivative. Hence, the MS fragmentation profile revealed that most of the analytes were acetylated at both the hydroxyl and amino moieties. The exceptions were ephedrine and pseudoephedrine for which the amino group seems to be the exclusive acetylation site.
Parameters optimization
Three different volumes of methanol were used to elute the SPE cartridge during the extraction step: 1, 2 and 3 mL. The first volume was not sufficient to completely elute all the compounds in the mixture. Hence, the chromatographic peaks of the acetylated norephedrine and MDA could not be detected under these conditions. On the other hand, all the compounds could be clearly observed in a well-resolved chromatogram when the elution was performed by using 2 or 3 mL of methanol. Taking into account that the evaporation of 3 mL of methanol is a slower procedure, 2 mL was thus selected as the optimized volume to be used for the SPE cartridge elution.
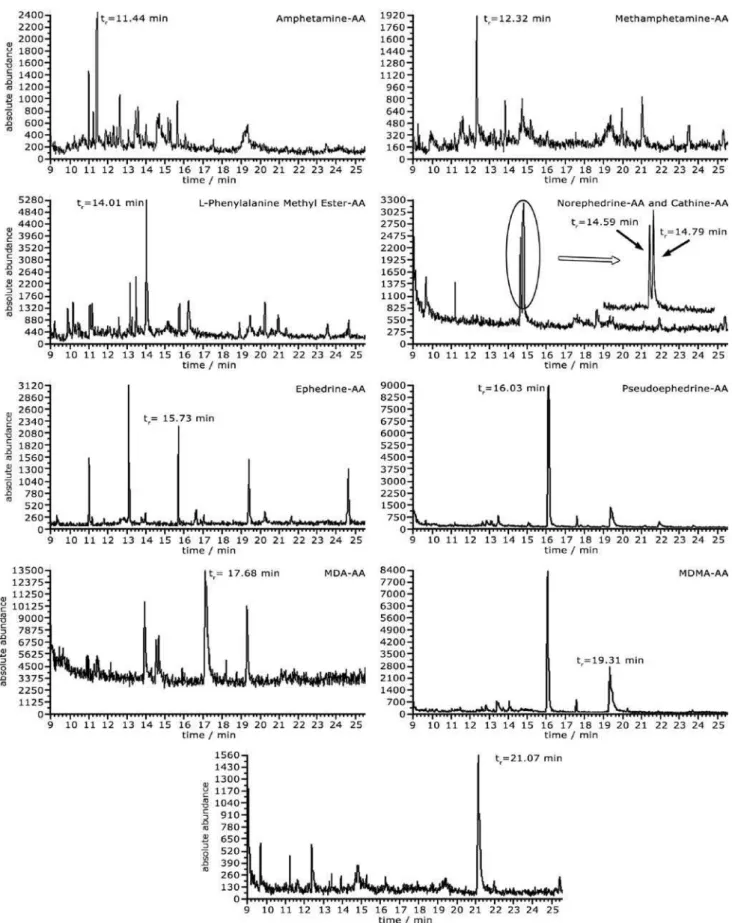
Regarding the proportion of acetic anhydride/pyridine, the best condition was achieved when a composition of 3:2 was used, respectively. The chromatograms obtained by applying such optimized conditions showed good
resolution, as observed in Figure 3. The total run time was, however, inconveniently long (35.9 min). Attempts to decrease this time by increasing the heating rate resulted in loss of chromatographic resolution (for instance, the isomers norephedrine and cathine co-eluted under these modified conditions).
Method validation
Pool urine samples (see Experimental section for more details) were used to reduce putative matrix effects. The analysis of the blank samples did not reveal the presence of any interfering compound co-eluting with the analytes. Table 2 shows a good linear behavior in the range of
50-1000 ng mL-1 (R2 > 0.99) for all the drugs studied (note
that some of them showed a wider linear dynamic range). Very good sensitivities were obtained for all compounds
with detection limits (LOD) varying from 0.0140 ng mL-1
to 15.33 ng mL-1 and quantification limits (LOQ) ranged
from 0.0466 ng mL-1 to 51.10 ng mL-1.
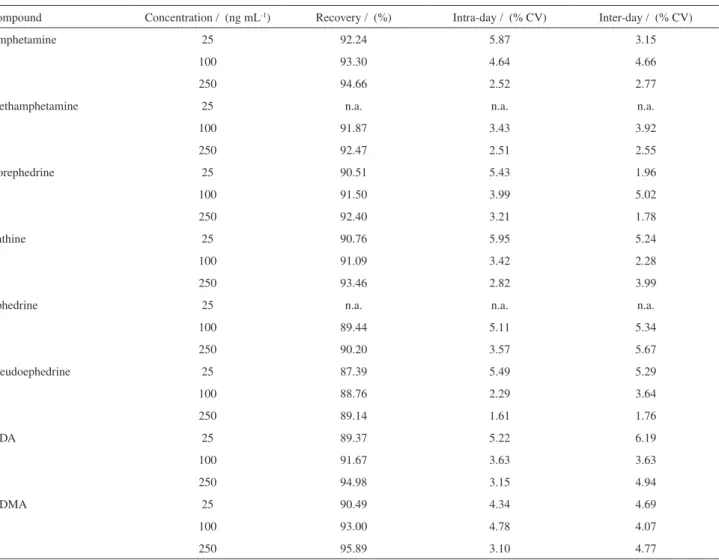
Intra-day and inter-day assays showed RSD (relative standard deviations) smaller than 5% (with few exceptions) that is significant especially for analysis involving biological samples (Table 3). The method also presented excellent extraction recoveries, ranging from 87.39%
(pseudoephedrine, 25 ng mL-1) to 95.89% (MDMA,
250 ng mL-1), most of them being higher than 90%.
In the investigation of sample stability, the concentration of all analytes was significantly reduced after the first freeze/ thaw cycle (Figure 4). This is likely because the precipitation of part of mucus and proteins after sample thawing takes away a fraction of the analyte. After the second and third cycles, however, the precipitation of biological material is considerably smaller and thus the amount of analyte carried out is insignificant. Overall, the decrease in the analyte concentration is acceptable as all the coefficient of variations were smaller than 20%. Hence, even if the samples are previously frozen, the analysis can still proceed.
Note that in the experiments performed to evaluate the intra- and inter-day reproducibility, extraction recovery, and stability after freeze/thaw cycles, the samples concentrations comprised only the lower and intermediate values in the linear dynamic range. At
higher concentration ranges (500 or 1000 ng mL-1), an
undesirable peak broadening was observed. In addition, the analyses had to be continuously interrupted to perform preventive maintenance, which impaired the assays with a higher number of replicates. Besides, the results of the
assays for methamphetamine and ephedrine at 25 ng mL-1
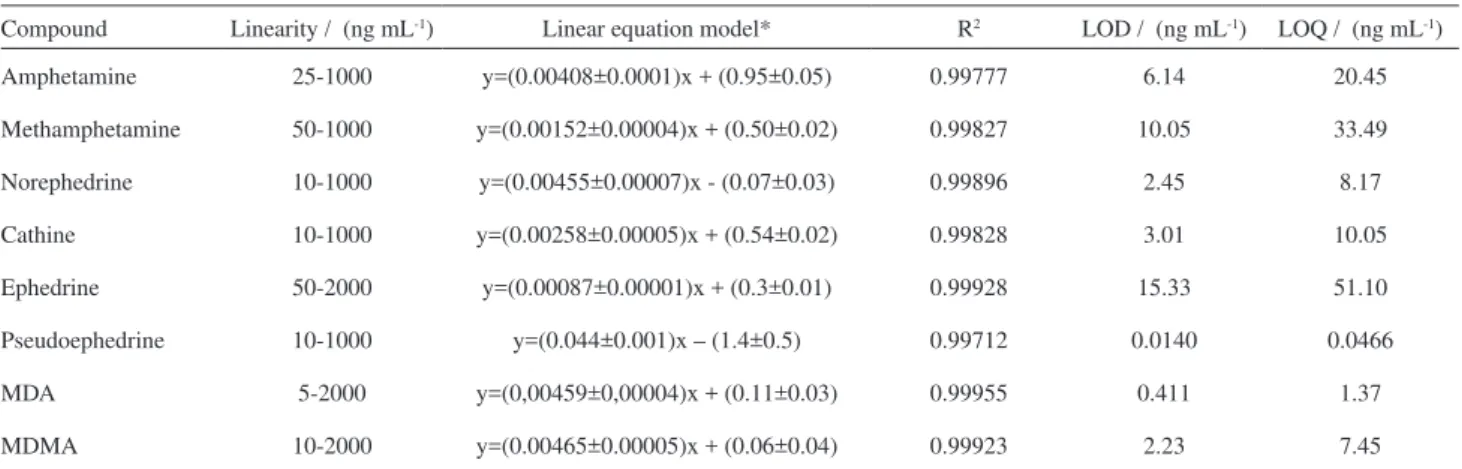
Table 2. Linearity, LOD and LOQ for the acetyl-derivatives of the amphetamines and ephedrines
Compound Linearity / (ng mL-1) Linear equation model* R2 LOD / (ng mL-1) LOQ / (ng mL-1)
Amphetamine 25-1000 y=(0.00408±0.0001)x + (0.95±0.05) 0.99777 6.14 20.45
Methamphetamine 50-1000 y=(0.00152±0.00004)x + (0.50±0.02) 0.99827 10.05 33.49
Norephedrine 10-1000 y=(0.00455±0.00007)x - (0.07±0.03) 0.99896 2.45 8.17
Cathine 10-1000 y=(0.00258±0.00005)x + (0.54±0.02) 0.99828 3.01 10.05
Ephedrine 50-2000 y=(0.00087±0.00001)x + (0.3±0.01) 0.99928 15.33 51.10
Pseudoephedrine 10-1000 y=(0.044±0.001)x – (1.4±0.5) 0.99712 0.0140 0.0466
MDA 5-2000 y=(0,00459±0,00004)x + (0.11±0.03) 0.99955 0.411 1.37
MDMA 10-2000 y=(0.00465±0.00005)x + (0.06±0.04) 0.99923 2.23 7.45
y = ratio analyte area/IS area and x= analyte concentration.
Table 1. Retention times and m/z of the qualifier ions for the acetylated amphetamines, ephedrines, and internal standards
Compounds Retention time / min m/z of the diagnostic ions for SIM mode
Amphetamine 11.44 86(40), 91(84), 134(100)
Methamphetamine 12.32 58(50), 91(70), 133(100)
Phenylalanine methyl ester 14.01 120(77), 131(70), 162(100)
Norephedrine Cathine 14.59
14.79
44(100), 134(25), 175(21)
44(100), 134(25), 175(20)
Ephedrine 15.73 58(100), 100(70), 146(10)
Pseudoephedrine 16.03 58(100), 100(50), 148(10)
MDA 17.68 135(90), 162(100), 221(30)
MDMA 19.31 58(100), 162(80), 235(15)
MBDB 21.07 72(100), 135(40), 176(80)
The values in italic indicate the relative intensity of the diagnostic ions in the analyses in SIM mode.
The results presented herein showed good agreement with the results obtained from similar and recently
described procedures.8,10, 21-29 This thus suggests that the
methodology described herein, despite of being inexpensive as it uses common analytical grade derivatizing reagents, is as efficient as the alternative ones.
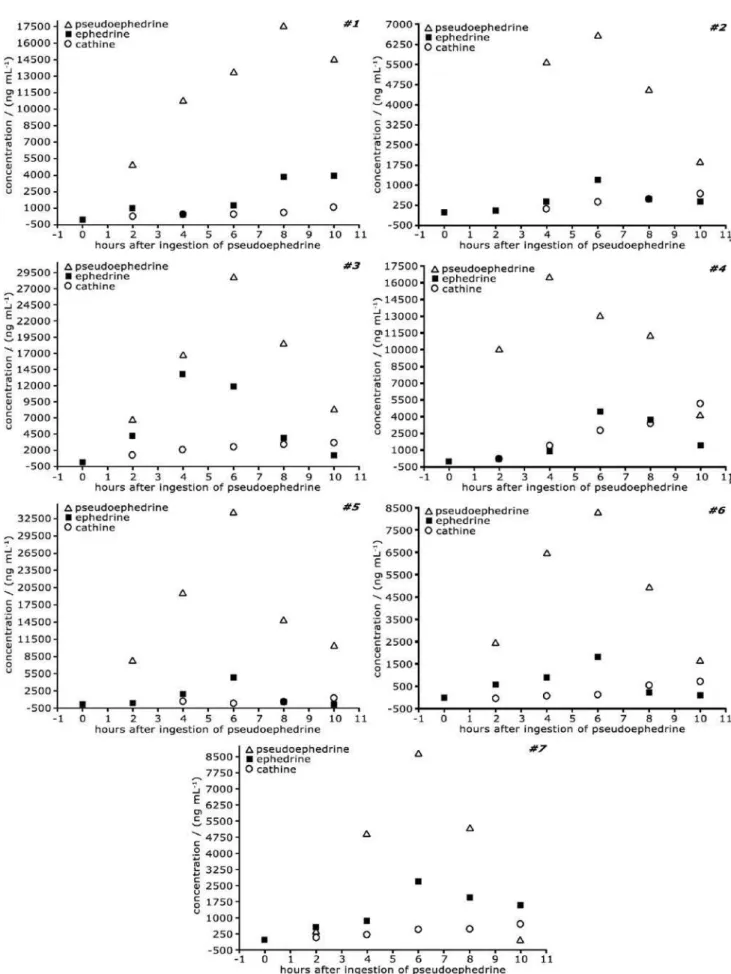
Method application
The analyses of the real samples show that the method not only confirmed the positive cases but also enabled the detection and quantification of the amphetamines and ephedrines. The analyses of urines from volunteers who ingested placebo presented no traces of drugs. The analyses of samples from the other volunteers also indicated no traces of amphetamine, methamphetamine, norephedrine, MDA and MDMA (data not shown).
According to Figure 5, pseudoephedrine is primarily excreted in urine as the active, non-metabolized form. Its highest level in urine occurred 6 hours after the ingestion, except in one case (for the volunteer #1 it occurred 8 hours after the medicine intake). This result is in good agreement
with data described in literature.30 Cathine, the major
pseudoephedrine metabolite, showed a different behavior as its excretion curve was slightly ascendant for all volunteers. However, the number of samples analyzed was not sufficient to allow a conclusive remark on its metabolism.
In some particular cases (see volunteers 3 and 7, Figure 5) the ephedrine concentration was relatively high. In the presence of catalytic amounts of glacial acetic acid and acetic anhydride, (+)-pseudoephedrine can be easily converted into
(-)-ephedrine, especially at high temperature conditions.31
Conclusions
The method described herein allowed the simultaneous analysis of a set of amphetamines and ephedrines. The sample preparation steps were very simple and efficient and the validated method presented good selectivity, high sensitivity, precision and extraction recovery. Therefore, the association of acetic anhydride and pyridine can be postulated as an advantageous alternative for the use of costly ultra-pure derivatization reagents in qualitative and quantitative analyses of such class of drugs in urine and even in other biological matrices.
Acknowledgments
This work was sponsored by Coordenação de Aperfeiçoamento de Pessoal de Nível Superior (CAPES) and Fundação de Amparo à Pesquisa do Estado de Minas Gerais (FAPEMIG). The authors acknowledge the
technical assistance of The Brazilian Doping Control Lab (LADETEC), The Forensic Institute of Minas Gerais State Police and The Chromatography Lab of Water and Sewer Company of Minas Gerais (COPASA-MG).
References
1. Segura, J.; Ventura, R.; Jurado, C.; J. Chromatogr., B1998, 713, 61. 2. The World Anti-doping Code - The 2008 Prohibited List:
International Standard, http://www.wada-ama.org/rtecontent/
document/2008_List_En.pdf, accessed in september, 2008. 3. Verroken, M.; Best Pract. Res. Clin. Endocrinol. Metabol.2000,
14, 1.
4. de Oliveira, C. D. R.; Roehsig, M.; de Almeida, R. M.; Rocha, W. L.; Yonamine, M.; Curr. Pharm. Anal.2007, 3, 95. 5. Kudo, K.; Ishida, T.; Hara, K.; Kashimura, S.; Tsuji, A.; Ikeda,
N.; J. Chromatogr., B2007, 855, 115.
6. Pizzolato, T. M.; de Alda, M. J. L.; Barcelo, D.; Trac, Trends
Anal. Chem.2007, 26, 609.
Table 3. Extraction recovery and intra-day/inter-day precision for the amphetamines and ephedrines acetyl derivatives
Compound Concentration / (ng mL-1) Recovery / (%) Intra-day / (% CV) Inter-day / (% CV)
Amphetamine 25 92.24 5.87 3.15
100 93.30 4.64 4.66
250 94.66 2.52 2.77
Methamphetamine 25 n.a. n.a. n.a.
100 91.87 3.43 3.92
250 92.47 2.51 2.55
Norephedrine 25 90.51 5.43 1.96
100 91.50 3.99 5.02
250 92.40 3.21 1.78
Cathine 25 90.76 5.95 5.24
100 91.09 3.42 2.28
250 93.46 2.82 3.99
Ephedrine 25 n.a. n.a. n.a.
100 89.44 5.11 5.34
250 90.20 3.57 5.67
Pseudoephedrine 25 87.39 5.49 5.29
100 88.76 2.29 3.64
250 89.14 1.61 1.76
MDA 25 89.37 5.22 6.19
100 91.67 3.63 3.63
250 94.98 3.15 4.94
MDMA 25 90.49 4.34 4.69
100 93.00 4.78 4.07
250 95.89 3.10 4.77
7. Villamor, J. L.; Bermejo, A. M.; Fernandez, P.; Tabernero, M.
J.; J. Anal. Toxicol.2005, 29, 135.
8. Villamor, J. L.; Bermejo, A. M.; Fernandez, P.; Tabernero, M.
J.; Anal. Lett.2005, 38, 781.
9. Yang, W. Y.; Barnes, A. J.; Ripple, M. G.; Fowler, D. R.; Cone, E. J.; Moolchan, E. T.; Chung, H. S.; Huestis, M. A.; J.
Chromatogr., B2006, 833, 210.
10. Frison, G.; Tedeschi, L.; Favretto, D.; Reheman, A.; Ferrara, S.
D.; Rapid Commun. Mass Spectrom.2005, 19, 919.
11. Wang, S. M.; Lewis, R. J.; Canfield, D.; Li, T. L.; Chen, C. Y.; Liu, R. H.; J. Chromatogr., B2005, 825, 88.
12. Wille, S. M. R.; Lambert, W. E. E.; J. Chromatogr., A2004,
1045, 259.
13. Brown, H.; Kirkbride, K. P.; Pigou, P. E.; Walker, G. S.; J.
Forensic Sci.2003, 48, 1231.
14. Wells, R. J.; J. Chromatogr., A1999, 843, 1. 15. Shin, H.; Donike, M.; Anal. Chem. 1996, 68, 3015.
16. Staerk, U.; Kulpmann, W. R.; J. Chromatogr., B2000, 745, 399.
17. El-Haj, B. M.; Al-Amri, A. M.; Hassan, M. H.; Ali, H. S.; Bin Khadem, R. K.; Forensic Sci. Int.2003, 135, 16.
18. da Costa, J. L.; Chasin, A. A. D.; J. Chromatogr., B2004, 811, 41.
19. Concheiro, M.; Simoes, S. M. D.; Quintela, O.; de Castro, A.; Dias, M. J. R.; Cruz, A.; Lopez-Rivadulla, M.; Forensic Sci. Int.2007, 171, 44.
20. Westphal, F.; Franzelius, C.; Schafer, J.; Schutz, H. W.; Rochholz, G.; Accred. Qual. Assur.2007, 12, 335.
21. Fujii, H.; Hara, K.; Kashimura, S.; Kageura, M.; Kashiwagi, M.; Miyoshi, A.; Ikeda, S.; J. Chromatogr., B2006, 842, 116. 22. Huang, M. K.; Liu, C. R.; Huang, S. D.; Analyst2002, 127,
1203.
23. Huang, Z. P.; Zhang, S. Y.; J. Chromatogr., B2003, 792, 241. 24. Kankaanpaa, A.; Gunnar, T.; Ariniemi, K.; Lillsunde, P.;
Mykkanen, S.; Seppala, T.; J. Chromatogr., B2004, 810, 57. 25. Lin, H. R.; Lua, A. C.; Rapid Commun. Mass Spectrom.2006,
20, 1724.
26. Maresova, V.; Chadt, J.; Prikryl, L.; Neuroendocrinol. Lett.
2006, 27, 121.
27. Nishida, M.; Namera, A.; Yashiki, M.; Kimura, K.; Forensic
Sci. Int.2004, 143, 163.
28. Pirnay, S. O.; Abraham, T. T.; Huestis, M. A.; Clin. Chem.2006,
52, 1728.
29. Saito, T.; Mase, H.; Takeichi, S.; Inokuchi, S.; J. Pharm. Biomed.
Anal.2007, 43, 358.
30. Tseng, Y. L.; Shieh, M. H.; Kuo, F. H.; Forensic Sci. Int.2006,
157, 149.
31. Bentley, K. W.; Nat. Prod. Rep.2003, 20, 342.