*Correspondence: M.I.R.M. Santoro. Department of Pharmacy, Faculty of Pharmaceutical Sciences, University of São Paulo. Av. Prof. Lineu Prestes, 580. Bloco: 13 – Butantã - 05508-000 - São Paulo - SP, Brasil. E-mail: [email protected]
A
vol. 49, n. 3, jul./sep., 2013
Simultaneous determination of ethinyl estradiol and drospirenone
in oral contraceptive by high performance liquid chromatography
Viviane Benevenuti Silva, Angel Arturo Gaona Galdos, Cintia Maria Alves Mothe, Michele
Bacchi Pallastrelli, Maria Segunda Aurora Prado, Anil Kumar Singh, Erika Rosa Maria
Kedor-Hackmann, Maria Inês Rocha Miritello Santoro
*Department of Pharmacy, Faculty of Pharmaceutical Sciences, University of São Paulo, SP, Brazil
A simple, rapid, economical and reliable high performance liquid chromatographic method has been developed and successfully applied in simultaneous determination of ethinyl estradiol and drospirenone in coated tablets. The HPLC method was performed on a LiChroCART® 100RP column (125x4 mm i.d., 5 µm) with acetonitrile:water 50:50 (v/v) as mobile phase, pumped at a low rate of 1.0 mL.min-1. The luorescence detection for ethinyl estradiol was made at λex= 280 nm and λem= 310 nm and a UV detection for drospirenone was made at 200 nm. The elution time for ethinyl estradiol and drospirenone were 4.0 and 5.7 min, respectively. The method was validated in accordance to USP 34 guidelines. The proposed HPLC method presented advantages over reported methods and is suitable for quality control assays of ethinyl estradiol and drospirenone in coated tablets.
Uniterms: Coated tablets/quantitative analysis. High performance liquid chromatography/quantitative analysis. Ethinyl estradiol/quantitative determination. Drospirenone/quantitative determination. Fluorescence detection. UV detection.
Um método simples, rápido, econômico e coniável foi desenvolvido empregando a cromatograia líquida de alta eiciência para a determinação simultânea de etinilestradiol e drospirenona em comprimidos
revestidos. O método foi realizado utilizando coluna LiChroCART® 100RP (125 x 4 mm d.i., 5 µm), a fase móvel constituída de acetonitrila:água, 50:50 (v/v) com vazão de 1,0 mL.min-1. A detecção foi realizada empregando luorescência em λex= 280 nm e λem= 310 nm para o etinilestradiol e na região de
UV em 200 nm para a drospirenona. O etinilestradiol e a drospirenona tiveram tempo de retenção de 4,0
e 5,7 min, respectivamente. O método foi validado de acordo com as diretrizes da USP 34. O método proposto apresentou vantagens sobre os relatados na literatura e pode ser considerado adequado para o controle de qualidade do etinilestradiol e da drospirenona em comprimidos revestidos.
Unitermos: Comprimidos revestidos/análise quantitativa. Cromatograia líquida de alta eiciência/ análise quantitativa. Etinilestradiol/determinação quantitativa. Drospirenona/determinação quantitativa. Detecção por luorescência. Detecção no UV.
INTRODUCTION
Contraception is achieved mainly by inhibiting ovulation through the combined activity of two main components: estrogen and progestin. In order to ensure wider adherence to contraception methods, recent advances in oral contraceptives focused on the development of
new formulations with fewer side effects and additional benefits, besides contraception (Brunton, Lazo, Parker, 2007; Pearlstein et al., 2005; Batukan, Muderris, 2006). New formulations have been developed by properly associating low doses of ethinyl estradiol and drospirenone
to ensure the balance between eficacy, safety and cycle
described in the literature for quantitative determination of associated hormones in various contraceptive formulations (Santoro et al., 2002; Labna et al., 2004; Denisova, Chistyakov, Sadchikova, 2008; Pradad, Babu, Ramana, 2011). However, no analytical method was found in the literature for simultaneous quantitative determination of ethinyl estradiol (Figure 1A) and drospirenone (Figure 1B). The present study describes a simple, accurate and reliable validated analytical method for separation and simultaneous quantification of ethinyl estradiol and drospirenone in coated tablets using HPLC with UV and fluorescence detection. The method can be used in routine analysis for quality control of these pharmaceutical preparations.
MATERIAL AND METHODS
Instrumentation and analytical conditions
Chromatographic experiments were performed using a Shimadzu liquid chromatographic system consisting of a solvent delivery pump system model SCL-10Avp, an online degasification system model
DGU-14A, an auto-injector model SIL-10AD-vp (itted
with a 50 µL loop), a UV detector model SPD-M10Avp
and a luorescence detector model RF-10Axl. The output
signal was monitored and integrated using CLASS VP®
software LC Workstation (Shimadzu® Corporation, Japan).
Chromatographic separation of analytes was achieved using a LiChroCART® analytical column (125x4 mm i.d., 5 µm particle size). The luorescence excitation and
emission wavelengths were set at 280 and 310 nm for ethinyl estradiol and a UV detection was carried out at 200 nm for drospirenone. The mobile phase was composed of acetonitrile and water in the ratio of 50:50 (v/v). The mobile phase was prepared at the beginning of the day and degassed by sonication for 20 min. All samples
were iltered through a 0.45 μm Millex® HV membrane.
All measurements were carried out with an injection
volume of 20 μL and the mobile phase low rate was set at
1.0 mL.min-1. All analyses were performed at 25 ± 1 °C.
Chemicals
All reagents were of analytical grade. Acetonitrile and methanol (HPLC grade) were obtained from J.T. Baker® (Phillisburg, NJ, USA) and ultrapure water was
obtained using a Milli-Q® water purification system
(Millipore®, MA, USA) and used to prepare all the
solutions.
Reference Standards
Ethinyl estradiol (99.60% purity) and drospirenone (99.80% purity) were kindly supplied by a local pharmaceutical industry.
Samples
Three samples containing ethinyl estradiol and drospirenone were kindly supplied by a pharmaceutical industry. Samples: 1 and 3 were from two available batches containing 0.03 mg of ethinyl estradiol and 3.00 mg of drospirenone; sample 2: containing 0.02 mg of ethinyl estradiol and 3.00 mg of drospirenone and sample 4: simulated sample (spiked sample) containing a mixture of the inactive ingredients and, ethinyl estradiol and drospirenone standards (50, 100 and 150% of nominal concentration of analytes). A placebo sample was prepared containing: povidone 3.0%, starch 15.0%, croscarmellose sodium 1.0%, magnesium stearate 1.0%, macrogol 0.3%, hypromelose 2.0%, dye sunset yellow 0.0001% and lactose q.s.p. 100%.
PREPARATION OF STANDARD SOLUTION
Standard stock solutions of ethinyl estradiol (100.00 µg.mL-1) and drospirenone (2000.00 µg.mL-1)
were prepared in methanol. Working standard solutions were prepared daily. Test solutions were prepared by appropriately diluting the stock solutions with a mixture of acetonitrile: water (50:50 v/v).
Preparation of sample solution
Twenty one coated tablets (sample 1, 2 and 3) were individually weighed and the mean weight was determined. All the 21 units were triturated and an amount of powder correspondent to 10 coated tablets was weighed and used for stock sample solution preparation. The
powder was transferred to a 25 mL volumetric lask and
solubilized in methanol. This mixture was sonicated for 20 min and centrifuged at 1923.07 g for 15 min. The upper FIGURE 1 - Chemical structures of ethinyl estradiol (A) and
and 750.0 µg.mL-1 of ethinyl estradiol and drospirenone,
respectively) to establish the intra-day precision. The results were analyzed by ANOVA.
• Intermediate precision (inter-day)
The intermediate precision refers to the ability of the proposed method to reproduce measurements between different day’s within-laboratory variation, amongst different analysts or equipment from the same laboratory (USP, 2011). Inter-day precision was evaluated by injecting samples solutions prepared at lower, middle and higher concentrations of the analytical curve, on three consecutive days. All determinations were made in triplicate.
• Instrumental precision
Instrumental precision was performed to demonstrate the repeatability of retention time of analytes and corresponding areas. In this case, six determinations were performed, in triplicate, at the nominal working concentration (5.00 µg.mL-1 and 750.0 µg.mL-1 of ethinyl
estradiol and drospirenone, respectively) on a single day. The repeatability of complete validation measurements was evaluated.
Precision was expressed as the percentage of relative standard deviation (%RSD) for peak area ratio (PAR) of ethinyl estradiol and drospirenone.
Accuracy
Accuracy is measured and expressed as percentage of standard analyte recovered from sample matrix by proposed assay procedure. Most often sample solutions are spiked with a known amount of standard (USP, 2011). The accuracy of method was evaluated in triplicate at three concentration levels, 50, 100 and 150% of nominal concentration of analyte. Standards solutions were added to the placebo and analyzed by the proposed method.
Robustness
The robustness of a method is its capacity to remain unaffected by smallvariations in method parameters (ICH 2005). In this study, the robustness of the method was evaluated based on following three chromatographic
parameters: low rate (1.0 ± 0.1 mL.min-1), temperature
(25 ± 3 °C) and proportion of acetonitrile (50 ± 5%) in the mobile phase. The resolution between peaks parameter was examined, in triplicate, at previously fixed levels, above (+) and below (-) the nominal value.
Specificity
Speciicity is the ability to measure accurately and layer was then iltered using a 0.45 µm ilter (Millipore®).
Aliquots of stock sample solution were diluted in acetonitrile:water (50:50 v/v) to obtain concentration of 2.50 µg.mL-1, 5.00 µg.mL-1 and 7.50 µg.mL-1 for
ethinyl estradiol and 250.00 µg.mL-1, 500.00 µg.mL-1
and 750.00 µg.mL-1 for drospirenone for samples 1 and 3.
Sample 2 was also diluted in acetonitrile:water (50:50 v/v) to obtain concentration of 2.50 µg.mL-1, 5.00 µg.mL-1 and
7.50 µg.mL-1 of ethinyl estradiol and 375.00 µg.mL-1,
750.00 µg.mL-1 and 1125.00 µg.mL-1 of drospirenone.
Method validation
The method was validated according to the United States Pharmacopeia recommendations (USP, 2011) and AOAC INTERNATIONAL (AOAC, 2007). The following validation characteristics were addressed: linearity,
detection limit, quantiication limit, precision, accuracy, robustness and speciicity.
Linearity
The linearity of an analytical procedure is its
ability, within a deinite range, to obtain results directly
proportional to the concentration of the analyte in the sample (USP, 2011). Since the nominal concentration for the assay test is 5.00 µg.mL-1 and 750.00 µg.mL-1 for
ethinyl estradiol and drospirenone, respectively, linearity was performed using six concentrations over the range of 0.10 to 10.00 µg.mL-1 for ethinyl estradiol and from
15.00 to 1500.00 µg.mL-1 for drospirenone. The solutions were iltered using a 0.45 µm ilter (Millipore®) and each
solution was injected in triplicate into the chromatographic system. The analytical curve was evaluated by plotting concentration versus mean area. The equation was obtained using the least square regression procedure.
Detection limits (DL) and quantitation limits (QL)
DL and QL for the proposed analytical method were determined based on residual standard deviation of
regression line (σ) and slope (s) of the analytical curve
in accordance with the equations DL= 3.3 (σ/S) and
QL=10 (σ/S) (USP, 2011). The detection results using UV
and luorescence detection were compared.
Precision
• Repeatability (intra-day)
speciically the analyte of interest in the presence of other
components that may be expected to be present in the sample (USP, 2011; Ribani et al., 2004). The speciicity of
the method was tested by comparing the chromatograms of placebo, commercially available sample and standard solutions. Excipients used to prepare the placebo were similar to those present in the commercial formulations.
RESULTS AND DISCUSSION
Selection of the HPLC conditions
In order to obtain adequate separation and short time of analysis, different mobile phases were evaluated. Several strategies were tested to achieve a resolution
(Rs)≥2 and short analysis time. Several proportions of
acetonitrile:water and methanol:water in the mobile phase were tested. The methanol provided longer retention time and for that reason acetonitrile was selected for further method development. The best response was obtained with mobile phase constituted of acetonitrile:water (50:50 v/v),
low rate of 1.0 mL.min-1 and injection volume of 20 µL.
The temperature was set at 25 ± 1 °C. Total run time was of 7 min and Rs = 5.84. Replicate (n=10) injections were made to ensure reproducibility and accuracy of measurements.
Detection
The use of fluorimetric detection allowed better
quantiication of ethinyl estradiol than the UV detection
(Araujo, 2006). Nevertheless, drospirenone has no
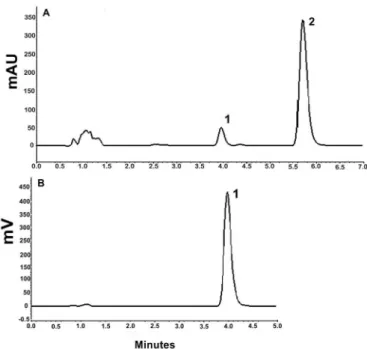
luorescence (Figure 2). Hence, quantitative determination
of drospirenone was made by using UV detection (Figure 3).
Method validation
According to the USP (2011), method validation is performed to ensure that an analytical methodology is accurate, specific, reproducible, and rugged over
the speciied concentration range and within described
analytical conditions.
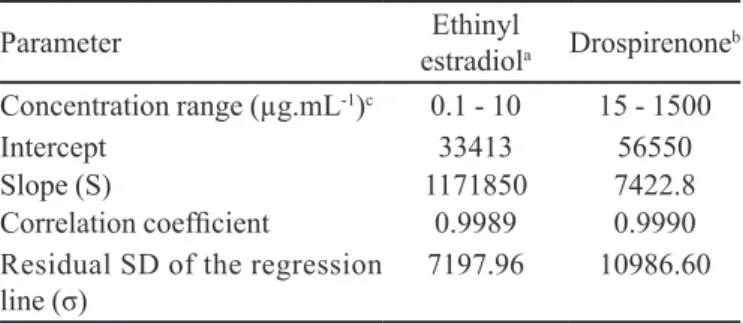
Linearity, detection and quantification limits
Analytical curves were obtained using six points and triplicate injection of standards at each concentration level. The method showed excellent linearity over a defined concentration range with correlation coefficient better than 0.999 (Table I).
Data provides conclusive evidence of a linear relationship between concentration and method response.
FIGURE 2 - Chromatograms of standard solutions. HPLC-UV detection at 200 nm (A), and HPLC-Fluorescence detection at
λex=280 nm and λem=310 nm (B). Concentration: 5.00 µg.mL
-1
of ethinyl estradiol (1) and 750.00 µg.mL-1 of drospirenone (2).
Chromatographic conditions: LiChroCART® column (125 mm x
4 mm i.d., 5 µm particle size), mobile phase: acetonitrile:water
(50:50 v/v), low rate 1.0 mL.min-1, injection volume: 20 µL,
temperature 25 ± 1 °C.
FIGURE 3 - Chromatograms of placebo solution (A), standard solution at 5.00 µg.mL-1 of ethinyl estradiol (1)
and 750.00 µg.mL-1 of drospirenone (2) (B), and sample
solution 5.00µg.mL-1 of ethinyl estradiol (1) and 750.00
µg.mL-1 of drospirenone (2) (C).Chromatographic conditions:
LiChroCART® column (125 mm x 4 mm i.d., 5 µm particle size), mobile phase: acetonitrile:water (50:50 v/v), low rate: 1.0 mL.min-1, injection volume: 20 µL, temperature: 25 ± 1 °C.
The DL and QL for drospirenone were 4.88 µg.mL-1 and
14.80 µg.mL-1, respectively. For ethinyl estradiol, DL and
QL were compared using two types of detectors. Results
obtained using luorescence detection (DL 0.02 µg.mL-1
and QL 0.06 µg.mL-1) were better than those obtained with
UV detection (DL 0.14 µg.mL-1 and QL 0.41 µg.mL-1)
(Table II).
Precision
The precision of an analytical method gives information on method random error. It expresses the closeness between a series of measurement obtained from multiple sampling of the same homogeneous sample under TABLE I - Statistical data from the analytical curve for the proposed HPLC method
Parameter Ethinyl
estradiola Drospirenone b
Concentration range (µg.mL-1)c 0.1 - 10 15 - 1500
Intercept 33413 56550
Slope (S) 1171850 7422.8
Correlation coeficient 0.9989 0.9990
Residual SD of the regression
line (σ) 7197.96 10986.60
a Fluorescence detection; b UV detection; c six data points,
triplicate injection at each concentration level
TABLE II - Results obtained for DL and QL by using two detectors: UV and luorescence
HPLC-UV DL (µg.mL-1) QL (µg.mL-1)
Ethinyl estradiol 0.14 0.41
Drospirenone 4.88 14.80
HPLC-Fluorescence DL (µg.mL-1) QL (µg.mL-1)
Ethinyl estradiol 0.02 0.06
described conditions (Laban, 2004). One way ANOVA (single factor) was used for estimating the total variability of ethinyl estradiol and drospirenone intra-day precision. F value calculated for ethinyl estradiol and drospirenone by ANOVA was 1.95 and 2.59, respectively. The value was lower than the critical factor3.10, showing that the
method do not present statistical signiicant difference amongst distinct measurements (p ≤ 0.05). The results
of % RSD, were 1.00 and 1.12% for ethinyl estradiol and drospirenone, respectively (intra-day precision). The criteria for intra-day and inter-day precision demands a %RSD lower than 2.0% (USP, 2011).
The % RSD inter-day precision was obtained by analyzing sample solution in lower, middle and higher concentration (nine replicates each day) on three consecutive days. The % RSD values ranged from 0.61 to 1.74%. These results indicate that the developed method presents good precision.
Instrumental precision was calculated as %RSD. For migration time and peak area of 18 runs, the values were 0.17% and 1.06% for ethinyl estradiol and 0.31% and 1.97% for drospirenone, respectively. The precision of injection was therefore considered satisfactory.
The repeatability of the complete validation calculated as % RSD for migration time and peak area (approximately 180 runs) was 1.63% and 1.32% for ethinyl estradiol and 1.95% and 1.86% for drospirenone, respectively. The results obtained in the analysis of commercially available samples are shown in Table III.
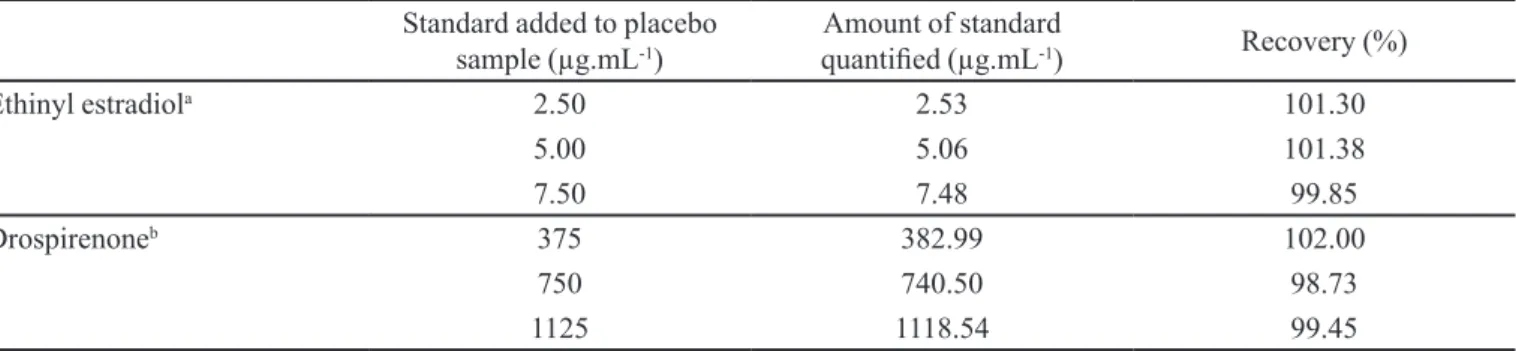
Accuracy
The accuracy was determined by recovery test and results are presented in Table IV. The recovery of ethinyl estradiol standard was from 99.85% to 101.38%, and for drospirenone was from 98.70% to 102.00%. The recovery test and the percentage of recovery
TABLE III - Statistical representation of the data obtained in the analysis of commercial available samples (1, 2 and 3) using the proposed HPLC method
Sample Declared amount (µg/unit)
Found amount (µg/unit)
Relative standard desviation (%)
Result (%)
1 Ethinyl estradiola 30 29.22 0.57 97.40
Drospirenoneb 3000 2859.30 0.37 95.30
2 Ethinyl estradiola 20 21.45 0.96 107.26
Drospirenoneb 3000 2889.3 0.99 96.31
3 Ethinyl estradiola 30 32.37 0.18 107.91
Drospirenoneb 3000 2901 0.34 96.70
were performed according to the recommendation of AOAC INTERNATIONAL (100 ± 2%) (AOAC, 2007). The obtained results confirmed the accuracy of the method.
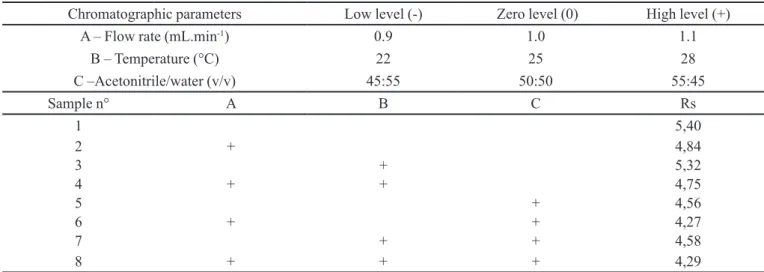
Robustness
The result and the experimental range of the selected variables are presented in Table V, including the established experimental conditions (1.0 mL.min-1, 25 °C, acetonitrile 50%). There were no signiicant changes in the chromatographic pattern when the modiications were
made in the experimental conditions.
The established experimental conditions presented a resolution of 5.84. Different resolution values were
obtained with the modiication of each factor, but none of them compromised the method (Rs ≥ 2) (Ribani et al., 2004). The results presented in Table VI shows that the
temperature has no signiicant effect on resolution and that
the resolution increases with the decrease of mobile phase flow rate and acetonitrile concentration. Thus, within
speciied analytical conditions, the proposed method was
considered robust.
Specificity
The specificity of the method was demonstrated by the absence of interference during measurements of ethinyl estradiol and drospirenone. The interference criterion for assays, especially from sample excipients,
is deined in USP 2011. It was observed that excipients
do not present overlapping peaks with ethinyl estradiol and drospirenone peaks, hence do not interfere in the method. Figure 3 shows that despite the presence of the peaks of the pharmaceutical formulation components (excipients), peaks of ethinyl estradiol and drospirenone were satisfactorily separated.
CONCLUSION
The proposed HPLC method enables the separation and simultaneous quantitative determination of ethinyl estradiol and drospirenone in coated tablets. The detection and quantitative determination of ethinyl estradiol in the presence of drospirenone is extremely difficulty due to enlarged concentration ratio (1:100). Although UV detection of ethinyl estradiol is possible, the use of TABLE IV - Recovery of standard ethinyl estradiol and drospirenone solution added to placebo and analyzed by the proposed HPLC method
Standard added to placebo sample (µg.mL-1)
Amount of standard
quantiied (µg.mL-1) Recovery (%)
Ethinyl estradiola 2.50 2.53 101.30
5.00 5.06 101.38
7.50 7.48 99.85
Drospirenoneb 375 382.99 102.00
750 740.50 98.73
1125 1118.54 99.45
a Fluorescence detection; b UV detection
TABLE V - Chromatographic conditions and range investigated during robustness testing
Parameter Range Investigationc Ethinyl estradiol (%)a Drospirenone (%)b
Flow rate (mL.min-1) 0.8 100.91 99.81
1.0 100.07 100.45
1.2 100.33 98.95
Temperature (°C) 22 101.53 100.34
25 100.73 99.75
28 99.76 100.95
Proportion of acetonitrile (%) 45 101.36 99.75
50 99.76 100.53
55 100.53 101.20
TABLE VI - Chromatographic parameters used for robustnessdetermination
Chromatographic parameters Low level (-) Zero level (0) High level (+)
A – Flow rate (mL.min-1) 0.9 1.0 1.1
B – Temperature (°C) 22 25 28
C –Acetonitrile/water (v/v) 45:55 50:50 55:45
Sample n° A B C Rs
1 5,40
2 + 4,84
3 + 5,32
4 + + 4,75
5 + 4,56
6 + + 4,27
7 + + 4,58
8 + + + 4,29
fluorescence detection allowed a better quantification of ethinyl estradiol in low amounts. A new method was developed and fully validated with critical evaluation of
speciicity, injection precision, linearity, detection and
quantitation limits, precision, accuracy and robustness, presented adequate performance characteristics. The simplicity of the method allows its use in quality control laboratories for routine analysis.
ACKNOWLEDGEMENTS
The authors thank the Conselho Nacional de
Desenvolvimento Cientíico e Tecnológico (CNPq) and Fundação de Amparo à Pesquisa do Estado de São Paulo (FAPESP) for inancial support.
REFERENCES
ARAÚJO, J.C. Estudo da eiciência do tratamento de eluentes domésticos da cidade de Araraquara na remoção de hormônios sexuais. São Carlos, 2006. 83 p. [Dissertação de Mestrado,Instituto de Química de São Carlos,Universidade de São Paulo].
ASSOCIATION OF OFFICIAL ANALYTICAL CHEMISTS INTERNATIONAL. Oficial methods of analysis of AOAC International. 18.ed. Gaithersburg, 2007. p.25.
BATUKAN, C.; MUDERRIS, I.I. Efficacy of a new oral contraceptive containing drospirenone and ethinyl estradiol in the long-term treatment of hirsutism. Fertil. Steril., v.85, n.2, p.436-440, 2006.
B A Z Z O T E , R . B .; S C H E L E I C H E R , F.; M A R C O N ,
A. Aspectos farmacológicos e clínicos de um novo
contraceptivo oral contendo drospirenona como componente progestinico. Arq. Cienc. Saúde UNIPAR, v.9, n.1, p.37-40, 2005.
B L O D E, H.; W U T T K E, W.; L O O C K, W.; R O L L, G.; HEITHERCHER, R. A 1-year pharmacokinetic investigation of a novel oral contraceptive containing drospirenone in healthy female volunteers. Eur. J. Contracept. Reprod. Health
Care., v.5, n.4, p.256-264, 2000.
B R U N TO N, L.L.;L A Z O, J.S.; PA R K E R, K.L.(Eds.) Goodman and Gilman: As bases farmacológicas da
terapêutica. 11.ed. Rio de Janeiro: McGraw-Hill, 2007.
1821 p.
DENISOVA, T.A.; CHISTYAKOV, V.V.; SADCHIKOVA, N.P. Quantitative estimation of components of combined hormonal contraceptives by HPLC. Pharm. Chem. J., v.42, n.5, p.40-42, 2008.
INTERNATIONAL CONFERENCE ON HARMONIZATION. Technical Requirement for Registration of Pharmaceuticals for Human Use. Topic Q2 (R1): Validation of Analytical Procedures: Text and Methodology. Geneva: ICH, 2005. 17 p. / Available at: http:www.ich.org/ileadmin/Public_ Web_Site/ICH_Products/Guidelines/Quality/Q2_R1/Step4/ Q2_R1_Guideline.pdf.Accessed on: May, 21,2012.
P E A R L S T E I N, T.B.; B A C H M A N N, G.A.; Z A C U R, H.A.; YONKERS, K.A. Treatment of premenstrual dysphoric disorder with a new drospirenone-containing oral contraceptive formulation. Contraception, v.72, n.6, p.414-421, 2005.
PRADAD, G.R.; BABU, P.S.; RAMANA, M.V. Validated RP-HPLC method for the estimation of drospirenone in formulation. Int. J. Adv. Pharm. Sci., v.2, n.2, p.239-243, 2011.
R I B A N I , M .; B O T T O L I , C . B . G .; C O L L I N S , C . H .; JARDIM, I.C.S.F.; MELLO, L.F.C. Validação em métodos
cromatográicos e eletroforéticos. Quím. Nova, v.27, n.5,
p.771-780, 2004.
SANTORO, M.I.R.M.; KASSAB, N.M.; HASEGAWA, M.; KEDOR-HACKMANN, E.R.M. Determination of steroid hormones in oral contraceptives by high-performance liquid chromatography. Drug. Dev. Ind. Pharm., v.28, n.6, p.741-747, 2002.
UNITED STATES PHARMACOPEIA. The United States Pharmacopeial Convention. 34.ed. Rockville, 2011. p.2872-3019.
Received for publication on 10th July 2012