Consumer Satisfaction with Water, Wastewater
and Waste Services in Portugal
∗
Karoline Hormann
∗∗January 2016
Abstract
While the concept of consumer satisfaction is a central topic in modern marketing theory and practice, citizens’ satisfaction with public services, and especially water and waste services, is a field that still remains empiri-cally rather unexplored. The following study aims to contribute to this area by analysing the determinants of user satisfaction in the water, wastewater and waste sector in Portugal, using a unique survey of 1070 consumers un-dertaken by the Portuguese Water and Waste Regulator ERSAR. I perform an analysis of the relation between overall service satisfaction and attribute-specific service satisfaction with an ordered logit model. I then explore if subjective consumer satisfaction can be reflected by ERSAR’s technical per-formance indicators. The results suggest that overall consumer satisfaction is driven by consumer’s satisfaction with specific service aspects but un-related to socioeconomic and demographic characteristics. Furthermore, I show that there is no monotonic association between ERSAR’s technical performance indicators and consumers’ levels of satisfaction.
Keywords: Consumer Satisfaction, Public Utilities, Water and Waste Sector, ERSAR
∗The author is deeply grateful to Prof. Susana Peralta (Nova SBE) for her guidance
through-out this research study. I also thank the entire Strategic Projects Department of ERSAR for the invaluable support and advice.
∗∗Master’s student in Economics, Nova School of Business and Economics. Campus de
Contents
1 Objective of the Study 3
2 Introduction 3
2.1 Defining Consumer Satisfaction . . . 4
2.2 Empirical Studies with an Econometric Approach . . . 4
2.3 Objective vs. Subjective Perception of Service Quality . . . 5
3 The Water and Waste Sector in Portugal 6 4 ERSAR 7 5 Empirical Analysis 8 5.1 Consumer Satisfaction Survey . . . 8
5.2 Analysing the Importance of Specific Service Aspects for Overall Consumer Satisfaction . . . 11
5.3 Main Drivers of Consumer Satisfaction . . . 15
5.4 Technical Indicators on Service Quality . . . 18
5.5 Estimating the Relationship between Consumer Satisfaction and Technical Indicators . . . 19
5.6 Consumers are not Technicians: Technical Indicators do not capture Consumer Satisfaction . . . 21
6 Conclusions 23
List of Tables
1 Demographics of Respondents . . . 92 ERSAR Survey Questions . . . 14
3 Odds Ratios for Global Satisfaction . . . 16
4 Marginal Effects on Global Satisfaction . . . 17
5 Technical Performance Indicators . . . 20
6 Spearman Correlation, Drinking Water . . . 21
7 Spearman Correlation, Wastewater . . . 22
8 Spearman Correlation, Waste . . . 22
1
Objective of the Study
This work project was carried out in collaboration with the Portuguese Water and Waste Services Regulation Authority ERSAR. The objective was to analyse data from a pilot national consumer satisfaction survey in order to understand which service aspects influence the overall consumer satisfaction in each of the three sectors regulated by ERSAR: water, wastewater and waste. Furthermore, ERSAR was interested in the relation between consumers’ perceptions and technical key performance indicators that the regulator uses as benchmarking tool for service quality. Consumer protection but also consumer satisfaction are main concerns of ERSAR. Therefore, it is important to understand if their objective measurements reflect the opinion of the consumers. In addition, this study can serve as a source of improvement for the design of ERSAR’s consumer satisfaction surveys in the future.
2
Introduction
Any firm would most probably agree on the importance of a satisfied consumer in a competitive market. Numerous studies provide evidence that consumer satisfac-tion is positively linked to economic returns and brand loyalty. Consequently, it has become a key concern in the modern business world [1]. Also public entities and regulators are increasingly interested in the subject, but having a rather different motivation than profit maximization. By understanding the level of satisfaction of consumers, regulators have the chance to positively influence their policies by shift-ing the perspective from the supply- to the demand-side. While service outputs and service outcomes are traditionally the two prevailing mechanisms to assess the performance of public services, consumer satisfaction has become a popular strat-egy to access the quality of services and institutional efficiency and to encourage service providers to improve their performance [17]. At the European level, the European Commission recently acknowledged the need to incorporate consumers’ perspective into the design of service regulations, following an OCED recommen-dation [9]. In the context of citizen participation, consumer satisfaction surveys have become a new tactic for citizen involvement with public services. They have been applied by a great number of governments, such as in the UK within the framework of the “Citizen’s Charter” [19].
and gas industries in Northern Ireland, demonstrate that the trend is to include consumer satisfaction as a meaningful indicator about service quality next to tech-nical performance indicators [31]. Vloerberg et al (2008) provide an overview of recent literature findings regarding consumer satisfaction with drinking water ser-vices. The report reveals that consumer satisfaction surveys are a frequent tool for regulators and service providers, but since researchers devised various indicator systems and instruments for consumer satisfaction on drinking water services, it is not possible to draw general conclusions from these studies. Interestingly, the report provides evidence that consumers tend to be rather satisfied with quality water services, and especially in countries with well-developed water systems. The authors see one reason in the little interest of consumers to know about details of water quality and related services. Water is considered to be a low-involvement product and questionnaires inquiring about the satisfaction of low-involvement services and products often result in “satisfied” [15].
2.1
Defining Consumer Satisfaction
Consumer satisfaction is a rather abstract concept and the literature offers a wide amount of related explanations and concepts. Nowadays, a popular and widely used model in satisfaction research is the expectancy-disconfirmation model. It suggests that satisfaction or dissatisfaction is experienced by relating prior expec-tations with regards to a service or product with confirmations or disconfirmations of these expectations when making the actual experience with the service or prod-uct [36]. The findings of empirical studies with data from public services have been largely supportive to this theory, suggesting that satisfaction with public ser-vices is related to citizen’s expectations. Parasuraman, Zeithaml and Berry (1988) incorporated the expectancy-disconfirmation model into a general survey frame-work for the assessment of service quality. The authors argue that service quality is an elusive construct because of its unique features, intangibility, heterogeneity and inseparability of production and consumption. Therefore, it is essential to conduct surveys that allow to measure consumer satisfaction by identifying the gap between expectations and experience. The SERVQUAL model, that based on five dimensions: tangibility quality, reliability quality, responsiveness quality, assurance quality and empathy quality, is nowadays one of the most common tools for marketing researchers in this area [26][27].
2.2
Empirical Studies with an Econometric Approach
models such as ordered logit and binary logit models are often used by researchers to evaluate consumer satisfaction surveys, research on public utilities is still scare and has mainly focused on the public health sector (see for example [20][24]). For the water sector, the study of V´asquez et al. (2012) explores the determi-nants of citizen satisfaction with water services in Le´on, Nicaragua. By using a generalized ordered logit model, the findings indicate that consumer satisfaction is influenced by the satisfaction with specific service characteristics and dissoci-ated with personal characteristics. Furthermore, the results reveal that overall consumer satisfaction is influenced by consumers’ perception about the water ser-vices received by their peers [38]. In contrast, Myburgh et al (2005) found that socioeconomic characteristics significantly influence the patient satisfaction with health care providers in South Africa [23].
2.3
Objective vs. Subjective Perception of Service Quality
The issue of whether objective service indicators can reflect citizen satisfaction with public services is the object of an ongoing discussion, and studies often have not yield consistent results in favour of a direct relationship [18]. Brown et al. (1983) applied a multiple regression analysis to survey data about policy services in Alabama, US, and show that sector specific attributes influence the overall sat-isfaction with police services. However, they found that subjective perceptions are unrelated to actual objective measures. Hence, satisfaction with response time was unrelated to actual mean response time of the police in the neighbourhood. The authors explain this result with the expectation-disconfirmation model presented above. They argue that citizens evaluate objective service conditions through their subjective service expectations [4]. The studies of Roch (2006) and Ryzin (2004) confirm that citizen satisfaction is influenced by both, perceived service quality and their expectations, when asked about utility services, including waste services [33][37]. Variations in consumer satisfaction with services therefore may reflect differences between expectations rather than between service qualities themselves.
3
The Water and Waste Sector in Portugal
As in many other countries, the water and waste sector in Portugal is a stabilized market that is characterized by its complexity in terms of market structure and offered services. In 2014, the sector included 360 drinking water suppliers, 283 ur-ban wastewater operators and 281 municipal waste management entities, serving about 10 million people in mainland Portugal.
The services within the water and waste management sector in Portugal can be divided into two categories: bulk services and retail services. For the water sec-tor, water collection, treatment, and drinking water transportation to a general hydraulic system is done at the bulk level. Retail operators are in charge of the dis-tribution of drinking water to the end-consumers and the drainage of wastewater. Afterwards, wastewater is treated and delivered to its final destination by the bulk operator. Compared to the water sector, the different stages at the waste sector are more complex, since waste can be differentiated into several waste streams that are treated in distinct ways. The entity that operates at the retail level serves as the waste collector, while valorization and waste elimination are done by the bulk operator. The responsibility for the bulk services (multi-municipal services) are at the central government level and the municipalities are in charge of the retail services at municipal level.
The central government and municipalities can decide between three different models of management of the water and waste sector at both levels: direct man-agement, delegation and concession. They are able to cooperate with the private sector by either delegating the management or collaborating with the private sec-tor by creating a common company that provides public services.
For 2014, for drinking water supply services, multi-municipal concessions were the most important management model at the bulk level, including 167 municipalities with a total of 4.9 million habitants (69% of the population). As an exception, 1.8 million people in the Lisbon area were served by EPAL, Empresa Portuguesa de
´
Due to the low population density in some regions of mainland Portugal, retail services are provided by a high number of entities serving a relatively small number of people in all there sectors. This high fragmentation causes that entities cannot take advantage of economies of scale while having high operational costs [10].
4
ERSAR
ERSAR (Portuguese: Entidade Reguladora dos Servi¸cos de ´Aguas e Res´ıduos) is the Portuguese Water and Waste Services Regulation Authority with headquar-ter in Lisbon, Portugal. The institute emerged in 2009 from IRAR (Portuguese: Instiuto Regulador de ´Aguas e Res´ıduos), that had been the sector’s regulator since 1998. ERSAR is a public institute that operates under the supervision of the Ministry for Environment and Spatial Planning, while having financial and administrative autonomy. It regulates three essential public services, the drink-ing water supply service, the wastewater management service and the municipal waste service. Furthermore, it is the national authority for drinking water quality for all drinking water utilities in Portugal. ERSAR aims at protecting the con-sumers in Portugal by promoting an equal and transparent access to all services and by ensuring that general information about the sector and the operators is made available for the public.
ERSAR’s competences lie within the structural, economic and quality of service regulation. By assisting the Portuguese government with the elaboration of strate-gies for the water and waste sector and by monitoring their implementation, ER-SAR takes the role of a supervisor and ensures the stability of the sector. Further-more, ERSAR is given indirect control over operators’ behaviour as it can propose new legislation changes and is able to adopt new regulations that are binding for the sector. The institute has an important role as economic regulator since natural monopolies and legal monopolies, like in the water sector and waste sector, respec-tively, tend to have higher prices. ERSAR advocates social acceptable pricing while ensuring the economic and financial sustainability of the operators. In order to promote high quality of service, ERSAR adopted an evaluation mechanism that assesses operators’ behaviour with the help of 16 quality indicators, water quality being one of them. The results are published at the annual report on water and waste services in Portugal that is available for the public. Additionally, ERSAR offers service providers trainings and further technical support. It interacts with about 500 water and waste management operators.
5
Empirical Analysis
The main analysis uses household-level data drawn from a national survey on consumer satisfaction with water, wastewater and waste services in mainland Por-tugal. In a second step, this data is combined with indicators that describe the technical performance of all Portuguese operators in these sectors.
5.1
Consumer Satisfaction Survey
The survey data was collected in November and December 2014 in the framework of a pilot survey on consumer satisfaction ran by ERSAR. The regulator designed this study with the aim to get representative consumer-based evaluations about the entities and their services in the drinking water supply, urban wastewater management and urban waste management sector. The study consisted of two components: a household survey at the national (mainland Portugal) level and a household survey at the municipal level, conducted in six municipalities in main-land Portugal. For the purpose of the following analysis it was decided to focus on the data obtained from the national survey.
For the national study, a sample of 1070 households was drawn using a stratified random sampling method based on the NUTS 2 division of mainland Portugal.1
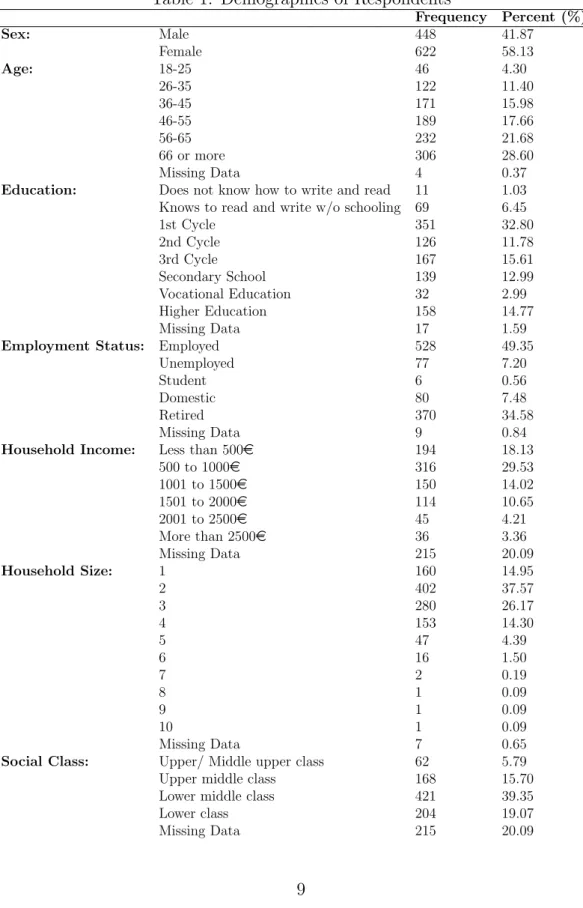
After identifying the number of households to be interviewed based on the share of population of each NUTS 2 region, respondents within each strata were ran-domly selected for a telephone interview. In order to participate in the survey, the contact person of a household had to be resident in mainland Portugal and be at least 18 years old. Furthermore, she must have been a user of all three services for more than one year and had to be familiar with the invoices of all services. These conditions were checked by asking the correspondents in the beginning of each interview. The sample was diverse as it included respondents of different age and gender, with distinct backgrounds in terms of education, employment and house-hold characteristics. The demographic composition of the participants is presented in Table 1.
The survey consisted of three main parts (one block of questions for each service sector) and a last part for demographic information about the respondent. Each of the service blocks contained a similar set of questions related to service satisfaction, perception about pricing, operator’s image, customer service and reclamations. In most cases, respondents were asked to answer on a scale from 1 to 7, whereby 1 represented the lowest and 7 the highest classification possible.
1
Table 1: Demographics of Respondents
Frequency Percent (%)
Sex: Male 448 41.87
Female 622 58.13
Age: 18-25 46 4.30
26-35 122 11.40
36-45 171 15.98
46-55 189 17.66
56-65 232 21.68
66 or more 306 28.60
Missing Data 4 0.37
Education: Does not know how to write and read 11 1.03 Knows to read and write w/o schooling 69 6.45
1st Cycle 351 32.80
2nd Cycle 126 11.78
3rd Cycle 167 15.61
Secondary School 139 12.99 Vocational Education 32 2.99 Higher Education 158 14.77
Missing Data 17 1.59
Employment Status: Employed 528 49.35
Unemployed 77 7.20
Student 6 0.56
Domestic 80 7.48
Retired 370 34.58
Missing Data 9 0.84
Household Income: Less than 500e 194 18.13 500 to 1000e 316 29.53
1001 to 1500e 150 14.02 1501 to 2000e 114 10.65
2001 to 2500e 45 4.21
More than 2500e 36 3.36
Missing Data 215 20.09
Household Size: 1 160 14.95
2 402 37.57
3 280 26.17
4 153 14.30
5 47 4.39
6 16 1.50
7 2 0.19
8 1 0.09
9 1 0.09
10 1 0.09
Missing Data 7 0.65
Social Class: Upper/ Middle upper class 62 5.79 Upper middle class 168 15.70 Lower middle class 421 39.35
Lower class 204 19.07
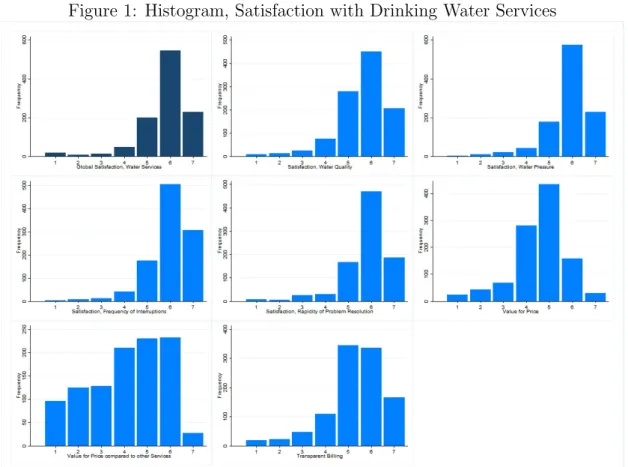
Figure 1: Histogram, Satisfaction with Drinking Water Services
Source: Own graphic based on survey data
Figure 1 shows the frequency distributions for satisfaction with drinking water services and illustrates that most of the questions, including the question about the global satisfaction, have a skewed left distribution. This means that the great majority of respondents are rather satisfied with overall water services and also with specific service attributes, such as the water quality. When comparing these results to other surveys that have been done in this sector, the bunching at the top end is not surprising. The literature suggests that consumers in developed coun-tries are rather satisfied with water services. For wastewater and waste services the distributions of answers look very similar to those of the water sector. Most of the questions that have been considered for the regression analysis have low standard deviation scores (between 1 and 1.7) and 6 is the most frequent median satisfaction score, followed by 5.2
2
5.2
Analysing the Importance of Specific Service Aspects
for Overall Consumer Satisfaction
In order to estimate the importance of the specific service aspects for the overall satisfaction in each of the sectors, the three main sections of the survey are analysed independently. For all models, the dependent variable is the overall service satis-faction and the independent variables are the attribute specific satissatis-faction levels plus individual characteristics. While recent studies on consumer satisfaction with survey data employ either ordinary least squares (OLS) methods or ordered probit (logit) models, the literature that compares the results of both methods suggests using the latter when the variable of interest is of ordinal nature as in the case of “Global Satisfaction” that takes values from 1 to 7 [29]. The OLS method would be biased and inefficient since it cannot provide the best linear unbiased estima-tors (BLUE) for categorical dependent variables, especially when the distribution is highly skewed [28]. Therefore, I decided to use an ordered regression model for the main analysis of the data. Since the differences between the probit and logit model are slight, the logit model is used for convenience [30].
There are different approaches to the ordered logit model that lead to the same form of the model. The ordered logit model, also called proportional odds model, can be seen either as a nonlinear probability model with a cumulative standard logistic distribution or as a latent variable model. The basic idea behind the latter is that an observed ordinal variable Y (with numerical values of a rating scale) is a function of an unobserved variable Y*. The continuous latent variable Y* has various threshold points and the values of Y depend on where Y* is located within the thresholds limits. The ordered logit model estimates the probability that the unobserved variable Y* falls within the various threshold limits, leading Y to take the specific values of the rating scale [21].
number of categories even if the sample size is small. He shows that a change in the outcome categories frequently influence the odds ratio estimate and the inferences drawn, and recommends to keep at least three categories, rather than collapsing categories into a binary variable [22].
In order to answer the question if it is necessary to collapse the categories of the independent variable I make use of the proportional odds assumption, a condition that has to hold for all ordered logit models.3
The proportional odds assumption, also called parallel regression assumption, states that the probability curves for all outcomes are parallel. This means that the coefficients for the relationship between category 1 and all higher categories are identical to those that describe the relation between category 2 and all higher categories (the relationship between all possible pairs of groups of categories is the same) [21][14]. This assumption can be tested by the Brant test, a Wald test that was developed by Rollin Brant in 1990. At the first stage, the Brant test produces binary logits on cumulative probabilities (starting with a dependent variable with binary outcome “category 1” vs. “category 2 + 3”, etc.). Afterwards, it tests for the equality of the estimated coefficients of all regressions. A highly significant test statistic means that the coefficients of the logit regressions substantially differ. Consequently, the parallel odds assumption does not hold [5].
The first ordered logit model to be tested has a dependent variable that keeps the original 7 outcomes while treating the independent variables as continuous. When testing in any direction, adding and dropping individual specific variables as well as specific satisfaction variables, the Brant test has for all three sectors a highly significant test statistic. The ordered logit model with these categories should therefore not be used [21]. This result is not surprising. In fact, the pro-portional odds assumption is often violated in practice since it is very sensitive to the sample size and the number of covariate patterns [25].
In order reduce the number of logit regressions of the Brant test and increase the probability that the parallel odds assumption holds, I collapse the outcome cat-egories and test several combinations keeping in mind the distribution for global satisfaction. The model that performs best and is the only one that provides in-significant Brant test statistics is a model with three outcome categories. The first three categories (1,2 and 3) are collapsed into one single category containing all people that are rather unsatisfied. The fourth category (4) is the neutral response of the ranking and keeps its category. And the last three categories (5, 6 and 7), that stand for rather satisfied, are collapsed into one category as well. This combi-nation appears to be logical since category 4 is the theoretical midpoint of the scale.
3
In terms of predictors, I follow Lee et al.(2009)and Peel(1998) treating the vari-ables related to attribute specific satisfaction as continuous [20][29]. This method comes with the trade-off of losing information.4
Nevertheless, given the distribu-tion and sample size, it seems to be the most appropriate method for the given data. Treating variables as categorical always comes along with a significant in-crease of predictors because it results in the creation of n-1 dummy variables for n categories. Having this and the high bunching on top of the data in mind, it is not surprising that the parallel odds assumption does not hold for all sectors when treating the data as categorical. 5
While this topic is highly debated in the literature, a recent study of Rhemtulla et al (2012) point out that regressions with continuous variables will produce acceptable results when the number of categories is 5 or higher [32]. In addition, continuous predictors simplify the interpretation of the estimates.
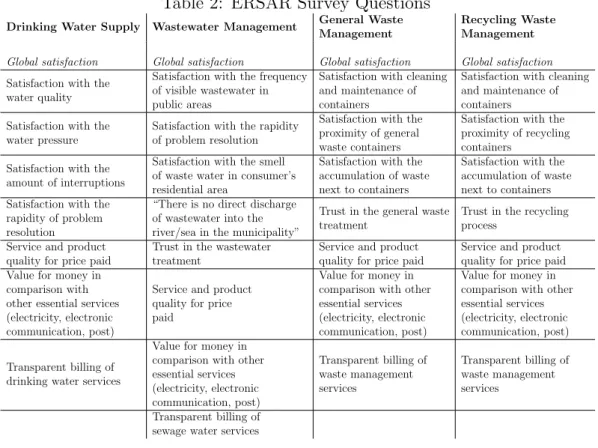
With regard to the service specific satisfaction, not all questions from the ques-tionnaire are used for the analysis. Questions that were only asked when the respondent had contacted the service provider before are discarded since their inclusion would lead to a substantial reduction of observations. In the case of wastewater services, just 36 out of 1070 contacted the entity before. Also ques-tions for which one would rather expect a yes/no answer instead of a Likert scale are not considered for further analysis since the answer might not be reliable. This is for example the case for the statement “It is easy to inform myself about the quality of water”.
A more general problem with the predictors is endogeneity. In this context, it is possible that consumers are driven by an unknown variable that influences both global satisfaction and attribute specific satisfaction. Being aware of the high po-tential for endogeneity with this data, I try to minimize this risk by excluding the question “Did you contact your service provider before?”. Here, the unknown motivation of calling might have influenced the overall satisfaction as well. Al-though endogeneity is a potential problem, using attribute specific satisfaction as covariates of global satisfaction is a common strategy in the empirical satisfaction literature (see for example Eboli and Mazzulla (2009) [11]).
In addition to attribute-specific satisfaction of services, each regression model
4
Long and Freese (2001) recommend the usage of a likelihood ratio test to check whether categorical independent variables can be treated as intervals. When applying this test to the ERSAR data, it turns out that a transformation from categorical to continuous variables leads to a loss of information about the association between the independent and dependent variable [21].
5
includes a set of variables related to the individual characteristics. I include gender (female =1), age and two dummy variables for the monthly household income (more than 1000e=1) and the educational background (secondary education and
higher =1) in order to check if socio-economic and demographic characteristics have an influence on the overall satisfaction of consumers. In the case of drinking water services, it was decided to extend the model by including dummies for the region.6
Table 2 describes the service related questions that are included in the final regression model for each sector. Based on the nature of the waste sector, it was decided to estimate two separate regressions for general waste and recycling waste.
Table 2: ERSAR Survey Questions
Drinking Water Supply Wastewater Management General Waste
Management
Recycling Waste Management
Global satisfaction Global satisfaction Global satisfaction Global satisfaction
Satisfaction with the water quality
Satisfaction with the frequency of visible wastewater in public areas
Satisfaction with cleaning and maintenance of containers
Satisfaction with cleaning and maintenance of containers
Satisfaction with the water pressure
Satisfaction with the rapidity of problem resolution
Satisfaction with the proximity of general waste containers
Satisfaction with the proximity of recycling containers
Satisfaction with the amount of interruptions
Satisfaction with the smell of waste water in consumer’s residential area
Satisfaction with the accumulation of waste next to containers
Satisfaction with the accumulation of waste next to containers Satisfaction with the
rapidity of problem resolution
“There is no direct discharge of wastewater into the river/sea in the municipality”
Trust in the general waste treatment
Trust in the recycling process
Service and product quality for price paid
Trust in the wastewater treatment
Service and product quality for price paid
Service and product quality for price paid Value for money in
comparison with other essential services (electricity, electronic communication, post)
Service and product quality for price paid
Value for money in comparison with other essential services (electricity, electronic communication, post)
Value for money in comparison with other essential services (electricity, electronic communication, post)
Transparent billing of drinking water services
Value for money in comparison with other essential services (electricity, electronic communication, post)
Transparent billing of waste management services
Transparent billing of waste management services
Transparent billing of sewage water services
6
5.3
Main Drivers of Consumer Satisfaction
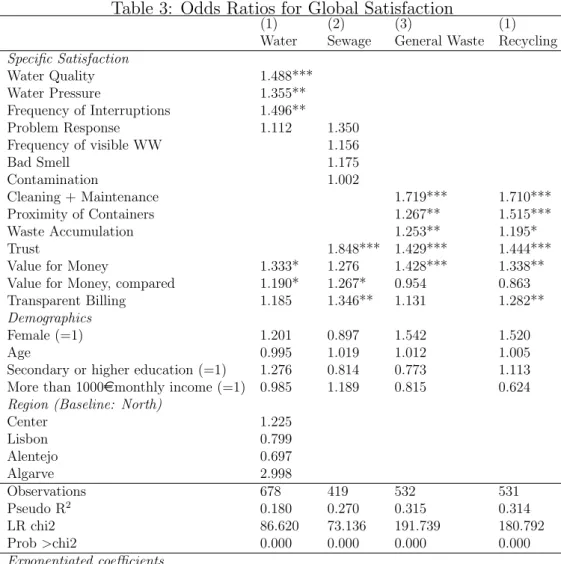
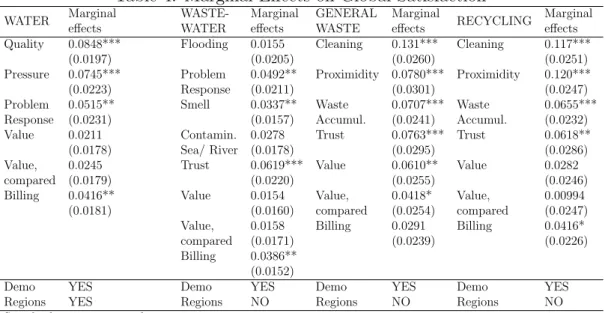
The results of the analysis are presented as odd ratios from the ordered logit model in Table 3. In addition, I show marginal effects at the mean from a simplified logit model that treats the dependent and independent variables as binary with only two possibilities of outcome: satisfied (category 5-7) and not satisfied (category 1-4). This coding leads to an easier interpretation of the marginal effects because it allows to disentangle the influence of being satisfied vs. unsatisfied with one specific service attribute on the probability to be overall satisfied. Contrary to that, marginal effects of continuous predictors, as in the case of the ordered logit model, measure the instantaneous rate of change [6].7
These effects appear to be very small due to the high mean values of the predictors and are much less conve-nient for interpretation.
In general terms, it can be seen that individuals’ characteristics do not have a significant influence on the overall satisfaction in any of the three sectors. This means that global satisfaction is not based on personal characteristics such as age and monthly household income and supports the hypothesis that overall satisfac-tion is mainly influenced by the percepsatisfac-tions that individuals have regarding specific service attributes. In the case of drinking water, these findings confirm those of V´asquez et al. (2011) who showed that personal characteristics are disassociated with the satisfaction levels for the city of Le´on in Nicaragua [38].
With regard to drinking water services, consumer satisfaction seems to be highly driven by consumers’ perception of water quality, water pressure and their level of satisfaction regarding the frequency of interruptions. The odd ratios in Table 3 show that for a 1-unit increase in satisfaction with water quality, the like-lihood of being overall satisfied is 1.488 times the likelike-lihood of being either overall neutral or unsatisfied, given that all other variables in the model are held constant. Similarly, people that are one point more satisfied with the water pressure or the frequency of interruption, are 1.355 times or 1.496 times more likely to be satisfied with the overall services, respectively. Also the pricing of drinking water plays a role for consumers, albeit the odds ratios for consumer’s perception about the services in terms of prices are only statistically significant at the 10% percent level (signalized by the stars in the table).
For the wastwater sector, trust seems to be the most important factor for the consumer’s overall satisfaction. With each one-point increase on the Likert Scale for this question, the odds of being overall satisfied is 1.848 times greater than
be-7
Table 3: Odds Ratios for Global Satisfaction
(1) (2) (3) (1)
Water Sewage General Waste Recycling
Specific Satisfaction
Water Quality 1.488*** Water Pressure 1.355** Frequency of Interruptions 1.496**
Problem Response 1.112 1.350 Frequency of visible WW 1.156
Bad Smell 1.175
Contamination 1.002
Cleaning + Maintenance 1.719*** 1.710*** Proximity of Containers 1.267** 1.515*** Waste Accumulation 1.253** 1.195*
Trust 1.848*** 1.429*** 1.444***
Value for Money 1.333* 1.276 1.428*** 1.338** Value for Money, compared 1.190* 1.267* 0.954 0.863 Transparent Billing 1.185 1.346** 1.131 1.282**
Demographics
Female (=1) 1.201 0.897 1.542 1.520
Age 0.995 1.019 1.012 1.005
Secondary or higher education (=1) 1.276 0.814 0.773 1.113 More than 1000emonthly income (=1) 0.985 1.189 0.815 0.624
Region (Baseline: North)
Center 1.225
Lisbon 0.799
Alentejo 0.697
Algarve 2.998
Observations 678 419 532 531
Pseudo R2
0.180 0.270 0.315 0.314 LR chi2 86.620 73.136 191.739 180.792 Prob>chi2 0.000 0.000 0.000 0.000
Exponentiated coefficients
* p<0.10, ** p<0.05, *** p<0.010
ing unsatisfied or having a neutral opinion.8
This finding is very interesting since it suggests that consumers do not care much about service attributes that they (can) actually experience, but more about the wastewater treatment. The odds ratios for trust are also highly significant for the general waste and the recycling sector. For these services, it is therefore important to find measures that positively influence the level of trust that consumers have in the treatment process such as the provision of additional information on how wastewater and waste is treated.
Concerning the wastewater sector, the ordered logit model does not provide
8
Table 4: Marginal Effects on Global Satisfaction
WATER Marginal effects
WASTE-WATER
Marginal effects
GENERAL WASTE
Marginal
effects RECYCLING
Marginal effects Quality 0.0848*** Flooding 0.0155 Cleaning 0.131*** Cleaning 0.117***
(0.0197) (0.0205) (0.0260) (0.0251)
Pressure 0.0745*** Problem 0.0492** Proximidity 0.0780*** Proximidity 0.120***
(0.0223) Response (0.0211) (0.0301) (0.0247)
Problem 0.0515** Smell 0.0337** Waste 0.0707*** Waste 0.0655***
Response (0.0231) (0.0157) Accumul. (0.0241) Accumul. (0.0232)
Value 0.0211 Contamin. 0.0278 Trust 0.0763*** Trust 0.0618**
(0.0178) Sea/ River (0.0178) (0.0295) (0.0286)
Value, 0.0245 Trust 0.0619*** Value 0.0610** Value 0.0282
compared (0.0179) (0.0220) (0.0255) (0.0246)
Billing 0.0416** Value 0.0154 Value, 0.0418* Value, 0.00994
(0.0181) (0.0160) compared (0.0254) compared (0.0247)
Value, 0.0158 Billing 0.0291 Billing 0.0416*
compared (0.0171) (0.0239) (0.0226)
Billing 0.0386** (0.0152)
Demo YES Demo YES Demo YES Demo YES
Regions YES Regions NO Regions NO Regions NO
Standard errors in parentheses *** p<0.01, ** p<0.05, * p<0.1
any other significant odds ratios than for “Transparent Billing”, “Value for Money compared to other Services”, and “Trust”. In contrast, the marginal effects from the binary model reported in Table 4 suggest that the satisfaction with the smell of wastewater in public and operator’s response to problems indeed effect the probability of being satisfied. The probability to be overall satisfied is 3.4 percent-age points higher for people that do not have any complaints about the smell of wastewater in public than for people that are bothered by bad smell. Consumers that think that operators quickly react to problems with wastewater have a 5 per-centage points higher probability to be overall satisfied.
result makes a lot of sense since there are much more general waste containers than recycling containers in public areas. In order to increase general consumer satisfaction with recycling services, service providers should therefore ensure that recycling containers are easily reachable for consumers.
5.4
Technical Indicators on Service Quality
After determining which service attributes drive global consumer satisfaction, I focus in the second part of the study on the relation between consumer satisfac-tion and objective performance measures. The objective performance indicators of ERSAR are technical indicators on quality of service and drinking water qual-ity. As part of its mandate, ERSAR annually assesses the performance of all regulated operators of drinking water supply, urban wastewater management and urban waste management services. A total of 48 of indicators related to these services, including drinking water quality, are used for benchmarking to identify areas for improvement. The results of the analysis are published in the Annual Report on Water and Waste Services in Portugal [10].9
ERSAR generated 16 performance indicators per service sector which can be grouped into three areas: protection of users’ interests, operator’s sustainability and environmental sustainability. Especially the indicators of the first group are strongly related to the quality of services that directly affect consumers, such as the indicator for the physical accessibility of services. Each technical indicator is calculated with qualitative data that is reported by the service operators. Exter-nal auditors verify the data on a regular basis. The technical indicators have a three-point scale with 1 indicating “good”, 2 “medium” and 3 “unsatisfied” per-formance. The threshold values for each indicator are defined by ERSAR.
Intuitively, we would assume that consumers are more satisfied with opera-tors that deliver good performance measured by technical indicaopera-tors and therefore expect a positive relation. For example, an operator with a low number of inter-ruptions in the drinking water supply should have more satisfied consumers than an operator that delivers poor service quality and has often problems with inter-ruptions. On the other hand, the literature suggests that this assumption often does not hold in real life. I assess the hypothesis of a positive relation between consumer satisfaction and objective indicators by using data from the pilot sur-vey and ERSAR’s Technical Indicators on Quality of Service and Drinking Water Quality from 2014.
9
5.5
Estimating the Relationship between Consumer
Satis-faction and Technical Indicators
In order to test the hypothesis of a positive significant relation between ERSAR’s technical indicators and consumer satisfaction, I employ a Spearman rank corre-lation analysis using both datasets. The municipalities of the survey respondents are known. It is therefore possible to identify which water, wastewater and waste operators are responsible for their households at the retail level. This allows to get information about both the technical performance of the service provider as well as the satisfaction levels of all respondents that are served by this very operator. Following this strategy, the analysis includes in total 80 retail operators for each of the three service sectors. Due to the sampling method of the survey and the differences among entities in terms of size and geographical area, the number of respondents is not the same for all operators as it would be ideally the case. Being aware of this limitation, the following analysis can be nevertheless used to identify tendencies in terms of a potential relation between consumer satisfaction and tech-nical indicators. A significant positive correlation means that the perception of consumers is reflected by the technical indicators that are employed by ERSAR. A non-significant correlation indicates that it is not possible to make any inferences about consumers’ satisfaction by looking at ERSAR’s rating that uses technical data. In the second case, both performance measurements cannot be substitutes for each other, but should rather be used as complements.
In terms of selection of technical indicators, I use the findings from the first part of the study to identify the areas of services that drive the consumer’s overall satisfaction. Based on that, I select these technical indicators that can be intu-itively related to the specific service areas. It has to be said that it is not always possible to link a question from the consumer satisfaction survey with one of the 16 technical indicators employed by ERSAR for each service sector. Therefore, it was necessary to modify some of the ERSAR indicators to match with the specific ser-vice aspect that respondents were asked about. Table 5 shows the final selection of technical indicators for each service sector that are used for the correlation analysis.
ap-proximation for general consumer satisfaction.
Table 5: Technical Performance Indicators
Technical Indicator Related Survey Question
Water
Safe water (compliance with parametric values) Water quality Compliance with water turbidity Water quality Affordability in terms of regional average
disposable income
Value for money,
Value for money compared to other services Relative number of problems with the water supply Interruptions
Level of rehabilitation of water pipes Water pressure Volume of real losses of water Water pressure
Wastewater
Affordability in terms of regional average disposable income
Value for money,
Value for money compared to other services Relative number of flooding Visible wastewater in public
Relative number of collapses of collection drains Visible wastewater in public Shortage of labor (relative number of workers) Problem response
Adequate destination of wastewater Trust in the sewage process, Contamination of sea/rivers
Fulfillment of discharge criteria Trust in the sewage process, Contamination of sea/rivers
Waste
Accessibility of general waste services
(relative number of general waste collection points) Proximity of general waste containers Recycling of packaging material Trust in the recycling process Accessibility of selective collection services
(relative number of recycling collection points) Proximity of recycling waste containers Relative number of clean containers Cleaning and maintenance
Since the variables of both datasets are of ordinal nature, the Spearman rank correlation is here the preferred correlation measure.10
In contrast to Pearson’s
ρ, that is the most common correlation coefficient for finding a linear relationship
between two variables, Spearman’s ρdetermines the strength of a monotonic
rela-tionship between variables and is a nonparametric statistic. The Spearman rank correlation does not assume a normal distribution and is appropriate when one or both variables are skewed, as it is the case of the survey data [35][7][8]. In the con-sumer satisfaction literature, the Spearman rank correlation is a common method to assess the relation between consumer satisfaction and other service quality mea-sures (see for example Jenkinson et al. (2002) [16]).
10
In order to have the same scaling across all variables and to increase the number of observations per category, I use the modified 3-point scale for the satisfaction variables from the first part of the analysis. Like this, we have on one hand the categorical variables for technical performance with a 3-point scale from “unsat-isfied” to “good service quality” and on the other hand categorical variables for satisfaction with a 3-point scale from “unsatisfied” to “satisfied”.
5.6
Consumers are not Technicians: Technical Indicators
do not capture Consumer Satisfaction
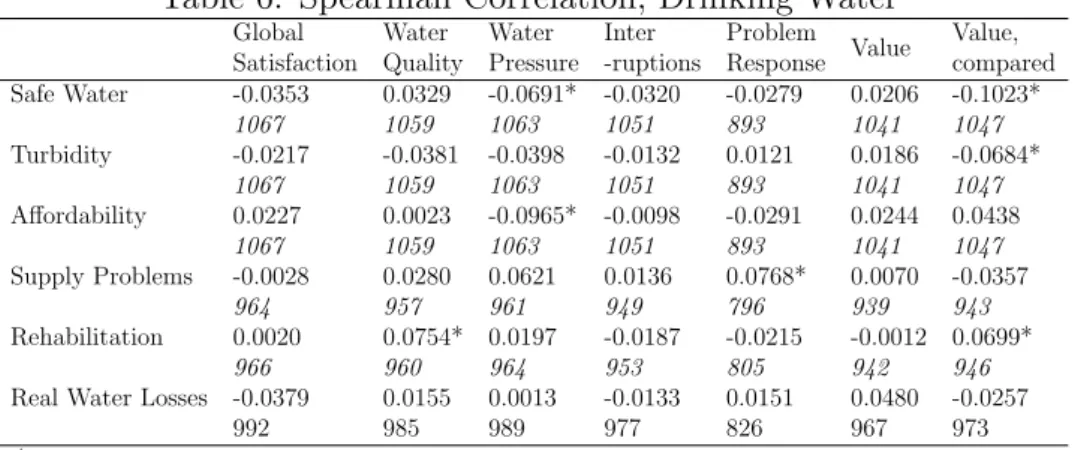
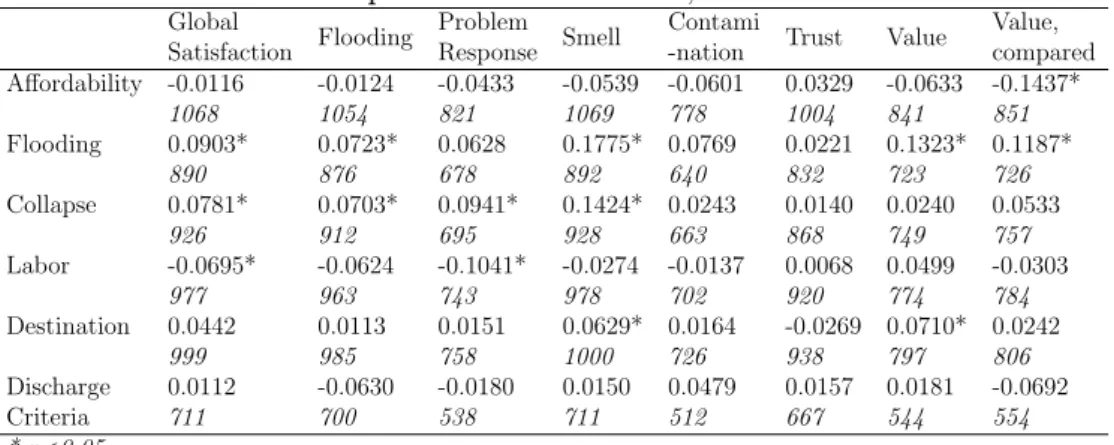
Table 6, 7 and 8 show the reduced form of the Spearman correlation matrix for the water, wastewater, general waste and recycling sector, respectively. The number of observations for each pair of variables is reported below Spearman’s ρvalues. The
extended matrix including all Spearman’sρ values can be found in the appendix.
Table 6: Spearman Correlation, Drinking Water
Global Satisfaction
Water Quality
Water Pressure
Inter -ruptions
Problem Response Value
Value, compared Safe Water -0.0353 0.0329 -0.0691* -0.0320 -0.0279 0.0206 -0.1023*
1067 1059 1063 1051 893 1041 1047
Turbidity -0.0217 -0.0381 -0.0398 -0.0132 0.0121 0.0186 -0.0684*
1067 1059 1063 1051 893 1041 1047
Affordability 0.0227 0.0023 -0.0965* -0.0098 -0.0291 0.0244 0.0438
1067 1059 1063 1051 893 1041 1047
Supply Problems -0.0028 0.0280 0.0621 0.0136 0.0768* 0.0070 -0.0357
964 957 961 949 796 939 943
Rehabilitation 0.0020 0.0754* 0.0197 -0.0187 -0.0215 -0.0012 0.0699*
966 960 964 953 805 942 946
Real Water Losses -0.0379 0.0155 0.0013 -0.0133 0.0151 0.0480 -0.0257
992 985 989 977 826 967 973
* p<0.05
Generally speaking, it can be seen that the hypothesis of a monotonic positive and significant relation between technical indicators and consumer satisfaction is not confirmed by the findings from the correlation analysis in any of the sectors. The values of Spearman’s ρ are almost always close to 0, reflecting a very weak
monotonic relationship (±1 would be perfect positive/negative relationship), and are often not statistically significant at the 5% level.
Table 7: Spearman Correlation, Wastewater
Global
Satisfaction Flooding
Problem Response Smell
Contami
-nation Trust Value
Value, compared Affordability -0.0116 -0.0124 -0.0433 -0.0539 -0.0601 0.0329 -0.0633 -0.1437*
1068 1054 821 1069 778 1004 841 851
Flooding 0.0903* 0.0723* 0.0628 0.1775* 0.0769 0.0221 0.1323* 0.1187*
890 876 678 892 640 832 723 726
Collapse 0.0781* 0.0703* 0.0941* 0.1424* 0.0243 0.0140 0.0240 0.0533
926 912 695 928 663 868 749 757
Labor -0.0695* -0.0624 -0.1041* -0.0274 -0.0137 0.0068 0.0499 -0.0303
977 963 743 978 702 920 774 784
Destination 0.0442 0.0113 0.0151 0.0629* 0.0164 -0.0269 0.0710* 0.0242
999 985 758 1000 726 938 797 806
Discharge 0.0112 -0.0630 -0.0180 0.0150 0.0479 0.0157 0.0181 -0.0692
Criteria 711 700 538 711 512 667 544 554
* p<0.05
Table 8: Spearman Correlation, Waste
Global Satisfaction
Cleaning / Maintencance
Waste
Accumulation Trust Trust Value
Value, compared
General Waste
Accessibility -0.0628 -0.0462 -0.0674* -0.0818* -0.0551 0.0025 0.0226
967 926 942 954 857 680 666
Clean Containers -0.0155 -0.0053 -0.1037* -0.1356* -0.0543 0.0127 -0.0027
1025 992 1007 1015 909 723 709 Recycling Waste
Accessibility -0.0280 -0.0436 -0.0360 -0.0387 -0.0259 -0.0434 -0.1386*
853 846 869 869 784 626 615
Clean Containers -0.0130 -0.0053 -0.0283 -0.1356* -0.0271 0.0127 -0.0027
997 992 1016 1015 917 723 709
Recycling -0.0256 -0.1636* 0.0234 -0.1436* -0.0306 0.0194 -0.0535
1038 1027 1057 1055 954 750 738 * p<0.05
with the water pressure” and “Service affordability in terms of regional disposable income”(ρ=-0.0965). This finding just confirms that one cannot be confident by
making any general inferences about consumers’ satisfaction by simply looking at the results from ERSAR’s technical assessment.
For the other sectors, the results from the Spearman correlation analysis are very similar, both in terms of ρ values and significance. Although we find some
sig-nificant monotonic relations, they are very weak and not in line with our initial assumptions. For example, the variables “Consumer satisfaction with the prox-imity of containers” and “Accessibility in terms of the relative number of waste collection point” have a monotonic significant relation withρ=-0.0674 for the
6
Conclusions
This study aimed at understanding consumer satisfaction with water, wastewa-ter and waste services in Portugal using unique national survey data collected by the Water and Waste Services Regulation Authority ERSAR. The analysis reveals that the large majority of survey respondents are generally satisfied with the water, wastewater and waste services provided by operators. This fact is not surprising, also because these services can be considered as low-involvement services. The lack of variety in terms of overall and attribute-specific satisfaction is at the same time the biggest limitation of this study since it constrained the analysis in terms of methodology. I followed the literature in adopting an ordered logit model for the given survey data.
The findings provide evidence that overall consumer satisfaction in each of the three sectors- water, wastewater and waste- is significantly influenced by attribute-specific satisfaction, but unrelated to socioeconomic and demographic characteris-tics of users. For the water sector, water quality, water pressure and the frequency of interruptions are the most significant drivers of overall satisfaction. Consumers that are higher satisfied with these service attributes are more likely to be generally satisfied with their drinking water operators. With regard to wastewater services, the level of trust in the wastewater treatment resulted to be the most important factor for the consumer’s overall satisfaction. Therefore, operators should focus on initiatives that can strengthen the confidence of their users in order to improve the overall satisfaction of their clients. The results for the waste sector exhibit that general satisfaction is significantly influenced by consumers’ satisfaction with the proximity and the cleaning and maintenance of containers, their satisfaction with the waste accumulation next to the collection points and their confidence in the treatment of general and recycling waste. The findings offer important suggestions to service providers, pointing at those service aspects that should be considered when defining strategies that focus on improving the overall satisfaction of users.
References
[1] Eugene W Anderson, Claes Fornell, and Donald R Lehmann. Customer satisfaction, market share, and profitability: Findings from sweden. The Journal of Marketing, pages 53–66, 1994.
[2] UN General Assembly. Resolution 64/292: The human right to water and sanitation. 64th Session. Available at: http://www. un. org/es/comun/docs, 2010.
[3] Rollin Brant. Assessing proportionality in the proportional odds model for ordinal logistic regression. Biometrics, pages 1171–1178, 1990.
[4] Karin Brown and Philip B Coulter. Subjective and objective measures of police service delivery. Public Administration Review, pages 50–58, 1983.
[5] Alan Bryman and Melissa Hardy. Handbook of data analysis. Sage, 2004.
[6] A Colin Cameron and Pravin K Trivedi. Microeconomics using stata. Stata Press Books, 2009.
[7] Jeffrey Camm, James Cochran, Michael Fry, Jeffrey Ohlmann, and David Anderson. Es-sentials of Business Analytics. Cengage Learning, 2014.
[8] Mathematics Education Centre. Spearman’s correlation. Available at: http://www.statstutor.ac.uk/resources/uploaded/spearmans.pdf.
[9] Judith Clifton, Daniel Diaz Fuentes, Marcos Fernandez Guttierrez, Oliver James, Sebastian Jilke, and Steven Van de Walle. Satisfaction, voice and choice in european public services. cocops policy brief. 2013.
[10] Entidade Reguladora dos Servi¸cos de ´Aguas e Res´ıduos. Relat´orio Anual dos Servi¸cos de ´
Aguas e Res´ıduos em Portugal (2014). 2014.
[11] Laura Eboli and Gabriella Mazzulla. An ordinal logistic regression model for analysing airport passenger satisfaction. EuroMed Journal of Business, 4(1):40–57, 2009.
[12] Joakim Ekstr¨om. On the relation between the polychoric correlation coefficient and spear-man’s rank correlation coefficient. Department of Statistics, UCLA, 2011.
[13] Massimo Florio. Network industries and social welfare: the experiment that reshuffled Eu-ropean utilities. Oxford University Press, 2013.
[14] UCLA: Statistical Consulting Group. Stata data analysis examples ordered logistic regres-sion. Avaliable at: http://www.ats.ucla.edu/stat/stata/dae/ologit.htm.
[15] T. Kelay J. Chenoweth C. Lundhn I. Vloerbergh, C. Fife-Shaw. Consumer satisfaction, pref-erences and acceptance regarding drinking water servicesan overview of literature findings and assessment methods. 2008.
[16] Crispin Jenkinson, A Coulter, S Bruster, N Richards, and T Chandola. Patients experiences and satisfaction with health care: results of a questionnaire study of specific aspects of care.
Quality and safety in health care, 11(4):335–339, 2002.
[18] Janet M Kelly. The dilemma of the unsatisfied customer in a market model of public administration. Public Administration Review, pages 76–84, 2005.
[19] Donald F Kettl. Civil service reform: Building a government that works. Brookings Insti-tution Press, 1996.
[20] Sang-Yi Lee, Nam Kyu Suh, and Jung-Kook Song. Determinants of public satisfaction with the national health insurance in south korea. The International journal of health planning and management, 24(2):131–146, 2009.
[21] J Scott Long and Jeremy Freese.Regression models for categorical dependent variables using Stata. Stata press, 2001.
[22] Havi Murad, Anat Fleischman, Siegal Sadetzki, Orna Geyer, and Laurence S Freedman. Small samples and ordered logistic regression: Does it help to collapse categories of outcome?
The American Statistician, 57(3):155–160, 2003.
[23] Neil G Myburgh, Geetesh C Solanki, Matthew J Smith, and Ratilal Lalloo. Patient satis-faction with health care providers in south africa: the influences of race and socioeconomic status. International Journal for Quality in Health Care, 17(6):473–477, 2005.
[24] Edward Nketiah-Amponsah and Ulrich Hiemenz. Determinants of consumer satisfaction of health care in ghana: does choice of health care provider matter? Global Journal of Health Science, 1(2):p50, 2009.
[25] Ann A O’Connell. Logistic regression models for ordinal response variables. Number 146. Sage, 2006.
[26] Arun Parasuraman, Leonard L Berry, and Valarie A Zeithaml. Servqual: A multiple-item scalre for measuring consumer perceptions of service quality. Journal of retailing, 64(1):12– 40, 1988.
[27] Arun Parasuraman, Leonard L Berry, and Valarie A Zeithaml. More on improving service quality measurement. Journal of retailing, 69(1):140–147, 1993.
[28] Hun Myoung Park. Regression Models for Ordinal and Nominal Dependent Variables Using SAS, Stata, LIMDEP, and SPSS. Working Paper. The University Information Technology Services (UITS) Center for Statistical and Mathematical Computing, Indiana University, 2009.
[29] Michael J Peel, Mark MH Goode, and Luiz A Moutinho. Estimating consumer satisfaction: Ols versus ordered probability models. International Journal of Commerce and Manage-ment, 8(2):75–93, 1998.
[30] Daniel A Powers and Yu Xie. Statistical methods for categorical analysis. Emerald Group Publishing, 2008.
[31] Utility Regulator. Water & sewage service price control 2015-21. Avaliable at: http://www.uregni.gov.uk/uploads/publications.
[32] Mijke Rhemtulla, Patricia E Brosseau-Liard, and Victoria Savalei. When can categorical variables be treated as continuous? a comparison of robust continuous and categorical sem estimation methods under suboptimal conditions. Psychological methods, 17(3):354, 2012. [33] Christine H Roch and Theodore H Poister. Citizens, accountability, and service satisfaction
[34] Debra A Schaumberg, Miki Uchino, William G Christen, Richard D Semba, Julie E Buring, and Jim Z Li. Patient reported differences in dry eye disease between men and women: impact, management, and patient satisfaction. PloS one, 8(9), 2013.
[35] Charles Spearman. The proof and measurement of association between two things. The American journal of psychology, 15(1):72–101, 1904.
[36] Richard A Spreng and Thomas J Page. A test of alternative measures of disconfirmation.
Decision Sciences, 34(1):31–62, 2003.
[37] Gregg G Van Ryzin. Expectations, performance, and citizen satisfaction with urban services.
Journal of Policy Analysis and Management, 23(3):433–448, 2004.