Revista Brasileira de
Engenharia Agrícola e Ambiental
Campina Grande, PB, UAEA/UFCG – http://www.agriambi.com.br
v.22, n.12, p.813-818, 2018
Hydraulic performance of drippers
with different waters and lateral line slopes
DOI: http://dx.doi.org/10.1590/1807-1929/agriambi.v22n12p813-818
Flavio D. Szekut
1, Carlos A. V. de Azevedo
2, Marcio A. V. Boas
3& Thiago Zuculotto
3A B S T R A C T
The operation of drip lateral lines is affected by the topography of the irrigated area and represent, depending on the type of water applied, changes in the discharge characteristics of the emitters. The research had as objective to evaluate the hydraulic performance of built-in labyrinth drippers, non-pressure compensating, with different waters and slopes of the lateral lines. The experiment was carried out on a test bench and consisted of a randomized block design with split-plots: first factor with four types of water, representing the plots: clean water, water with fertilizers, cassava starch wastewater and poultry slaughterhouse wastewater; second factor with slopes of the lateral line, constituting the sub-plots: upslope, level and downslope. The experimental statistics consisted of analysis of variance with subsequent simple-effect analysis and Tukey test at 0.05 probability level to compare the means of dripper flow rates. Quality control statistics was performed using Shewhart’s control charts with interpretations based on upper and lower control limits, as well as non-random pattern recognition. Waters of inferior quality modified the flow rates of the tested drippers regardless of the variation of internal pressure caused by the slope of the lateral line. Water with fertilizer (300 mg L-1) obtained the best conditions of temporal irrigation quality verified by the control charts. Irrigation with poultry slaughterhouse wastewater obtained the same flow rates in all slopes. Cassava starch wastewater caused the lowest flow rates among all the waters.
Desempenho hidráulico de gotejadores
com diferentes águas e declividades da linha lateral
R E S U M OO funcionamento das linhas laterais gotejadoras é afetado pela topografia da área irrigada e representam, dependendo do tipo de água aplicada, mudanças nas características de descarga dos emissores. A pesquisa teve como objetivo avaliar o desempenho hidráulico de gotejadores integrados do tipo labirinto não autocompensantes com diferentes águas e declividades das linhas laterais. O experimento foi realizado em bancada de testes e consistiu em delineamento em blocos casualizados com parcelas subdivididas, sendo o primeiro fator com quatro tipos de água, representado pelas parcelas: água limpa, água com fertilizante, efluente de fecularia e efluente de abatedouro de aves; e o segundo fator pelas declividades da linha lateral, constituído pelas subparcelas: em aclive, em nível e declive. A estatística experimental se constitui em uma análise de variância com posterior desdobramento da interação e teste Tukey a 5% de probabilidade para comparação das médias das vazões. Foi realizada a estatística de controle de qualidade por meio dos gráficos de controle de Shewhart x com interpretações baseadas nos limites de controle superior e inferior, e reconhecimento de padrões não aleatórios. Os resultados mostram que as águas com qualidade inferior modificam as vazões dos gotejadores independentemente da variação de pressão interna causada pela declividade. A água com fertilizante (300 mg L-1) obteve as melhores condições de qualidade de irrigação temporal verificadas pelos gráficos de controle. A irrigação com efluente de abatedouro de aves obteve as mesmas vazões em qualquer declividade da linha lateral. O efluente de fecularia obteve as menores vazões entre todas as águas.
Key words:
fertigation
Shewhart’s control charts labyrinth drippers
Palavras-chave:
fertirrigação
gráfico de controle de Shewhart gotejadores labirinto
1 União de Ensino do Sudoeste do Paraná/Faculdade Educacional de Francisco Beltrão/Departamento de Agronomia. Francisco Beltrão, PR. E-mail:
[email protected] (Corresponding author) - ORCID: 0000-0003-1028-9074
2 Universidade Federal de Campina Grande/Centro de Tecnologia e Recursos Naturais/Unidade Acadêmica de Engenharia Agrícola. Campina Grande,
PB. E-mail: [email protected] - ORCID: 0000-0001-7336-1243
3 Universidade Estadual do Oeste do Paraná/Pós Graduação em Engenharia Agrícola/Departamento de Recursos Hídricos e Saneamento Ambiental.
Cascavel, PR. E-mail: [email protected] - ORCID: 0000-0003-3444-8164; [email protected] - ORCID: 0000-0002-0482-7182
Introduction
The increasing use of water for food production, coupled to the water needs of urban centers and strict environmental requirements, indicates an obligatoriness of improving the efficiency of irrigation systems (Christofidis, 2013).
One of the alternatives for such increase in the efficiency of irrigated agriculture is often the reuse in irrigation of waters with lower-quality physico-chemical characteristics, such as wastewaters (Alobaidy et al., 2010).
However, the utilization of wastewaters, waters with fertilizers, or waters which undergo variations in their quality outside the acceptable limits, interferes with the hydraulic conditions of the emitters. According to Clark et al. (2007), the factors influencing the correct distribution of water include the form of the area and quantity and quality of water.
One of the variations can be observed in undulating areas where there is variability in the internal pressure of the lateral line, which changes the flow rate (Marcuzzo & Wendland, 2011). Furthermore, downslope lateral lines can obtain greater lengths due to the higher inlet pressure, according to an analytical method of dimensioning developed by Khemaies et al. (2013) for localized irrigation.
Evaluations in drip systems generally use values of flow rate, regardless of the slope of lateral lines. Jiang & Kang (2010) studied this effect of slope.
For cases in which lower-quality water is used, irrigation by drippers requires monitoring, which can be carried out by quality control statistics (Hermes et al., 2013; Juchen et al., 2013). This methodology verifies flow rate values outside statistical control, besides non-random patterns, such as the trends (Montgomery, 2016).
In this context, the present study aimed to evaluate the use of clean water, water with fertilizer, cassava starch wastewater and poultry slaughterhouse wastewater in drip irrigation systems with upslope, level and downslope lateral lines, and thus indicate the configurations in the field leading to better quality of water distribution and shorter periods of maintenance.
Material and Methods
The experiment was carried out at the Laboratory of Prototype Development of the State University of Western Paraná, Cascavel, PR, at geographic coordinates 24º 56’ 26" S and 53º 33’ 32" W.
For the experiments, a 5-m-long drip irrigation test bench was built with the following characteristics: pulley system used to make a turn with the lateral line to obtain a 10 m long lateral line; width of 1.55 m, with space for four lateral lines; gutters for the return of water to a tank; 0.5-hp motor pump, 2.07 m³ h-1 at 100 kPa; built with steel profiles and lifting cables to change lateral line slope. Figure 1 shows the design of the test bench with conical perspective.
The control head to control the flow rate of the lateral lines had: 120-mesh disc filter, as recommended by the manufacturer of the drippers, brand IRRITEC® - model FLD; pressure controller of the brand BERMAD® - model 0075 PRVy; ultrasonic water meter of the brand DIEHL METERING® -
model Hydros; digital manometer of the brand INSTRUTEMP® - Model 8215 (100 mwc), calibrated by the laboratory of metrology of the SENAI-PR (National Service for Industrial Training).
The drippers tested were from the brand IRRITEC®, model P1, designed for surface and subsurface irrigations, consisting of labyrinth-type turbulent-flow emitters spaced by 0.50 m and attached to the tubing wall, with a mechanism against suction of debris.
The dripper has nominal diameter of 16.00 mm, maximum working pressure of 80 kPa, proportionality coefficient of the emitter equation (K) of 1.26 and discharge exponent (x) of 0.48.
The experiment was set up in randomized blocks with plots split into two factors, the main factor was the type of water, represented by the four plots: clean water (public supply), water with nitrogen fertilizer at concentration of 300 mg L-1 of N, cassava starch wastewater and poultry slaughterhouse wastewater. The subplots were represented by the lateral line slope: downslope (2%), level (0%) and upslope (2%). Twenty-five replicates were performed for each type of water and slope in order to encompass the control statistics (Montgomery, 2016).
Each type of water was stored in 80-L plastic containers and, during the tests, was pumped from a 100-L tank to the bench, being subsequently returned to the tank by gutters.
The clean water came from the public supply system at the laboratory. In the water with fertilizers, urea (44% N) was used at concentration of 300 mg L-1 of N because Borges & Coelho (2009) recommend a value between 200 and 400 mg L-1 as limits to use urea in drip systems.
The poultry slaughterhouse wastewater received the following treatments: rotary sieves, equalizing tank and physicochemical flotation, passing through two anaerobic ponds, aerated reactor and secondary decanters and, lastly, stored in facultative ponds where the collection was performed for the experiment.
All types of water collected for the experiment were subjected to physicochemical analysis following the methodology of APHA (2012).
The response variable analyzed was the mean flow rate of the drippers for each treatment. To obtain the results necessary for the present study, the flow rate of each dripper
Figure 1. Illustration of the test bench used
Drippers
Pulleys Gutter
was determined by collecting volumes of water in collectors for a period of 3 min, in drippers selected in the system according to the methodology of Keller & Karmelli (1975). The working pressure was regulated at 80 kPa.
The methodology described by Montgomery (2016) was used to construct an interpret the control charts for x. The results are presented by control charts with three lines: central line, indicating the mean of the observed values; the lower control limit (LCL), Eq.1; and the upper control limit (UCL), Eq. 2.
manganese and total iron as low, moderate and severe risk of clogging or of restriction to use.
Table 1 shows the values of the main physicochemical parameters analyzed in the waters and which interfere with irrigation.
According to Holanda et al. (2016), for the use of irrigation based on soil management against salinization, the pH values of clean water and cassava starch wastewater are above the recommended limits, between 6.0 and 8.5. Potassium concentrations are also above the recommended ones for cassava starch and poultry slaughterhouse wastewaters, with values higher than 2.0 mg L-1.
Large portion of suspended solids is retained in the filtering system and, despite that, the wastewaters were classified as of high restriction. Dripper clogging is influenced by both particle size and concentration (Niu et al., 2013).
Clean water, water with fertilizers and cassava starch wastewater had pH values above 8.0, which are considered as of severe risk of clogging (Nakayama, 1986). Values of pH above 7.2 favor the precipitation of elements such as calcium and magnesium in filters, pipes and emitters, contributing to dripper clogging (Nakayama et al., 2007), and reactions with iron and manganese, which cause precipitation.
The descriptive analysis (Table 2) shows the flow rate characteristics and quality control limits obtained with the collected data.
LCL=x+A R
2
UCL=x+A R
2
where:
x - process mean;
A2 - constant depending on the number of samples and relative range; and,
R - mean range of the samples.
The basic criterion for a process in statistical quality control is that the points need to be plotted between the limits of quality control. Other complementary criteria make chart interpretation more sensitive, besides indicating more rapidly an effect of variability.
These complementary criteria include particularly the occurrence of sequence of points (at least eight continuous points), upward and downward trends, displacement in process level, cyclical patterns, points plotted close to the control limits and clustering around the main line.
For comparison between types of water and slopes, flow rate values were subjected to experimental statistics to compare the means. The software Minitab 17 was used to perform analysis of variance (ANOVA), with subsequent simple-effect analysis and Tukey test at 0.05 probability level. Quality control charts were constructed for the Shewhart x means in the Control Charts function of the software mentioned.
Results and Discussion
Waters used for irrigation need to be adequate for crop and soil and not favor wear or clogging of drippers. For localized systems which are prone to clogging, Nakayama (1986) classifies the values of suspended solids, pH, dissolved solids,
Lateral
line slope Type of water
Flow rates (L h-1)
Mean Minimum Maximum Median Standard deviation
Lower control limit (LCL)
Upper control limit (UCL)
Upslope
Clean water 3.446 3.397 3.495 3.445 0.022 3.405 3.492 Water with fertilizer 3.437 3.413 3.448 3.439 0.009 3.418 3.459 Starch wastewater 3.376 3.319 3.396 3.379 0.015 3.356 3.400 Slaughterhouse wastewater 3.460 3.405 3.531 3.448 0.039 3.440 3.484
Level
Clean water 3.447 3.422 3.470 3.449 0.015 3.424 3.472 Water with fertilizer 3.452 3.422 3.475 3.454 0.011 3.432 3.475 Starch wastewater 3.377 3.335 3.400 3.382 0.015 3.364 3.396 Slaughterhouse wastewater 3.455 3.386 3.510 3.454 0.038 3.408 3.501
Downslope
Clean water 3.476 3.445 3.501 3.476 0.014 3.448 3.509 Water with fertilizer 3.436 3.401 3.453 3.437 0.011 3.405 3.496 Starch wastewater 3.421 3.405 3.436 3.419 0.009 3.404 3.439 Slaughterhouse wastewater 3.455 3.386 3.510 3.454 0.038 3.430 3.472
Table 2. Descriptive analysis of flow rates and the control limits for clean water, water with fertilizer, cassava starch wastewater and poultry slaughterhouse wastewater for upslope, level and downslope lateral lines
* Values with high restriction to use in localized irrigation systems, according to Nakayama (1986)
Parameters Clean
water
Water with fertilizer
Starch
wastewater SHW
Electrical conductivity (dS m-1) 0.19 0.18 0.63 0.87
pH 8.57* 8.50* 8.70* 7.60
Alkalinity of Carbonates (mg L-1) 0.10 0.00 0.10 0.10
Alkalinity of Bicarbonates (mg L-1) 41.90 67.50 364.40 257.40
Chlorides (mg L-1) 14.20 12.40 14.20 10.60
Total Iron (mg L-1) 0.26 0.31 2.81* 1.48
Manganese (mg L-1) 0.03 0.02 0.19 0.08
Total Dissolved Solids (mg L-1) 60.00 80.00 380.00 520.00
Suspended Solids (mg L-1) 20.00 40.00 140.00* 200.00*
Calcium (mg L-1) 8.01 15.20 17.60 12.40
Magnesium (mg L-1) 6.31 7.29 18.40 9.47
Total Hardness (mg L-1) 46.00 68.00 120.00 70.00
Potassium (mg L-1) 2.00 2.00 88.00 20.00
Sodium (mg L-1) 13.00 23.00 29.00 123.00
Table 1. Physicochemical parameters analyzed for clean water, water with fertilizer, cassava starch wastewater and poultry slaughterhouse wastewater (SHW)
(1)
The lowest flow rate (3.319 L h-1) and the lowest mean (3.376 L h-1) were obtained with cassava starch wastewater in upslope lateral lines. Conversely, the mean flow rates of the poultry slaughterhouse wastewater were the highest ones in upslope (3.460 L h-1). Thus, the slope of the lateral line leads to different flow rates according to the quality of the water used. The highest variations in flow rate, evidenced by the standard deviation, occurred in the poultry slaughterhouse wastewater for the three slopes. In addition, this wastewater obtained the highest flow rate in upslope among all treatments (3.531 L h-1).
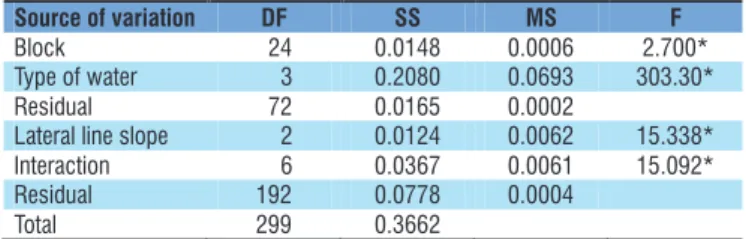
According to the statistical methodology used, which verifies the relation between the waters and lateral line slopes, there was interaction between treatments (Table 3). Thus, the type of water associated with lateral line slope influence the mean flow rates of the drippers. Therefore, a simple-effect analysis was carried out and the means were compared (Table 4).
According to the statistical results, the comparison of means indicated that clean water was statistically different with the highest values of flow rate in downslope. It is also possible to observe that the variation in the internal pressure due to the alteration in lateral line slope changed the flow rates of the drippers. According to Clark et al. (2007), the internal pressure in a downslope lateral line tends to decrease until reaching a minimum value and then increase due to the gain caused by the terrain depression.
The mean flow rate of the drippers operating with water with nitrogen fertilizer had highest value in level lateral lines (3.452 L h-1). This indicates that the variation of pressure in the lateral line, caused by its slope, did not change the mean flow rate of the drippers. For Klein et al. (2015), the concentration of NPK fertilizers is not preponderant for alterations in the flow rates and consequently in the Christiansen’s uniformity coefficient and coefficient of variation for fertigation.
Irrigation with cassava starch wastewater led to the lowest means of flow rate (3.376 L h-1 in upslope), which indicates that its quality characteristics, such as pH, total iron and suspended solids (Table 1), had greater influence on emitter flow rates. However, despite the interference of water quality
observed in the present study, Hermes et al. (2014) obtained Christiansen’s uniformity coefficients above 90% using cassava starch wastewater.
In the irrigation with poultry slaughterhouse wastewater, there was significant difference in the flow rates of the drippers in upslope (3.459 L h-1), level (3.455 L h-1) and downslope (3.450 L h-1) lateral lines. This indicates that the variations of pressure generated by lateral line slope did not change significantly the flow rate of the drippers for this type of water.
For level lateral lines, there was statistical difference between cassava starch wastewater and the other types of water tested, which reinforces the influence of the quality characteristics of this type of water on the flow rate of the drippers.
The monitoring performed by the quality control chart, as in Figure 2, shows the variability existing between the types of water and lateral line slope in a temporal context. According to Gove et al. (2013), the decisions of the chart are rapid and transparent, allowing for decision-making and removal of characteristics which interfere with the process.
The mean flow rates of clean water remained within the control limits for downslope (Figure 2A) and level (Figure 2B) lateral lines. However, for level lateral lines a trend was observed in the data, pointing to a continuous upward movement. According to Montgomery (2016), upward or downward trends in quality control charts suggest a wear or deterioration in the components of the system or that seasonal factors are interfering with the process.
Thus, lateral lines positioned downslope for clean water indicate better conditions of operation. In upslope and level operational units, periodical monitoring should be carried out because these slopes have lower characteristics of quality control.
The quality of the irrigation process using water with fertilizer remained between the control limits (Figure 2). In level lateral line (Figure 2B), for water with fertilizer, there was a sequence with eight points above the central line, indicating loss of quality in the process. However, among the types of water tested, water with fertilizer obtained the best conditions of irrigation.
The lower variability in mean flow rates using water with fertilizer, observed in the quality control charts, can be explained by the use of polymers which coat urea particles. These water-soluble polymers reduce drag and lead to lower head losses in the pipes (Al-Yarri et al., 2009).
In irrigation with cassava starch wastewater, the mean flow rates were within the control limits only for the downslope lateral line (Figure 2A). However, there were sequences above and below the central line, suggesting that the process is not under quality control. Hermes et al. (2013) tested cassava starch wastewater and also obtained values outside the statistical control for the coefficient of variation of the flow rates of the emitters.
Irrigation with cassava starch wastewater obtained, besides the lowest mean flow rates (Table 1), no adequate process according to the concept of quality control. For its utilization, maintenance and cleaning need to be frequently performed because, according to Li et al. (2015), periodical cleaning is one of the forms of management of the drip system using reclaimed waters.
Means followed by the same letter, uppercase in the column and lowercase in the row, do not differ statistically by Tukey test at 0.05 probability level
Type of water Lateral line slope
Upslope Level Downslope Clean water 3.446 ABb 3.447 Ab 3.476 Aa Water with fertilizer 3.437 Bb 3.452 Aa 3.436 Cb Starch wastewater 3.376 Cb 3.377 Bb 3.421 Da Slaughterhouse wastewater 3.459 Aa 3.455 Aa 3.450 Ba
Table 4. Simple-effect analysis and comparison of means for lateral line slopes and types of water
* Significant at 0.01 probability level, F test
Source of variation DF SS MS F Block 24 0.0148 0.0006 2.700* Type of water 3 0.2080 0.0693 303.30* Residual 72 0.0165 0.0002
Lateral line slope 2 0.0124 0.0062 15.338* Interaction 6 0.0367 0.0061 15.092* Residual 192 0.0778 0.0004
Total 299 0.3662
Table 3. Analysis of variance for the types of water and
x - Mean flow rate (L h-1), UCL - Upper control limit, LCL - Lower control limit, black dots represent evaluations with flow rates between UCL and LCL, red dots represent evaluations with flow rates outside UCL and LCL
Figure 2. Quality control charts for the flow rates with clean water, water with fertilizer, cassava starch wastewater and poultry slaughterhouse wastewater in downslope (A), level (B) and upslope (C) lateral lines
Irrigation with poultry slaughterhouse wastewater did not achieve quality in the process in any slope of the lateral line. Trends could also be identified for downslope (Figure 2A) and upslope (Figure 2C) lateral lines. For level lateral lines (Figure 2B), a displacement of the process can be observed in the mean flow rate, which may suggest changes or variations due to the water or to the drippers.
As observed in the present study, quality control statistics through charts is an effective tool (Follador et al., 2012), which allows the identification of problems in drippers subjected to irrigation with lower-quality water (Silva et al., 2016). In addition, other studies have pointed to the best layout of the system (Andrade et al., 2017) and indicated better moments to irrigate (Frigo et al., 2013).
Constructing control charts allows one to indicate, in a first step, points that are outside the statistical quality control. In a second step, by recognizing some non-random patterns, it is possible to identify the lack of control and perform a clearer, more objective interpretation of the variabilities of the system, such as the trends analyzed in the present study.
Other studies should be conducted, especially with other types of reuse water in order to know their hydraulic characteristics in localized systems.
Conclusions
1. The use of water with fertilizer, cassava starch wastewater and poultry slaughterhouse wastewater interferes with the flow
rates of the drippers, regardless of the variation of pressure caused by lateral line slope.
2. Water with nitrogen fertilizer (300 mg L-1 N) leads to better conditions of quality control among all types of water tested and under all conditions of slopes.
3. Poultry slaughterhouse wastewater does not cause variation in the flow rates of the drippers for level, upslope (2%) and downslope (2%) lateral lines.
4. Cassava starch wastewater leads to the lowest flow rates at any lateral line slope, compared to the other types of water tested.
Literature Cited
Alobaidy, H. M. J.; Al-Sameraiy, M. A.; Kadhem, A. J.; Majeed, A. A. Evaluation of treated municipal wastewater quality for irrigation. Journal of Environmental Protection, v.1, p.216-225, 2010. https:// doi.org/10.4236/jep.2010.13026
Al-Yarri, M.; Solemani, A.; Abu-Sharkh, B.; Al-Mubaiyedh, U.; Alsarkhi, A. Effect of drag ruducing polymers on oil-water flow in a horizontal pipe. International Journal of Multiphase Flow, v.35, p.516-524, 2009. https://doi.org/10.1016/j. ijmultiphaseflow.2009.02.017
Andrade, M. G. de; Vilas Boas, M. A.; Siqueira, J. A. C.; Sato, M.; Dieter, J.; Hermes, E.; Mercante, E. Uniformity microsprinkler irrigation system using statistical quality control. Ciência Rural, v.47, p.1-7, 2017. https://doi.org/10.1590/0103-8478cr20160546
Downsllope Lateral Lines
Level Lateral Lines
Upslope Lateral Lines
VCL LCL
VCL
LCL
APHA - American Public Health Association. Standard methods for the examination of water and wastewater. 22.ed. Washington: APHA, 2012. 1496p.
Borges, A. L.; Coelho, E. F. Fertirrigação em fruteiras tropicais. 2.ed. Cruz das Almas: Embrapa Mandioca e Fruticultura Tropical, 2009. 179p.
Christofidis, D. Água, irrigação e agropecuária sustentável. Revista de Política Agrícola, v.1, p.115-127, 2013.
Clark, G. A.; Haman, D. Z.; Prochaska, J. F.; Yitayew, M. General system design principles. In: Lamm, F. R.; Ayars, J. E.; Nakayama, F. S. (ed.). Microirrigation for crop production: Design, operation, and management. Amsterdam: Elsevier, 2007. Cap.5, p.161-220. https://doi.org/10.1016/S0167-4137(07)80008-4
Follador, F. A. C.; Vilas Boas, M. A.; Malmann, L.; Schoenhals, M.; Villwock, R. Controle de qualidade da água medido através de cartas de controle de Shewhart, Cusum e Mmep. Engenharia Ambiental, v.9, p.183-197, 2012.
Frigo, J. P.; Vilas Boas, M. A.; Frigo, E. P.; Hermes, E.; Tessaro, E. Irrigação diurna e noturna em um sistema de aspersão convencional em Palotina-PR. Irriga, v.18, p.318-327, 2013. https://doi.org/10.15809/irriga.2013v18n2p318
Gove, A. D.; Sadler, R.; Matsuki, M.; Archibald, R.; Pearse, S.; Garkaklis, M. Control charts for improved decisions in environmental management: A case study of catchment water supply in south-west Western Australia. Ecological Management & Restoration, v.14, p.127-134, 2013. https://doi.org/10.1111/emr.12040
Hermes, E.; Vilas Boas, M. A.; Gomes, S. D.; Gomes, B. M.; Reis, C. F. Quality control in irrigation and fertigation with cassava processing wastewater into drip system. Journal of Food, Agriculture & Environment, v.11, p.1427-1433, 2013.
Hermes, E.; Vilas Boas, M. A.; Gris, D. J.; Frigo, E. P.; Berger, J. S.; Lins, M. A.; Frigo, J. P. Irrigation with wastewater from cassava processing with different concentrations of suspended solids. Journal of Food, Agriculture and Environment, v.12, p.487-490, 2014.
Holanda, J. S.; Amorim, J. R. A.; Ferreira Neto, M.; Holanda, A. C.; Sá, F. V. da S. Qualidade da água para irrigação. In: Gheyi, H. R.; Dias, N. da S.; Lacerda, C. F. de; Gomes Filho, E. (ed.). Manejo da salinidade na agricultura: Estudos básicos e aplicados. Fortaleza: INCTSal, 2016. Cap.4, p.35-50.
Jiang, S.; Kang Y.; Evaluation of microirrigation uniformity on laterals considering field slopes. Journal of Irrigation and Drainage Engineering, v.136, p.429-434, 2010. https://doi.org/10.1061/ (ASCE)IR.1943-4774.0000196
Juchen, C. R.; Suszek, F. L.; Vilas Boas, M. A. Irrigação por gotejamento para produção de alface fertirrigada com águas residuárias agroindustriais. Irriga, v.18, p.243-256, 2013. https:// doi.org/10.15809/irriga.2013v18n2p243
Keller, J.; Karmeli, D. Trickle irrigation design. Glendora: Rain Bird Sprinkler Manufacturing Corp, 1975. 133p.
Khemaies, Z.; Moncef, H.; Aws, A.; Adarrazak, S. Design of nonzero uniformly sloping laterals in trickle irrigation systems. Journal of Irrigation and Drainage Engineering, v.139, p.419-425, 2013. https://doi.org/10.1061/(ASCE)IR.1943-4774.0000565
Klein, M. R.; Vilas Boas, M. A.; Suszek, F. L.; Szekut, F. D.; Mello, E. L.; Gomes, B. M.; Silva, B. B.; Zuculotto, T. Fertigation quality with drip irrigation system in grape orchard by using the process capability index. Journal of Food, Agriculture & Environment, v.13, p.179-183, 2015.
Li, Y.; Song, P.; Pei, Y.; Feng, J. Effects of lateral flushing on emitter clogging and bioflm components in drip irrigation systems with reclaimed water. Irrigation Science, v.33, p.235-245, 2015. https:// doi.org/10.1007/s00271-015-0462-8
Marcuzzo, F. F. N.; Wendland, E. Distribuição de pressão em rede de irrigação localizada otimizada por algoritmos genéticos. Engenharia Agrícola, v.31, p.497-505 2011. https://doi. org/10.1590/S0100-69162011000300010
Montgomery, C. D. Introdução ao controle estatístico de qualidade. 7.ed. Rio de Janeiro: LTC, 2016. 549p.
Nakayama, F. S. Water treatment. In: Nakayama, F. S.; Bucks, D. A. (ed.). Trickle irrigation for crop production. Amsterdam: Elsevier, 1986. Cap.3, p.164-187. https://doi.org/10.1016/B978-0-444-42615-4.50012-6
Nakayama, F. S.; Boman, B. J.; Pitts, D. Maintenance. In: Lamm, F. R.; Ayars, J. E.; Nakayama, F. S. (ed.) Microirrigation for crop production: Design, operation, and management. Amsterdam: Elsevier, 2007. Cap.11, p.389-430.
Niu, W.; Liu, L.; Chen, X. Influence of fine particle size and concentration on the clogging of labyrinth emitters. Irrigation Science, v.31, p.545-555, 2013. https://doi.org/10.1007/s00271-012-0328-2