GENETIC STRUCTURE OF ANNUAL RYEGRASS (
Lolium
multiflorum
) POPULATIONS ESTIMATED BY RAPD
Eduardo Alano Vieira1; Caroline Marques Castro2; Antônio Costa de Oliveira3*; Fernando Irajá Félix de Carvalho3; Paulo Dejalma Zimmer3; Luís Fernando Martins1
1
UFPel/FAEM - Programa de Pós-Graduação em Agronomia/Fitomelhoramento. 2
Embrapa Clima Temperado, C.P. 403 - 96001-970 - Pelotas, RS - Brasil. 3
UFPel/FAEM - Depto. de Fitotecnia, C.P. 354 - 96010-900 - Pelotas, RS - Brasil. *Corresponding author <acostol@terra.com.br>
ABSTRACT: Annual ryegrass is a temperate climate annual foraging grass, grown mostly in the South of Brazil, especially in the state of Rio Grande do Sul. Despite its importance, little is known about its genetic diversity, both within and among the populations cultivated. This knowledge is of fundamental importance for developing breeding and conservation strategies. The aim of this study was to characterize the genetic diversity and structure of four populations of annual ryegrass. Three of the populations were located in Rio Grande do Sul and the fourth in Uruguay. RAPD markers were used to study the genetic diversity and structure of these populations. Analysis of 375 individuals sampled from the populations, using six RAPD primers, generated a total of 82 amplified bands. They included 73 polymorphic bands (89,02%). The value of the
total genetic diversity index obtained, Hspecies (0,71) was high, indicating the presence of wide genetic diversity
in the four populations. Genetic structure analysis revealed that 98% of total diversity is intrapopulational, whereas interpopulational genetic diversity was only 2%. These results suggest that before these populations separated, they had gone through a period of gene exchange and, even after the separation event, gene frequency stayed at levels similar to the original levels, with no differential selection for these genes in the different cultivation areas.
Key words: foraging, genetic diversity, molecular markers
ESTRUTURA GENÉTICA DE POPULAÇÕES DE AZEVÉM ANUAL
(
Lolium multiflorum
) ESTIMADA POR RAPD
RESUMO: O azevém anual é a gramínea anual forrageira de clima temperado de maior utilização no sul do Brasil, particularmente no Estado do Rio Grande do Sul. Apesar de toda a importância que a espécie apresenta, pouco se conhece a respeito da diversidade genética presente entre e dentro das populações cultivadas. Este conhecimento é de fundamental importância para o estabelecimento das estratégias de melhoramento genético e de conservação destes materiais. O objetivo deste estudo foi caracterizar a diversidade genética e a estrutura genética de quatro populações de azevém anual, sendo três populações do Estado do Rio Grande do Sul e uma do Uruguai. O nível de diversidade e a estrutura genética destas populações foram estudados com marcadores RAPD. A análise de 375 indivíduos amostrados nas populações, com seis iniciadores, gerou um total de 82 bandas que foram utilizados nas análises, dentre as quais 73 (89,02%) foram polimórficas. O valor do índice
de diversidade genética total obtido, Hspecies (0,71) foi elevado evidenciando a presença de uma grande
diversidade genética nas quatro populações. A análise da estrutura genética revelou que 98% da diversidade total esta contida dentro das populações, enquanto que a diversidade genética entre as populações representou somente 2%. Sugere-se que antes da separação destas populações, as mesmas tenham passado por um período de troca de genes e que mesmo após o evento de separação elas mantiveram a freqüência destes em níveis semelhantes aos originais, não tendo ocorrido uma seleção diferencial destes genes nos locais de cultivo. Palavras-chave: forrageira, diversidade genética, marcadores moleculares
INTRODUCTION
Natural pasture accounts for 61% of the area of Rio Grande do Sul. This pasture consists mainly of spe-cies that grow in spring-summer, with a marked drop in productivity in the colder seasons (Mota et al., 1981). Among the temperate climate forage species, annual
ryegrass (Lolium multiflorum) is the most widely used
annual forage grass (Maia, 1995) because of its high pro-ductivity and palatability, excellent resprouting and easy plantability (Carambula, 1971).
East-ern Europe, where the genus Lolium is found (Borrill, 1986). The origins of annual ryegrass are still undefined, but we do know that this species was among the natural vegetation in the fields of northern Italy, where it prob-ably originated (Spedding & Diekmahns, 1972). In Bra-zil, foraging was introduced into Rio Grande do Sul by Italian immigrants in 1875 (Araújo, 1978).
Genetic improvement of this crop is important. This is why it is essential to get to know cultivated popu-lations both in terms of genetic variability and access quality. When defining the breeding and conservation strategies to be put in place (Auler et al., 2002), we must know the degree of genetic diversity and genetic struc-ture of the populations concerned.
Molecular marker techniques have produced valuable information in respect of the genetic structure and variability of populations of various species (Hamrick, 1990; Powell et al., 1995; 1996a; 1996b; Oliveira et al., 1996; Ouborg et al., 1999). Among the molecular marker techniques used, the Randomly Ampli-fied Polymorphic DNA (RAPD) method stands out be-cause it is fast and easy to use, and is relatively low-cost when compared to other molecular techniques (Cruz & Milach, 1998).
RAPD markers offer extraordinary potential for investigating the genetic variability of forage species (Chai & Sticklen, 1998). However, care must be taken with the type of sample. It is necessary to assess indi-vidual plants instead of bulk samples so as to guarantee the genotypical composition of a synthetic cultivar. This is because material originating from bulk samples, when amplified, results simply in the sum of the products origi-nated by individual plants, and does not reflect all the in-ter- and intrapopulational diversity (Sweeney & Danneberger, 1994).
The aim of this study was to characterize the ge-netic structure and diversity of four populations of an-nual ryegrass using RAPD markers. Three of the popu-lations were located in Rio Grande do Sul and the fourth in Uruguay.
MATERIALS AND METHODS
Vegetable material
The study assessed four populations of annual ryegrass, three of which were traditional populations of the state of Rio Grande do Sul, collected in the munici-pal districts of Pantano Grande (Central region -30º13’S, 52º23’W), Dom Pedrito (Western region -30º59’S, 54º39’W) and Pedro Osório (Southern region -31º52’S, 52º49’W). In the study, these populations are denoted B, C and D, respectively. Collection locations were defined to satisfy the need to sample the three geographic regions of the State in which foraging was most common. The fourth population assessed was the Uruguaian cultivar “La
Estanzuela – 284”, denoted population A. It was chosen because it is widely used, mainly in the Brazil/Uruguay frontier region (38º00’S, 57º00’W). A total of 375 geno-types were assessed: 99 from population A, 84 from popu-lation B, 96 from popupopu-lation C and 96 from popupopu-lation D.
DNA extraction and RAPD amplification reaction DNA was extracted from two independent leaf samples of each genotype, as in Yang et al. (1996), us-ing the extraction method described by Saghai-Maroof et al. (1984). The DNA was quantified by electrophoresis in agarose gel (0,8%) stained with ethydium bromide. The DNA concentration was estimated by comparison with the
known standard for the molecular mass marker: Low DNA
Mass Ladder (Invitrogen - Life Technologies).
Amplifications were carried out at a final
vol-ume of 25 µL containing 25 ng of genomic DNA, 0.2
mmol L-1 of dNTPs, 0.2 mmol L-1 of cresol red stain,
0.5 mmol L-1 of primer, 2.5 mmol L-1 of MgCl2, 50 mmol
L-1 of KCl, 10 mmol L-1 of Tris-HCl (pH 8.0), 0.1% (v/
v) of Triton x-100 and 1.5 units of Taq polimerase
(Invitrogen). PCR reactions were carried out in a thermocycler (MJ Research PTC-100) programmed for an initial denaturing step at 94ºC for 3 minutes, followed by 44 cycles of 1 minute at 94ºC, 1 minute at 38ºC and 1.5 minutes at 72ºC. The reaction was completed by a final step of 5 minutes at 72ºC. The amplified fragments were separated by electrophoresis in agarose gel (1.4%), stained with ethydium bromide and photographed using a UV transluminator.
During the work, we used six primers supplied by the University of British Columbia (UBC): i) UBC2-CCTGGGCTTC; ii) UBC3- CCTGGGCTTA; iii) UBC4-CCTGGGCTGG; iv) UBC9- CCTGCGCTTA; v) UBC12- CCTGGGTCCA e vi) UBC13-CCTGGGTGGA.
Data analysis and genetic diversity estimates
Products of the amplification reactions consistent for two independent extractions were classified accord-ing to presence (1) or absence (0) of bands. Genetic di-versity was measured using the Shannon-Wiener function: H’= - ∑Pi log2 (Pi), where Pi is the frequency of class i (presence or absence of band i), according to the meth-odology proposed by Lewontin (1972). This methodol-ogy was used because it is suitable for analysing binary
data (presence v. absence of band) obtained using
domi-nant markers such as RAPD. A similar method was used for estimating genetic diversity in vegetable species (Yun et al., 1998; Whitkus et al., 1998; Aga et al., 2003; Fu et al., 2003).
First, the indexes were computed for diversity
within the populations: i) H0 (genetic diversity of each
frequency of each marker in each population; ii) Hpop (av-erage genetic diversity of each marker in the four
popu-lations) using the arithmetic average of the H0 of each
marker in the four populations, and iii) Hpop (genetic
di-versity within the populations) using the arithmetic
av-erage of the Hpop of all markers studied. Then the
inter-population indexes were computed: i) Hspecies (genetic
di-versity of each marker in the four populations)based on
the presence/absence frequency of each marker in the four populations, and ii) Hspecies (total genetic diversity)
us-ing the arithmetic average of the Hspecies of all markers
studied.
We then computed the proportion of genetic di-versity within the populations for each marker analysed (Hpop/Hspecies) and in all markers studied (Hpop/Hspecies),
to-gether with the proportion of genetic diversity present
between the populations for each marker studied (Hspecies
– Hpop)/Hspecies and for all markers (Hspecies – Hpop)Hspecies.
Band presence/absence data obtained by RAPD analysis of 60 individuals taken at random (15 from each population) were used to compute the genetic similarity of all pairs of individuals sampled, using the NTSYS pro-gram (Rohlf, 2000). The Dice coefficient (Dice, 1945) was used to compute genetic similarity and, based on the similarity matrix produced, we constructed a dendrogram using the UPGMA grouping method. To check the
adjust-ment between the similarity matrix and the dendrogram obtained, we computed the cophenetic correlation coef-ficient (r) in accordance with Sokal & Rohlf (1962). The statistical stability of the groupings was estimated by bootstrap analysis with 100 replicates, using Winboot (Yap & Nelson, 1996).
RESULTS AND DISCUSSION
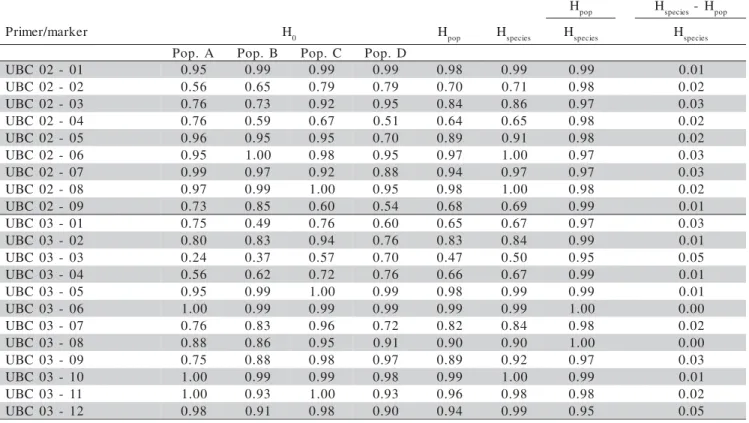
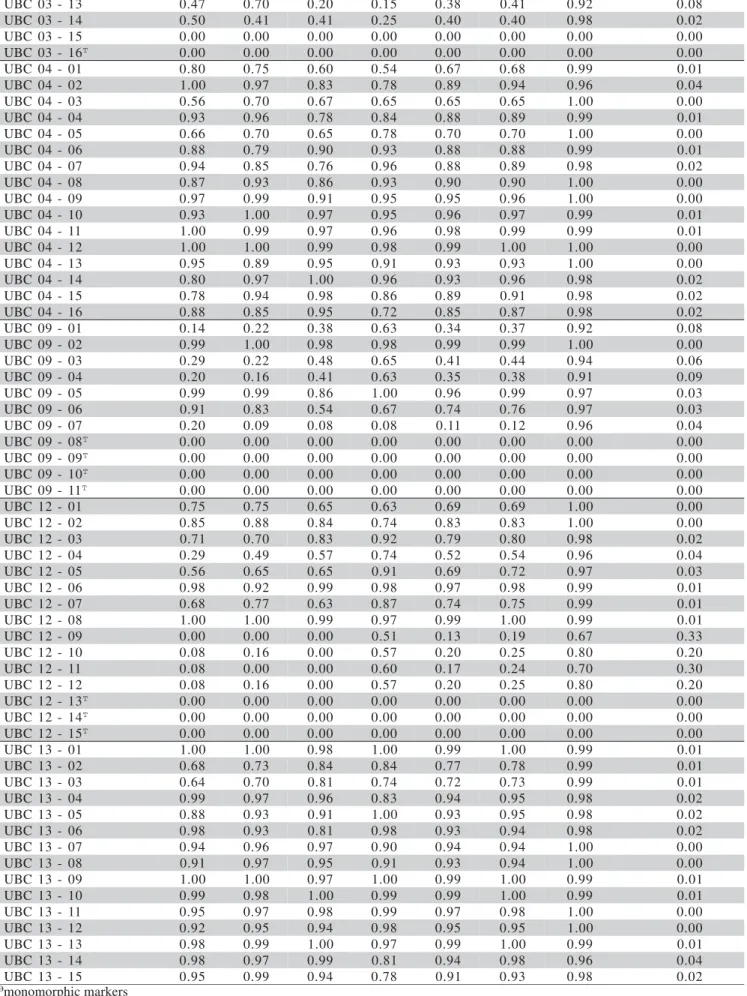
The six primers used in this study produced a to-tal of 82 RAPD bands in the 375 sampled individuals, 73 of which (89.02%) were polymorphic. Of these, only band UBC12–09 was polymorphic in population D; bands UBC12–10 and UBC12–12 were not polymorphic in population C and band UBC12–11 was not polymorphic in populations B and C (Table 1).
Primers UBC04, UBC13, UBC03 and UBC12 detected most of the polymorphic bands (16, 15, 14 and 12 bands, respectively), whereas primers UBC02 and UBC09 revealed 9 and 7 polymorphic bands, respectively (Table 1). The degree of polymorphism detected was fairly high, showing that the RAPD markers were effi-cient in detecting genetic variability between the individu-als studied. Sweeney et al. (1996) have already reported on the efficiency of RAPD markers in identifying the cul-tivars of foraging species.
Table 1 - Estimates of H0 (genetic diversity of each marker in each population), Hpop (average genetic diversity of each marker in the four populations), Hspecies (genetic diversity of each marker in the four populations), Hpop/Hspecies (proportion of intrapopulational genetic diversity for each marker), (Hspecies – Hpop)/Hspecies (proportion of interpopulational genetic diversity for each marker).
Continue...
Hpop Hspecies -Hpop
r e k r a m / r e m i r
P H0 Hpop Hspecies Hspecies Hspecies
A . p o
P Pop. B Pop. C Pop. D
1 0 -2 0 C B
U 0.95 0.99 0.99 0.99 0.98 0.99 0.99 0.01
2 0 -2 0 C B
U 0.56 0.65 0.79 0.79 0.70 0.71 0.98 0.02
3 0 -2 0 C B
U 0.76 0.73 0.92 0.95 0.84 0.86 0.97 0.03
4 0 -2 0 C B
U 0.76 0.59 0.67 0.51 0.64 0.65 0.98 0.02
5 0 -2 0 C B
U 0.96 0.95 0.95 0.70 0.89 0.91 0.98 0.02
6 0 -2 0 C B
U 0.95 1.00 0.98 0.95 0.97 1.00 0.97 0.03
7 0 -2 0 C B
U 0.99 0.97 0.92 0.88 0.94 0.97 0.97 0.03
8 0 -2 0 C B
U 0.97 0.99 1.00 0.95 0.98 1.00 0.98 0.02
9 0 -2 0 C B
U 0.73 0.85 0.60 0.54 0.68 0.69 0.99 0.01
1 0 -3 0 C B
U 0.75 0.49 0.76 0.60 0.65 0.67 0.97 0.03
2 0 -3 0 C B
U 0.80 0.83 0.94 0.76 0.83 0.84 0.99 0.01
3 0 -3 0 C B
U 0.24 0.37 0.57 0.70 0.47 0.50 0.95 0.05
4 0 -3 0 C B
U 0.56 0.62 0.72 0.76 0.66 0.67 0.99 0.01
5 0 -3 0 C B
U 0.95 0.99 1.00 0.99 0.98 0.99 0.99 0.01
6 0 -3 0 C B
U 1.00 0.99 0.99 0.99 0.99 0.99 1.00 0.00
7 0 -3 0 C B
U 0.76 0.83 0.96 0.72 0.82 0.84 0.98 0.02
8 0 -3 0 C B
U 0.88 0.86 0.95 0.91 0.90 0.90 1.00 0.00
9 0 -3 0 C B
U 0.75 0.88 0.98 0.97 0.89 0.92 0.97 0.03
0 1 -3 0 C B
U 1.00 0.99 0.99 0.98 0.99 1.00 0.99 0.01
1 1 -3 0 C B
U 1.00 0.93 1.00 0.93 0.96 0.98 0.98 0.02
2 1 -3 0 C B
Table 1 - Continuation. 3 1 -3 0 C B
U 0.47 0.70 0.20 0.15 0.38 0.41 0.92 0.08
4 1 -3 0 C B
U 0.50 0.41 0.41 0.25 0.40 0.40 0.98 0.02
5 1 -3 0 C B
U 0.00 0.00 0.00 0.00 0.00 0.00 0.00 0.00
6 1 -3 0 C B
U Θ 0.00 0.00 0.00 0.00 0.00 0.00 0.00 0.00
1 0 -4 0 C B
U 0.80 0.75 0.60 0.54 0.67 0.68 0.99 0.01
2 0 -4 0 C B
U 1.00 0.97 0.83 0.78 0.89 0.94 0.96 0.04
3 0 -4 0 C B
U 0.56 0.70 0.67 0.65 0.65 0.65 1.00 0.00
4 0 -4 0 C B
U 0.93 0.96 0.78 0.84 0.88 0.89 0.99 0.01
5 0 -4 0 C B
U 0.66 0.70 0.65 0.78 0.70 0.70 1.00 0.00
6 0 -4 0 C B
U 0.88 0.79 0.90 0.93 0.88 0.88 0.99 0.01
7 0 -4 0 C B
U 0.94 0.85 0.76 0.96 0.88 0.89 0.98 0.02
8 0 -4 0 C B
U 0.87 0.93 0.86 0.93 0.90 0.90 1.00 0.00
9 0 -4 0 C B
U 0.97 0.99 0.91 0.95 0.95 0.96 1.00 0.00
0 1 -4 0 C B
U 0.93 1.00 0.97 0.95 0.96 0.97 0.99 0.01
1 1 -4 0 C B
U 1.00 0.99 0.97 0.96 0.98 0.99 0.99 0.01
2 1 -4 0 C B
U 1.00 1.00 0.99 0.98 0.99 1.00 1.00 0.00
3 1 -4 0 C B
U 0.95 0.89 0.95 0.91 0.93 0.93 1.00 0.00
4 1 -4 0 C B
U 0.80 0.97 1.00 0.96 0.93 0.96 0.98 0.02
5 1 -4 0 C B
U 0.78 0.94 0.98 0.86 0.89 0.91 0.98 0.02
6 1 -4 0 C B
U 0.88 0.85 0.95 0.72 0.85 0.87 0.98 0.02
1 0 -9 0 C B
U 0.14 0.22 0.38 0.63 0.34 0.37 0.92 0.08
2 0 -9 0 C B
U 0.99 1.00 0.98 0.98 0.99 0.99 1.00 0.00
3 0 -9 0 C B
U 0.29 0.22 0.48 0.65 0.41 0.44 0.94 0.06
4 0 -9 0 C B
U 0.20 0.16 0.41 0.63 0.35 0.38 0.91 0.09
5 0 -9 0 C B
U 0.99 0.99 0.86 1.00 0.96 0.99 0.97 0.03
6 0 -9 0 C B
U 0.91 0.83 0.54 0.67 0.74 0.76 0.97 0.03
7 0 -9 0 C B
U 0.20 0.09 0.08 0.08 0.11 0.12 0.96 0.04
8 0 -9 0 C B
U Θ 0.00 0.00 0.00 0.00 0.00 0.00 0.00 0.00
9 0 -9 0 C B
U Θ 0.00 0.00 0.00 0.00 0.00 0.00 0.00 0.00
0 1 -9 0 C B
U Θ 0.00 0.00 0.00 0.00 0.00 0.00 0.00 0.00
1 1 -9 0 C B
U Θ 0.00 0.00 0.00 0.00 0.00 0.00 0.00 0.00
1 0 -2 1 C B
U 0.75 0.75 0.65 0.63 0.69 0.69 1.00 0.00
2 0 -2 1 C B
U 0.85 0.88 0.84 0.74 0.83 0.83 1.00 0.00
3 0 -2 1 C B
U 0.71 0.70 0.83 0.92 0.79 0.80 0.98 0.02
4 0 -2 1 C B
U 0.29 0.49 0.57 0.74 0.52 0.54 0.96 0.04
5 0 -2 1 C B
U 0.56 0.65 0.65 0.91 0.69 0.72 0.97 0.03
6 0 -2 1 C B
U 0.98 0.92 0.99 0.98 0.97 0.98 0.99 0.01
7 0 -2 1 C B
U 0.68 0.77 0.63 0.87 0.74 0.75 0.99 0.01
8 0 -2 1 C B
U 1.00 1.00 0.99 0.97 0.99 1.00 0.99 0.01
9 0 -2 1 C B
U 0.00 0.00 0.00 0.51 0.13 0.19 0.67 0.33
0 1 -2 1 C B
U 0.08 0.16 0.00 0.57 0.20 0.25 0.80 0.20
1 1 -2 1 C B
U 0.08 0.00 0.00 0.60 0.17 0.24 0.70 0.30
2 1 -2 1 C B
U 0.08 0.16 0.00 0.57 0.20 0.25 0.80 0.20
3 1 -2 1 C B
U Θ 0.00 0.00 0.00 0.00 0.00 0.00 0.00 0.00
4 1 -2 1 C B
U Θ 0.00 0.00 0.00 0.00 0.00 0.00 0.00 0.00
5 1 -2 1 C B
U Θ 0.00 0.00 0.00 0.00 0.00 0.00 0.00 0.00
1 0 -3 1 C B
U 1.00 1.00 0.98 1.00 0.99 1.00 0.99 0.01
2 0 -3 1 C B
U 0.68 0.73 0.84 0.84 0.77 0.78 0.99 0.01
3 0 -3 1 C B
U 0.64 0.70 0.81 0.74 0.72 0.73 0.99 0.01
4 0 -3 1 C B
U 0.99 0.97 0.96 0.83 0.94 0.95 0.98 0.02
5 0 -3 1 C B
U 0.88 0.93 0.91 1.00 0.93 0.95 0.98 0.02
6 0 -3 1 C B
U 0.98 0.93 0.81 0.98 0.93 0.94 0.98 0.02
7 0 -3 1 C B
U 0.94 0.96 0.97 0.90 0.94 0.94 1.00 0.00
8 0 -3 1 C B
U 0.91 0.97 0.95 0.91 0.93 0.94 1.00 0.00
9 0 -3 1 C B
U 1.00 1.00 0.97 1.00 0.99 1.00 0.99 0.01
0 1 -3 1 C B
U 0.99 0.98 1.00 0.99 0.99 1.00 0.99 0.01
1 1 -3 1 C B
U 0.95 0.97 0.98 0.99 0.97 0.98 1.00 0.00
2 1 -3 1 C B
U 0.92 0.95 0.94 0.98 0.95 0.95 1.00 0.00
3 1 -3 1 C B
U 0.98 0.99 1.00 0.97 0.99 1.00 0.99 0.01
4 1 -3 1 C B
U 0.98 0.97 0.99 0.81 0.94 0.98 0.96 0.04
5 1 -3 1 C B
U 0.95 0.99 0.94 0.78 0.91 0.93 0.98 0.02
The genetic diversity figures for the markers
de-tected in the different populations (H0) varied between a
minimum of 0.08 and a maximum of 1.00, in the poly-morphic markes (Table 1). In the majority of markers,
values of H0 were fairly high (0.9 or higher in 49% of
cases), revealing the existence of high genetic diversity in the populations studied and showing that the frequency of the markers detected (band presence) is close to 0.5 for the majority of markers assessed. Contrasting results were obtained by Kubik et al. (2001) using microsatellite markers in seven cultivars of perennial ryegrass, with
val-ues of H0 varying from 0.58 to 0.63. This discrepancy in
the values obtained can be explained in terms of the spe-cies’ life cycles which are very different (annual as op-posed to perennial), and by the different methodology
used for computing H0.
The results obtained for the genetic diversity of
each marker within the populations (Hpop), computed on
the basis of the average genetic diversity of each marker in the four populations, varied from a minimum of 0.11 to a maximum of 0.99 in the polymorphic markers. In
ad-dition, Hpop was high in the majority of markers, being
0.9 or higher in 48% of cases (Table 1).
The total genetic diversity of each marker (Hspecies) was also high in most of the amplified fragments, and when the four populations are taken as a whole, the frequencies of the markers detected are close to 0.5 for the majority of markers. These figures varied from a minimum of 0.12 to a maximum of 1.00 for polymorphic markers, and were 0.9 or higher for 52% of the markers assessed.
Individual analysis of each marker showed that most genetic diversity is confined within the populations: i.e., for 88% of markers, less than 5% genetic diversity is present among the four ryegrass populations studied (Table 1). The markers that showed the most genetic di-versity among the populations (Hspecies – Hpop / Hspecies) were UBC12 (09, 10, 11 and 12), which were not polymorphic in all sampled populations, and thus revealed genetic dif-ferences among the populations of 33, 20, 30 and 20%, respectively (Table 1).
Monomorphic markers for some populations and polymorphic for others, as mentioned above, could con-stitute markers with potential for populational differen-tiation. In addition, there is the possibility of associating these markers with adaptive characteristics which could be influenced by the different environments in which the populations are cultivated. The use of markers UBC12 -09, 10, 11 and 12 in future studies could facilitate the pro-duction of probes or primers with adaptive characteris-tics advantageous to the agrobusiness sector, marking contrasts between populations and segregating in the one or more populations in which they are polymorphic.
Table 2 shows average diversity indexes taking all 82 markers together. The total genetic diversity
fig-ure
H
species was fairly high (0.71) and is very close to the estimated value for genetic diversity withinpopula-tions (
H
pop) of 0.70, showing that the ryegrasspopula-tions present high diversity indexes, that a large part of this diversity is conserved with populations and that little interpopulation genetic diversity is present, since only 2.0% of the total variation is distributed among the popu-lations studied (Table 2). This can be explained by the fact that ryegrass is a cross-pollenating plant with game-tophytic self-incompatibility, and by the fact that these populations are confined in large cultivation areas, reduc-ing the possibility of genetic drift and inbreedreduc-ing, and thus conserving the high genetic diversity of the popula-tions. This high diversity (within populations) could also be explained by the relatively short period of cultivation and artificial selection of forage species, which has not yet allowed ample population differentiation (Breese & Hayward, 1972).
This difficulty in separating populations was also encountered in genetic diversity studies on populations
of various alogamous forage species, such as: Lolium
perenne L. (Huff, 1997; Kubik et al., 2001), Chloris gayana K. (Ubi et al., 2003), Pascopryum smithii (Larson
et al., 2003) and different species of genus Lolium:
(Cresswell et al., 2001). High genetic diversity within populations is consistent with results reported for other alogamous species (Cardoso et al., 2000; Cabral et al., 2002).
The dendrogram indicated that there was no dif-ferentiation between genotypes according to origin, re-vealing a large number of superimpositions across the populations studied (Figure 1). Only one of the groups formed presented a high bootstrapping figure (86%), and this group is formed for all genotypes (except two in population D), which also backs up the evidence in favour of little genetic differentiation between sampled popula-tions. The cophenetic correlation coefficient (r) of 0.84 shows that the adjustment is correct between the similar-ity matrix and the dendrogram obtained.
aintrapopulational genetic diversity; btotal genetic diversity; cproportion of intrapopulational genetic diversity; dproportion of
interpopulation genetic diversity.
Tabela 2 - Estimates of a pop
H , b species
H , c pop
H /Hspecies, d(Hspecies - Hpop)/Hspecies .
r e t e m a r a
P Estimate
0 7 . 0
1 7 . 0
8 9 . 0
2 0 . 0
(Hspecies - Hpop)/Hspecies pop
H /Hspecies
Analysis of the genetic structure and similarity of the populations suggests that before separation, they had gone through a period of gene exchange and that even after the separation event, gene frequency stayed at lev-els similar to the original levlev-els, with no differential se-lection for these genes in the different cultivation areas. However, care is required with this type of generalisation since the study covers only the variations detected by RAPD markers which can be of the non-adaptive type, not subject to selection in differing environments, and hence not differentiating the populations being studied.
In another study, these populations were analysed in terms of morphological characteristics, number of shoots, soil coverage, cycle, leaf area, number of leaves, average leaf area, dry leaf weight, dry stem weight, total dry weight and leaf: stem ratio (Castro et al., 2003). Of these characteristics, only the number of shoots and the cycle differentiated the four populations, and soil cover-age was different for population B.
Thus, low interpopulation genetic diversity is consistent with high morphological similarity between individuals, suggesting that the selection process imple-mented, rather than being a conscious effort, was the re-sult of mechanized seed collection, so that the popula-tions became differentiated in terms of cycle and the num-ber of shoots. In this way, as also observed by Castro et al. (2003), the population with the most divergent indi-viduals, in both morphological and molecular terms, was
population D (Figure 1), showing that this population, al-though no different in terms of genetic diversity from the other populations, contained some very contrasting indi-viduals. This could provide a starting point for the selec-tion of new populaselec-tions.
ACKNOWLEDGEMENTS
To FAPERGS, CNPq and CAPES for help re-ceived, and grants for post-graduation and research pro-ductivity.
REFERENCES
AGA, E.; BRYNGELSSON, T.; BEKELE, E.; SALOMON, B. Genetic diversity of forest Arabica coffee (Coffea Arabica L.) in Ethiopia as revealed by random amplified polymorphic DNA (RAPD) analysis.
Hereditas, v.138, p.36-46, 2003.
ARAÚJO, A.A. Forrageiras para ceifa: capineiras, fenação e ensilagem. Porto Alegre: Sulina, 1978. 169p.
AULER, N.M.F.; REIS, M.S.; GUERRA, M.P.; NODARI, R.O. The genetics and conservation of Araucaria angustifolia: I. Genetic structure and
diversity of natural populations by means of non-adaptative variation in the state of Santa Catarina, Brazil. Genetics and Molecular Biology,
v.25, p.329-338, 2002.
BORRILL, M. Temperate grasses. In: SIMMONDS, N. (Ed.) Evolution of crop plants. London: Logman, 1986. p.137-142.
BREESE, E.L.; HAYWARD, M.D. The genetic basis of present breeding methods in forage crops. Euphytica, v.21, p.324-336, 1972.
CABRAL, B.L.R.; SOUZA, J.A.de.; ANDO, A.; VEASEY, E.A.; CARDOSO, E.M.R. Isoenzymatic variability in cassava accessions from different regions in Brazil. Scientia Agricola, v.59, p.521-527, 2002. CARAMBULA, M. Producción y manejo de pasturas sembradas.
Montevideo: Hemisfério Sur, 1971. 463p.
CARDOSO, S.R.S.; ELOY, N.B.; PROVAN, J.; CARDOSO, M.A.; FERREIRA, P.C.G. Genetic differentiation of Euterpe edulis Mart. populations estimated by AFLP analysis. Molecular Ecology, v.9, p.1753-1760, 2000.
CASTRO, C.M.; OLIVEIRA, A.C. de.; CARVALHO, F.I.F. de.; MAIA, M. de. S.; MATTOS, L.A.; FREITAS, F. Morphological and molecular characterization of Italian ryegrass populations. Crop Breeding and Applied Biotechnology, v.3, p.245-254, 2003.
CHAI, B.; STICKLEN, M.B. Applications of biotechnology in turf grass genetic improvement. Crop Science, v.38, p.1320-1338, 1998. CRESSWELL, A.; HAMILTON, N.R.S.; ROY, A.K.; VIEGAS, M.F. Use
of amplified fragment length polymorphism markers to assess genetic diversity in Lolium species from Portugal. Molecular Ecology, v.10,
p.229-241, 2001.
CRUZ, R.P.; MILACH, S.C.K. Análise de RAPD. In: MILACH, S.C.K. (Ed.) Marcadores moleculares em plantas. Porto Alegre: Universidade Federal do Rio Grande do Sul, 1998. p.107-116.
DICE, L.R. Measures of the amount of ecological association between species. Ecology, v.26, p.297-307, 1945.
FU, C.; QIU, Y.; KONG, H. RAPD analysis for genetic diversity in Changium myrnioides. Botanical Bulletin of Academia Sinica, v.44, p.13-18, 2003. HAMRICK, J.L. Isozymes and the analysis of genetic structure in plant populations. In: SOLTIS, E.D.; SOLTIS, O.S. (Ed.) Isozymes in plant biology. London: Chapman & Hall, 1990. p.87-105.
HUFF, D.R. RAPD characterization of heterogeneous perennial ryegrass cultivars. Crop Science, v.37, p.557-564, 1997.
KUBIK, C.; SAWKINS, M.; MEYER, W.A.; GAUT, B.S. Genetic diversity in seven perennial ryegrass (Lolium perenne L.) cultivars based on SSR
markers. Crop Science, v.41, p.1565-1572, 2001.
LARSON, S.R.; PALAZZO, A.J.; JENSEN, K.B. Identification of western wheatgrass cultivars and accessions by DNA fingerprinting and geographic provenance. Crop Science, v.43, p.394-401, 2003. LEWONTIN, R.C. The apportionment of human diversity. Evolutionary
Biology, v.6, p.381-398, 1972.
Figure 1 - Dendrogram of 60 individuals sampled at random in the four ryegrass populations (A, B, C e D), derived from RAPD analysis using the Dice similarity index (1945) and the UPGMA grouping method. Values in % indicate the number of times genotypes grouped together in 100 cycles of bootstrapping using the Winboot software. The cophenetic correlation coefficient (r) is 0.84.
C ffi i
0.35 0.47 0.59 0.71 0.84
A
A B A A B A B A A A A B B B C D B B C C C D D B D A D D C A A A C C B D C A C B D B D C C D B A A B C D D B D C C C D D 86%
41%
57%
56%
39%
43%
Received July 31, 2003 Accepted April 28, 2004 MAIA, M.S. Secagem de sementes de azevém anual (Lolium moltiflorum
Lam.) com ar em ambiente controlado. Pelotas, 1995. 108p. (Tese -Doutorado) – Faculdade de Agronomia “Eliseu Maciel”, Universidade Federal de Pelotas.
MOTA, F.S.; BERNY, Z.B.; MOTA, J.F.A.S. Índice climático de crescimento de pastagens naturais no Rio Grande do Sul. Pesquisa Agropecuária Brasileira, v.16, p.453-472, 1981.
OLIVEIRA, A.C. de.; RICHTER, T.; BENNETZEN, J.L. Regional and racial specificities in sorghum germplasm assessed with DNA markers.
Genome, v.39, p.579-587, 1996.
OUBORG, N.J.; PIQUOT, Y.; van GRONENDAEL, J.M. Population genetics, molecular markers and the study of dispersal in plants. Journal of Ecology, v.87, p.551-568, 1999.
POWEL, W.; MACHRAY, G.C.; PROVAN, J. Polymorphism revealed by simple sequence repeats. Trends in Plant Science, v.1, p.215-222, 1996a. POWEL, W.; MORGANTE, M.; ANDRE, C.; HANAFEY, M.; VOGEL, J.; TINGEY, S.; RAFALSKI, A. The comparison of RFLP, RAPD, AFLP and SSR (microsatellite) markers for germplasm analysis. Molecular Breeding, v.2, p.225-238, 1996b.
POWEL, W.; OROZCO-CASTILLO, C.; CHALMERS, K.; PROVAN, J.; WAUGH, R. Polymerase chain reaction-based assays for the characterization of plant genetic resources. Electrophoresis, v.16, p.1726-1730, 1995.
ROHLF, F.J. NTSYS-pc Numerical taxonomy and multivariate analysis system. New York: Exeter Publishing Co, 2000.
SAGHAI-MAROOF, M.A.; SOLIMAN, K.M.; JORGENSEN, R.A.; ALLARD, R.W. Ribosomal DNA spacer length polymorphism in barley: Mendelian inheritance, chromosome location and population dynamics.
Proceedings of the National Academy of Sciences of the USA., v.89, p.1477-1481, 1984.
SOKAL, R.R.; ROHLF, F.J. The comparison of dendrograms by objective methods. Taxon, v.11, p.30-40, 1962.
SPEDDING, C.R.W.; DIEKMAHNS, E.C. Grasses and legumes in British agriculture. Bucks: CAB, 1972. 250p.
SWEENEY, P.M.; DANNEBERGER, T.K. Random amplified polymorphic DNA in perennial ryegrass: A comparison of bulk samples vs. Individuals.
HortScience, v.29, p.624-626, 1994.
SWEENEY, P.M.; GOLEMBIEWSKI, R.; DANNEBERGER, T.K. Random amplified polymorphic DNA analysis of dry turf grass seed. HortScience, v.31, p.400-401, 1996.
UBI, B.E.; KÜLLIKER, R.; FUGIMORI, M.; KOMATSU, T. Genetic diversity in diploid cultivars of rhodes grass determined on basis of amplified fragment length polymorphism markers. Crop Science, v.43, p.1516-1522, 2003.
YANG, W.; OLIVEIRA, A.C. de.; GODWIN, I.; SCHERTZ, K.; BENNETZEN, L. Comparison of DNA marker technologies in characterizing plant genome diversity: variability in Chinese sorghums.
Crop Science, v.36, p.1669-1676, 1996.
YAP, I.V.; NELSON, R.J. Winboot: a program for performing bootstrap analysis of binary data to determine the confidence limits of UPGMA-based dendrograms. Manila: IRRI, 1996. 22p.
YUN, R.; ZHONG, M.; WANG, H.X.; WEI, W.; HU, Z.A.; QIAN, Y.Q. Study on DNA diversity of Liaodong populations at Dongling mountain region. Acta Botanica Sinica, v.40, p.169-175, 1998.
WHITKUS, R.; CRUZ, M.D.L.; MOTA-BRAVO, L.; GOMEZ-POMPA, A. Genetic diversity and relationships of cacao (Theobroma cacao L.)