The association of
CAPN1
316 marker genotypes with growth
and meat quality traits of steers finished on pasture
María C. Miquel
1, Edgardo Villarreal
2, Carlos Mezzadra
2, Lilia Melucci
3, Liliana Soria
1,
Pablo Corva
3and Alejandro Schor
41
Área Genética, Facultad de Ciencias Veterinarias, Universidad de Buenos Aires, Buenos Aires, Argentina.
2
Departamento de Producción Animal, Estación Experimental Balcarce,
Instituto Nacional de Tecnología Agropecuaria, Balcarce, Buenos Aires, Argentina.
3
Departamento de Producción Animal, Facultad de Ciencias Agrarias,
Universidad Nacional de Mar del Plata, Balcarce, Buenos Aires, Argentina.
4
Laboratorio de Tecnología de Carnes, Facultad de Agronomía, Universidad de Buenos Aires,
Buenos Aires, Argentina.
Abstract
The objective of this paper was to determine the association of a SNP in them-calpain gene at position 316 with growth and quality of meat traits of steers grown on pasture. Fifty-nine Brangus and 20 Angus steers were genotyped forCAPN1 316. Warner Bratzler shear force was measured in l. lumborum samples after a 7-day aging period. A multivariate analysis of variance was performed, including shear force (WBSF), final weight (FW), average daily gain (ADG), backfat thickness (BFT), average monthly fat thickness gain (AMFTG), rib-eye area (REA), and beef rib-eye depth (RED) as dependent variables. TheCAPN1 316 genotype was statistically significant. Univariate analyses were done with these variables. The marker genotype was statistically significant (p < 0.05) for WBSF (kg: CC: 4.41±0.57; CG: 5.58±0.20; GG: 6.29±0.18), FW (kg: CC: 360.23±14.71; CG: 381.34±5.26; GG: 399.23±4.68), and ADG (kg/d: CC: 0.675±0.046; CG: 0.705±0.016; GG: 0.765±0.014) Shear force, final weight and average daily gain were significantly different according to theCAPN1 316 marker genotypes. The marker genotype was sta-tistically significant in the multivariate analysis (p = 0.001). The first characteristic root explained 89% of the differ-ences among genotypes. WBSF, FW and ADG were the most important traits in the first vector, indicating that animals with the marker genotype for lowest WBSF also have the lowest FW and ADG.
Key words:beef cattle, tenderness, growth, molecular marker, multivariate analysis. Received: May 28, 2008; Accepted: February 17, 2009.
Introduction
Bovine meat quality is defined by several traits that are difficult to evaluate in the live animal. Recently, signifi-cant research efforts have focused on the identification of genes influencing production traits in beef cattle, including meat quality. Because of its relevance, meat tenderness has received special attention. In this context, one of the most studied genes isCAPN1, which encodes the large subunit of m-calpain, an enzyme involved in the post-mortem tende-rization process (Koohmaraie, 1996). Page et al. (2002) were among the first research groups who identified SNPs (Single Nucleotide Polymorphisms) in this gene, which turned out to be associated with differences in tenderness
(Pageet al., 2004). Soriaet al.(2006), in a previous work using the same data set as the present paper, confirmed an effect of a SNP in position 316 (CAPN1316) on meat ten-derness, measured after a 7-day aging period.
According to Marshall (1999), genetic correlations involving technological quality attributes have not been widely studied, probably due to the difficulties in obtaining appropriate data, although there is some evidence of an as-sociation between meat quality and growth traits. When ge-netic markers are evaluated as possible selection tools for a given trait, it is also necessary to evaluate the consequences on other traits of choosing animals carrying the favorable marker.
The objective of this paper was to determine the as-sociation of an SNP in position 316 of them-calpain gene with growth and meat quality traits of steers grown on pas-ture.
www.sbg.org.br
Send correspondence to María C. Miquel. Área Genética, Facultad de Ciencias Veterinarias, Universidad de Buenos Aires, Chorroarin 280, 1427 Buenos Aires, Argentina. E-mail: [email protected].
Materials and Methods
A study was conducted on 59 Brangus and 20 Angus steers.
The Brangus steers were representative of the breeds of three different commercial herds (BR1, BR2 and BR3). Each breeder contributed with 20 steers, but one BR3 steer had to be excluded from the analysis because, as its data were out of range (widely exceeding 3s), it was assumed that an error had occurred in the WBSF measurement. The animals were raised on pastures in their original herds until weaning, which occurred in March, 2004. In April, they were transferred to the Balcarce Experimental Station, Na-tional Institute of Agricultural Research (INTA), where they were finished on perennial pastures. Individual sire identifications were not available.
The Angus steers were chosen at random from two herds at the Balcarce Experimental Station. One of these herds produced their own replacements (A1). The cows of the other herd had their origin in this same herd, but com-mercial bulls had been introduced (A2). Ten A1 and ten A2 steers were used in this experiment. In that particular year (2004), the A1 and A2 herds had been sired by four and seven bulls, respectively. Thus, the animals were grouped in five breed-herd-of-origin groups (A1, A2, BR1, BR2, and BR3).
Fattening started in April, 2004, on perennial, fertilized pastures, when the animals were about 8 to 10 months old, and ended in June, 2005. The steers were weighed monthly, and ultrasound backfat thickness, as well as rib-eye area and depth (smallest diameter) were measured. The steers were slaugh-tered when at least 50% of a breed-herd group reached 6 mm of backfat thickness. Hence, slaughter took place between March and May, 2005, and the slaughter group was deliber-ately confounded with the breed-herd group.
The animals were slaughtered at a commercial beef processing facility after 24 h rest in paddocks with avail-able water, following SENASA (National Service for Ani-mal Health) rules. Meat tenderness was measured as War-ner-Bratzler shear force (kg) at 7 days post-mortem. After slaughter and following a 24 h cooling period at 1 to 5 °C, the block of steaks corresponding to the 11th, 12thand 13th ribs was removed from each left half carcass. The block was deboned and divided into three pieces that were vac-uum-packed.
One of these pieces was randomly assigned to matu-ration treatment at 1-5 °C. After ageing, the meat samples were frozen and kept at -20 °C until they were thawed for the Warner-Bratzler determination (WBSF), performed at the Meat Laboratory of the School of Agriculture at the University of Buenos Aires. Steaks (2.5 cm thick) were thawed at room temperature for 24 h. External fat, periph-eral connective tissue and muscles were removed from each steak, leaving only thelongissimus lumborummuscle. Samples were immersed in plastic bags and boiled in a wa-ter bath at 70 °C for 50 min. The cooked steaks were cooled under running tap water for 40 min. The bags were drained and the cuts were gently mopped dry with a paper towel. Five 2.5 cm-diameter cores were removed from each steak, parallel to the muscle fibers. The cores were sheared at their middle point with a 50 kg compression load cell and a Warner-Bratzler V-notch blade mounted on an Instron Tes-ting Machine (model 4442), at a crosshead speed of 50 mm/min. A single peak-shear force measurement was obtained for each core, and these results were averaged to obtain a single WBSF (kg) value for each sample.
Genotyping
DNA was extracted from 500mL of blood using the phenol/chloroform method and ethanol precipitation, and resuspended in 10 mM Tris HCl buffer.
CAPN1 316 is a cytosine/guanine (C/G) polymor-phism in exon 9 of theCAPN1gene on BTA 29 (Pageet al., 2002). SNP 316 was genotyped by the PCR-RFLP method (Soriaet al., 2006). Primers were selected from theCAPN1 DNA sequence (GenBank accession AF252504). The pri-mer sequences used for genotyping the 316 marker were:
Forward: CCAGGGCCAGATGGTGAA, and re-verse: CGTCGGGTGTCAGGTTGC.
The annealing temperature was 62.5 °C, and the am-plified DNA was digested with theBtgl enzyme (New Eng-land Biolabs, Beverly, MA).
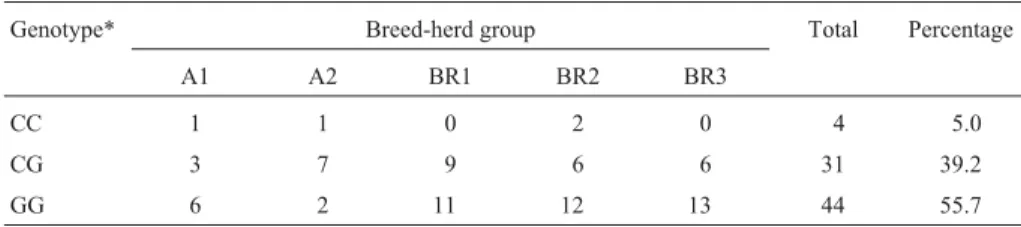
Table 1 shows the distribution of steers per breed-herd of origin group and theCAPN1316 genotypes found (Soriaet al., 2006).
Statistical analyses
Monthly weight and backfat measurements were used to calculate individual average daily gain (ADG) and aver-age monthly backfat gain (AMBG) by regression.
Table 1- Distribution of steers per breed-herd group andCAPN1316 genotype.
Genotype* Breed-herd group Total Percentage
A1 A2 BR1 BR2 BR3
CC 1 1 0 2 0 4 5.0
CG 3 7 9 6 6 31 39.2
GG 6 2 11 12 13 44 55.7
Univariate analyses of variance were performed for the fol-lowing dependent variables: WBSF, AMBG, ADG, and fi-nal weight (FW), which was the last weight taken before slaughter, and the last ultrasound measurements of backfat thickness (BFT), rib-eye area (REA) and rib-eye depth (RED). Fixed effects were the breed-herd group (A1, A2, BR1, BR2, BR3) and theCAPN1316 genotype (CC, CG, GG). Contrast analyses were performed to test for non-additive or dominance effects: CG- (CC+GG) for the statistically significant traits.
A multivariate analysis of variance was made, includ-ing WBSF, AMBG, ADG, FW, BFT, REA and RED. The fixed effects were the same as in the univariate analyses, i.e., breed-herd group andCAPN1316 genotype.
It was of special interest to test the null hypothesis of noCAPN1genotype effect. The alternative was a genotype effect different from zero. For this purpose, we used the Hotelling-Lawley trace test statistics as the multivariate linear hypothesis and Roys greatest characteristic root sta-tistics (Morrison, 1967).
If statistically significant differences are found be-tween genotypes, the inspection of characteristic vectors al-lows detecting traits with major influence on those differences.
Correlations of the canonical variables with the traits were calculated, in order to allow subjective comparisons among coefficients. Averages of canonical variables for eachCAPN1316 genotype were obtained.
Characteristic roots and vectors were obtained from E -1 H, where H is the matrix of sums of squares and products amongCAPN1genotypes, and E is the matrix of error sum of squares and products. Since the rank of E -1 H is two, the characteristic roots and vectors obtained were two.
Other statistical calculations performed were: 1) pro-duct-moment correlations between the animals’ canonical variable and each trait measured in the animal, indicating the importance of the traits in the canonical variable and, consequently, in the differences amongCAPN1genotypes;
2) means of the two canonical variables for eachCAPN1 genotype, obtained by multiplying the vector of theCAPN1 genotypes least squares means of the dependent variables by the characteristic vector. The SAS program (SAS Insti-tute Inc., 1999) was used for all analyses.
Results and Discussion
In the univariate analyses, all traits differed (p < 0.05) among breed-herd groups (results not shown), whereas the marker genotype was significant only for WBSF, ADG and FW (p < 0.05). The least squares means for each marker ge-notype are presented in Table 2. For those traits for which the differences among genotypes were statistically signifi-cant, the CC means were not different from those of CG, and the means of both these genotypes were lower than those of GG (p < 0.05). The lack of significant differences between CC and CG may be due to the high standard errors found for CC, resulting from the low number of animals carrying this genotype. The genotype effects on WBSF, ADG and P15 were consistent with additive marker effects, since none of the tests for non-additive effects performed on them was statistically significant (p = 0.52, 0. 63 and 0.86, respectively).
Multivariate analysis (Hotelling-Lawley Test) indi-cated differences in genotypes and breed-herd groups. Sim-ilarly, the Hotelling-Lawley Trace and Roy’s greatest characteristic root tests were statistically significant for ge-notypes (p = 0.0010 and p < 0.0001 respectively). A differ-ence was also found for breed-herd groups (p < 0.0001, both tests).
Characteristic vectors 1 and 2 for genotypes, their characteristic roots and the correlations between canonical variables and the traits are shown in Table 3.
Eighty-nine percent of the differences between geno-types were due mainly to differences in WBSF, FW and ADG. During fattening, steers which were homozygous for allele G at marker position 316 grew faster (higher ADG), were heavier at a similar backfat thickness, and their meat
Table 2- Least squares means and standard errors for WBSF, BF, REA, RED, AMBG, ADG and FW byCAPN1genotypes.
Trait CAPN1genotype*
CC n = 4 CG n = 31 GG n = 44
WBSF (kg) 4.41±0.57a 5.58±0.20a 6.29±0.18b BFT (mm) 5.86±0.54 6.04±0.19 5.98±0.17 REA (cm2)
47.13±3.76 51.86±1.34 50.81±1.19 RED (cm) 5.01±0.28 5.64±0.10 5.65±0.09 AMBG (mm/month) 0.345±0.057 0.365±0.020 0.366±0.018 ADG (kg/d) 0.675±0.046a 0.705±0.016a 0.765±0.014b FW (kg) 360.23±14.71a 381.34
±5.26a 399.23
±4.68b
*C: cytosine; G: guanine. WBSF: Warner-Bratzler shear force; BFT: backfat thickness; REA: rib-eye area, RED: rib-eye depth; AMBG: average monthly backfat gain; ADG: average daily weight gain; FW: final weight.
had higher WBSF values than steers with genotypes CG and CC (Table 2). RED and REA, this last one with a nega-tive coefficient in the vector, also contributed to explain the differences among genotypes, but to a lesser degree.
Vector 2, orthogonal to the first one, explained the re-maining 11% of the variance. The correlations of RED and REA with the canonical variable were the highest, while the correlations of all the other traits with the canonical vari-able were low, indicating their small influence on the dif-ferences among genotypes explained by this vector.
BFT and AMBG were not important for the differen-tiation of genotypes in any one of the vectors. This result was expected, once all steers were slaughtered at a similar BFT.
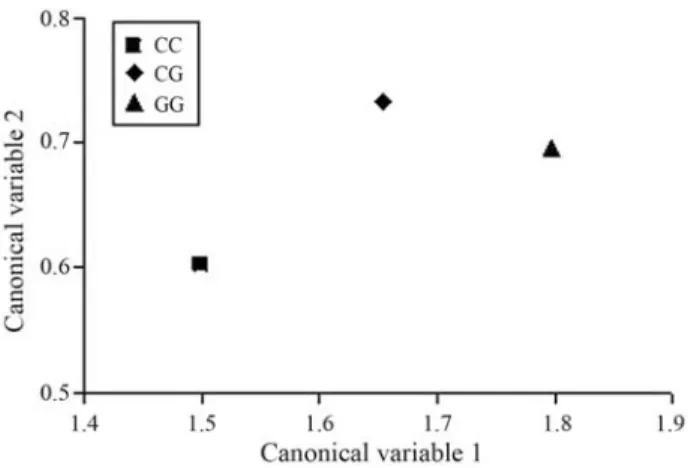
The canonical variables 1 and 2 for each genotype are shown in Figure 1. The canonical variable 1 for CG was in-termediate between CC and GG, which is in accordance with the fact that the CG least square means were also inter-mediate between the homozygotes (Table 2) for the impor-tant traits in the vector. The canonical variable 2 for CG was higher than those of both homozygotes. This higher value is a consequence of the similar average of genotype CG and GG for RED, and the higher (although not statisti-cally significant) mean value of CG for REA as compared to both homozygotes (Table 2).
According to the results of the multivariate analysis of variance, if animals were selected based on this marker, a genetic improvement regarding WBSF would be expected, as reported by Pageet al.(2004). But, according to these re-sults, the animals would also be selected for phenotypic traits other than WBSF, such as changes in weight, with constant backfat thickness and daily gain in the fattening finishing period. Moreover, as shown by the characteristic vector 2, changes in rib-eye area and rib-eye depth might be expected, but to a lesser degree.
In the present paper, the analysis was based on pheno-typic data, but reports from the literature indicate that, along with loci affecting beef tenderness, other loci associ-ated with weaning weight and carcass weight were mapped to the distal region of bovine chromosome 29 BTA29 (Cat-tle Quantitative Trait Locus data base). Casaset al.(2003) found that chromosome 29 might harbor QTLs for weaning weight, hot carcass weight and WBSF. Support intervals indicate that they are very close and probably overlap. The positions of these QTLs may lead to genetic correlations among these traits.
On the other hand, it is well known that the genetic and phenotypic correlations among weights at different ages are positive (Woldehawariatet al., 1977), as are the correlations (genetic and phenotypic) with carcass weight (Wilsonet al., 1976). Thus, it is possible that WBSF shows an association with FW, and that selection for this marker may lead to changes in both traits and also in ADG [impor-tant in the vector and correlated genetically with FW (Wol-dehawariat et al., 1977)]. Thus, if a positive correlation between FW and WBSF is confirmed, selection for FW may result in animals with less tender meat if the animals are selected for this gene.
The importance of REA in canonical variable 1 may be explained by the association of REA with different weights: a positive genetic correlation with carcass weight was reported (Marshall, 1999), which is genetically corre-lated with slaughter weight (Wilsonet al., 1976). It is prob-able that RED, a lineal measure of the beef, is associated with REA.
The importance of REA and RED in vector 2 being orthogonal to vector 1 is that it indicates that, besides their contribution to the differences among genotypes because of
Figure 1- Canonical variables 1 and 2 for theCAPN1genotypes which in-clude WBSF: Warner-Bratzler shear force; BFT: backfat thickness; REA: rib-eye area; RED: rib-eye depth; AMBG: average monthly backfat gain; ADG: average daily weight gain; FW: final weight.
Table 3- Characteristic vectors and roots for genotypes, and correlations between the canonical variable and the traits.
Traits Root (%)
WBSF BFT REA RED AMBG ADG FW
Vector 1 0.0825 0.0059 -0.0044 0.0142 -0.4223 0.4733 0.0029 0.55(89)
Correlation 0.63 0.02 0.33 0.45 0 0.68 0.79
Vector 2 0.0199 -0.0344 0.0195 0.0989 0.0864 -0.0777 -2 x 10⁻⁴ 0.06(11)
Correlation 0.19 0.23 0.59 0.75 0.19 -0.11 0.18
their association with weight, there are other causes con-tributing to these differences. Although the genotype effect for REA was not statistically significant (Table 2), its geno-type means rank was different from the genogeno-type ranks of other traits, with a heterozygote value higher than that of both homozygotes. The RED means also followed a differ-ent pattern than those of the other traits, since the means of CG and GG were similar and both were higher than that of CC. This differential behavior of REA and RED with re-spect to the other analyzed traits is probably enhanced by this vector. The lack of statistical significance in the uni-variate tests and the low (11%) percentage of the variance explained by this vector are indicative of a weak associa-tion between these traits andCAPN1316.
If animals are selected for higher growth, their meat will be tougher, according to vector 1, and intermediate for muscular development, according to vector 2, although, since this vector explained only 11% of the differences among genotypes, probably not much change in muscular-ity should be expected.
Partial correlation coefficients were obtained among the dependent variables (Table 4) from the error sums of square matrices of the multivariate analysis of variance. The partial correlation between WBSF and FW was nega-tive (Table 4). On the other hand, it had been observed that the coefficients for both traits in the characteristic vectors were positive. Therefore, the association of WBSF and FW appeared to be positive when their averages were analyzed by genotype, but negative when the data were analyzed within breed-herd group and genotype (Table 4). These re-sults suggest that there is a positive phenotypic correlation between WBSF and FW amongCAPN1genotypes. There-fore, selecting animals for this marker would generate same-sign phenotypic selection for WBSF, FW and ADG, but, in addition to this association, an association among other gene effects and environmental conditions may gen-erate an opposite-sign association. The values of genetic correlations between meat tenderness and growth traits found in the literature are very variable. Marshall (1999) re-viewed several papers and concluded that there was a
nega-tive genetic correlation of 0.19 with a rank of 0.0 to -0.47, same-sign association as the partial phenotypic correlation found in this paper. However, among the factors that may be causing the variability of the estimates of the genetic correlations between tenderness and other traits, there is the fact that meat tenderness is the result of the action of many genes and pre- and post-slaughter environmental factors, and the experiments required for estimating it are complex and costly. WBSF is highly dependent on the maturation period, so that an average value may not apply to the condi-tions of this experiment. In the present study, only meat with a seven-day maturation period was taken into account, and the gene considered (CAPN1) has an effect on tender-ness specifically within this period. No extrapolations can therefore be made to other data sets concerning different meat aging processes.
Genetic correlations are the result that dictate the as-sociation of breeding values for genes coding for traits of interest. In this paper, only the phenotypic variability of the traits was analyzed. In view of the results, it would be desir-able to generate information that allows working with the genetic variability of the traits studied, which might pro-vide a better explanation for our findings. For example, breeding instead of phenotypic values could be used, which were not available for this data set. A larger number of ani-mals would also be desirable, especially because of the low frequency of genotype CC. It is also possible that in this sample there was a particular association of alleles in chro-mosome 29, which may not necessarily occur in other sam-ples too. The aging of the meat is a very important factor in determining WBSF values. Therefore, experiments with meat maturing periods different from the 7 days considered here will certainly show different results. Considering one gene at a time, their direct and correlated effects are only a small contribution to the phenotypic result. As the number of individual genes studied increases, it will be possible to disentangle the nature of these complex biological pro-cesses taking place in particular environments.
The method of analysis used in this study is suitable for exploring the association of the molecular markers with several traits.
In conclusion, along with tenderness of aged meat, other traits such as final weight and average daily gain dif-ferentiated theCAPN1316 marker genotypes in this study. Choosing animals with the favorableCAPN1316 marker genotype for tenderness resulted in selecting animals with lower average daily gain and final weight. Further experi-ments with larger samples should be conducted, in order to explore the consequences of selection for the marker on other economically important traits. Since antagonism be-tween selection criteria is not uncommon in animal breed-ing, a careful analysis of correlated responses is required before establishing long-term selection objectives in beef cattle.
Table 4- Partial correlation coefficients among dependent variables.
WBSF BFT REA RED AMBG ADG FW
WBSF 1.0 -0.21 0.02 0.03 -0.22 -0.23* -0.27*
BFT 1.0 0.14 0.12 0.79* 0.33* 0.46*
REA 1.0 0.63* 0.02 0.19 0.24*
RED 1.0 -0.02 0.17 0.30*
AMBG 1.0 0.50* 0.54*
ADG 1.0 0.71*
WBSF: Warner-Bratzler shear force; BFT: backfat thickness; REA: rib-eye area, RED: rib-rib-eye depth; AMBG: average monthly backfat gain; ADG: average daily weight gain; FW: final weight.
Acknowledgments
This research was funded by PICTR 00177 (SECYT) of Argentina. Brangus steers were obtained through Asociación Argentina de Brangus. A. Birchmeier contrib-uted with editing of data.
References
Casas E, Shackelford SD, Keele JW, Koohmaraie M, Smith TPL and Stone RT (2003) Detection of quantitative trait loci for growth and carcass composition in cattle. J Anim Sci 81:2976-2983.
Koohmaraie M (1996) Biochemical factors regulating the tough-ening and tenderization processes of meat. Meat Sci 43:S193-S196.
Marshall DM (1999) Genetics of meat quality. In: Fries R and Ruvinsky A (eds) The Genetics of Cattle. CABI publishing, Oxon, pp 605-636.
Morrison DF (1967) Multivariate Statistical Methods. McGraw-Hill Book Company, New York, 338 pp.
Page BT, Casas E, Heaton MP, Cullen NG, Hyndman DL, Morris CA, Crawford AM, Wheeler TL, Koohmaraie M, Keele JW,
et al.(2002) Evaluation of single-nucleotide polymorphisms in CAPN1 for association with meat tenderness in cattle. J Anim Sci 80:3077-3085.
Page BT, Casas E, Quaas RL, Thallman RM, Wheeler TL, Shackelford SD, Koohmaraie M, White SN, Bennett GL, Keele JW,et al.(2004) Association of markers in the bovine
CAPN1 gene with meat tenderness in large crossbred popu-lations that sample influential industry sires. J Anim Sci 82:3474-3481.
SAS Institute Inc. (1999) SAS/STAT User’s Guide, v. 6. SAS Inst Inc., Cary, NC.
Soria LA, Corva PM, Branda Sica A, Schor A, Melucci L, Vil-larreal E, Mezzadra C and Miquel MC (2006) Efecto de tres SNP del gen CAPN1 sobre la terneza de la carne en novillos. XXXV Congreso Argentino de Genética, San Luis, Argen-tina.
Wilson LL, McCurley JR, Ziegler JH and Watkins JL (1976) Ge-netic parameters of live and carcass characters from progeny of polled Hereford sires and Angus-Holstein cows. J Anim Sci 43:569-576.
Woldehawariat G, Talamantes MA, Petty Jr RR and Cartwright TC (1977) A summary of genetic and environmental statis-tics for growth and conformation traits of young beef cattle. Dept of Anim Sci Tech Rep n. 103. Texas A&M University, College Station, Texas.
Internet Resources
Cattle Quantitative Trait Locus database, http://www.animalgenome.org/QTLdb/cattle.html (March 15, 2008).
Associate Editor: Pedro Franklin Barbosa