ABSTRACT: Fusarium oxysporum f. sp. passiflorae W.L. Gordon (FOP) is one of the most im-portant fungal pathogens of passion fruits. Understanding molecular variation of isolates from different areas is of utmost importance. Molecular fingerprinting on 14 isolates of FOP were conducted using AFLP molecular markers (Amplified Fragment Length Polymorphism), and their genetic variability were estimated. Twenty-five AFLP primer combinations were selected for am-plification of FOP isolates and one for Fusarium oxysporum f. sp. cubense W.C. Snyder & H.N. Hansen (FOC), resulting in 99% polymorphic fragments, with an average of 40 fragments per primer combination. Specific fingerprints could be generated for most of the isolates evaluated; we observed a high power of discrimination of the AFLP primer combinations, with the presence/ absence of up to 26 specific fragments per isolate. Thus, specific fingerprinting was obtained for 10 of the 15 isolates analyzed. The values of the polymorphic information content, the index and the resolving power of the markers showed wide variation and refl ected the high informa- of the markers showed wide variation and reflected the high informa-tive contents of the primers used in the characterization of the FOP isolates. The FOP isolates were divided into four groups, irrespective of their geographic origins, with the allocation of 5, 7, 1 and 1 FOP isolates into Groups II, III, IV and V, respectively. A wide genetic diversity was observed in FOP isolates, which should be taken into consideration when implementing strate-gies for the improvement of passion fruit in the search for cultivars with multiple resistance to different isolates.
Keywords:passion fruit, fusarium wilt, fingerprint, variability, molecular marker
Introduction
Brazil is the world’s largest producer and con-sumer of passion fruit (Passiflora edulis Sims f. flavicar-pa Deg.), with approximately 62,000 hectares cultivated and an annual production of 920,000 tons. The states of Bahia, Espírito Santo, and Ceará are responsible for ap-proximately 73% of the national production. However, recently yield has decreased due to disease problems, es-pecially with the occurrence of fusarium wilt caused by
Fusarium oxysporum f. sp. passiflorae W.L. Gordon (FOP) (McKnight, 1951).
Knowledge of the genetic diversity of FOP has con-tributed to the development of disease control strategies (Kistler et al., 2001), as some of these pathogens have a high capacity of variation, and their apparent absence of a sexual stage is compensated by other processes that en-sure permutation and maintenance of genetic diversity (Kistler et al., 1992; Leslie, 1993). Fungi with a high level of genetic diversity can be difficult to control, as they tend to adapt more quickly to any control measure, such as the introduction of a resistant cultivar.
FOP isolates obtained from infected plants in vari-ous production regions show some morphological differ-ences in colony growth, although the degree of pathogen aggressiveness in relation to the appearance of disease symptoms in different varieties of passion fruit is not effectively known. Morphological and genetic differenc-es between FOP isolatdifferenc-es may be associated with their
pathogenicity, and these observations must be taken into consideration when the passion fruit germplasm is screened for sources of resistance and, later, in the de-velopment of resistant cultivars.
In order to do so, it is vital to better understand the genetic variability of the FOP isolates, which are still unknown. Recently, molecular techniques have been in-creasingly used in studies of genetic diversity and spe-cies phylogeny,or for the characterization of populations of F. oxysporum within and between formae speciales
(Baayen et al., 2000; O’Donnell, 2000; Abd-Elsalam et al., 2004; Bogale et al., 2006; Groenewald et al., 2006; Stewart et al., 2006). Among these techniques, AFLP (Amplified Fragment Length Polymorphism) is a class of marker frequently used (Zeller et al., 2003; Belabid et al., 2004).
Amplified Fragment Length Polymorphism (AFLP) markers are extremely powerful because of their high multiplex power, i.e., enabling the generation of a large number of bands per gel (amplification). Therefore, it has high potential for the development of specific prim-ers in the identification of isolates. Given these needs and the molecular tools available, this study was con-ducted to assess the possibility of developing specific fingerprinting within the formae speciales of FOP to be able to trace the presence of these isolates in the main passion fruit-producing regions and to find the different ways of genetic structuring of FOP isolates, one of the principal infectious agents of passion fruit.
Received October 18, 2011 Accepted October 31, 2012
1Universidade Federal do Recôncavo da Bahia, Campus Universitário de Cruz das Almas – 44380-000 – Cruz das Almas, BA – Brasil.
2Embrapa Mandioca e Fruticultura, C.P. 007 – 44380-000 – Cruz das Almas, BA – Brasil.
*Corresponding author <[email protected]>
Edited by: Antonio Costa de Oliveira
Molecular fingerprinting of
Fusarium oxysporum
f. sp.
passiflorae
isolates using AFLP
Aline dos Santos Silva1, Eder Jorge de Oliveira2*, Fernando Haddad2, Onildo Nunes de Jesus2, Saulo Alves Santos de Oliveira2,
Materials and Methods
Biological material
Fourteen monosporic cultures of FOP from the Embrapa Cassava and Fruits fungus collection were used. The isolates were taken from passion fruit plants displaying typical symptoms of wilt disease and obtained from farms in the states of Bahia and Espirito Santo. After isolation, these were subjected to morphological studies to confirm the identity of the pathogen. In ad-dition to this, one isolate of Fusarium oxysporum f. sp.
cubense W.C. Snyder & H.N. Hansen (FOC) was used as an outgroup (Table 1).
Growth of the fungus in liquid medium, and ex-traction of DNA
To obtain the mycelial mass, the isolates were chopped up and incubated at 25 °C in potato-dextrose (PD) liquid medium (200 g of potatoes peeled and cut into small pieces, cooked in distilled water for 20 min, filtered through a muslin cloth and mixed with 5 g of unhydrated dextrose (Impex). The isolates were shaken continuously for a period depending on each isolate. The mycelial mass of each isolate was filtered and frozen in liquid nitrogen for the extraction of DNA.
The extraction of DNA from the isolates was performed using the CTAB method ((C16H33)N(CH3)3Br, cetyltrimethylammonium bromide hexadecyltrimeth-ylammonium bromide) described by Zolan and Pukilla (1986). DNA quantification was performed using visual comparison to the intensities of fragments of a series of known concentrations of Lambda DNA (Invitrogen), af-ter electrophoresis (3 v cm–1) in 1.0 % agarose gels
con-taining ethidium bromide (1.0 µg mL–1).
Evaluation of primer combinations
A preliminary study was performed with 64
prim-er combinations and two FOP isolates (013 and 071) to identify the more polymorphic combinations for defini-tive analyses with the marker. The best combinations were used for characterization of the 14 FOP isolates and the one FOC isolate (Table 2).
Amplification with AFLP markers
Analyses were performed using the Vos et al. (1995) protocol with minor modifications, using the commercial AFLP® Core Reagent Kit (Invitrogen). Two combinations
of endonucleases were employed. In the digestion reac-tion, 250 ng of genomic DNA were digested using EcoRI and MseI for 2 hours at 37 oC. Reactions were then
incu-bated at 70 °C for 15 min to deactivate the enzymes. For connection of the adapters, fragments of digested DNA were added to 5X buffer of T4 DNA ligase (Invitrogen), 0.1 µM of each enzyme’s adapter (EcoRI and MseI), 1 U of T4 DNA ligase (1 U µL–1, Invitrogen) and 5.0 µL of
ultra-pure sterilized water, and the reactions were incu-bated at 20 °C for 3 h. The mixture was diluted 1:5 in a 1:10 mixture of TE and ultra-pure water.
The pre-amplification was performed in a final volume of 20 µL, consisting of 3.0 µL of the solution containing the digested DNA linked to the adapter, 0.15
Table 1 – Isolates of Fusarium oxysporum f. sp. passiflorae and
Fusarium oxysporum f. sp. cubense, used on the molecular analysis with Amplified Fragment Length Polymorphism (AFLP) markers.
Number Isolate f. sp. Geographic origin 1 FOC143 cubense Janaúba (MG) 2 FOP001 passiflorae Cruz das Almas (BA) 3 FOP002 passiflorae Cruz das Almas (BA) 4 FOP003 passiflorae Cruz das Almas (BA) 5 FOP004 passiflorae Cruz das Almas (BA) 6 FOP005 passiflorae Cruz das Almas (BA) 7 FOP008 passiflorae Ubaíra (BA) 8 FOP013 passiflorae Ubaíra (BA) 9 FOP022 passiflorae Ubaíra (BA) 10 FOP023 passiflorae Ubaíra (BA) 11 FOP028 passiflorae Ubaíra (BA) 12 FOP057 passiflorae Ubaíra (BA) 13 FOP069 passiflorae Linhares (ES) 14 FOP071 passiflorae Porto Seguro (BA)
15 FOP072 passiflorae Livramento de Nossa Senhora (BA)
Table 2 – Characterization of the AFLP primers by the total number of fragments (NB), number of polymorphic fragments (NBP), polymorphic information content (PIC), marker index (MI) and resolving power of the marker (Rp).
Primer combination NB NBP PIC MI Rp
E+CC/M+ATA 29 28 0.19 5.32 7.28
E+CC/M+ATT 28 24 0.17 4.08 5.30
E+CC/M+ATC 22 20 0.18 3.60 4.62
E+CG/M+AAA 55 50 0.24 12.00 16.58
E+CG/M+AAT 54 46 0.18 8.28 10.28
E+CG/M+AAC 40 39 0.21 8.19 10.74
E+CT/M+AAC 39 38 0.18 6.84 8.44
E+CT/M+AAG 43 43 0.25 10.75 15.52
E+CA/M+ATC 50 47 0.15 7.05 8.56
E+CG/M+ATG 26 25 0.17 4.25 5.66
E+CG/M+ATT 42 37 0.16 5.92 9.86
E+CC/M+AAC 38 38 0.21 7.98 11.66
E+CG/M+AAG 39 38 0.18 6.84 8.74
E+CT/M+ATA 30 28 0.28 7.84 12.46
E+CT/M+ATT 45 44 0.21 9.24 11.68
E+CT/M+ATC 32 30 0.16 4.80 6.36
E+CC/M+AAG 53 49 0.18 8.82 12.18
E+CT/M+AAA 61 58 0.21 12.18 15.84
E+CT/M+AAT 49 48 0.17 8.16 9.90
E+CA/M+AAA 51 47 0.23 10.81 14.76
E+CA/M+AAT 54 53 0.24 12.72 17.90
E+CA/M+ATA 34 30 0.20 6.20 8.54
E+AA/M+CTG 36 33 0.15 4.95 5.88
E+AT/M+CTG 43 42 0.21 8.82 11.42
E+AC/M+CTG 57 54 0.23 12.42 16.48
Minimum 22 20 0.15 3.6 4.62
Maximum 61 58 0.28 12.72 17.90
mM dNTPs (Invitrogen), 1X PCR buffer without MgCl2 (Fermentas), 1.5 mM MgCl2 (Invitrogen), 1U of Taq DNA polymerase (Fermentas), 0.5 µM of the primer for the rare-cutting enzyme with a selective base (EcoRI + C or EcoRI + A) and 0.5 µM of the primer for the frequent-cutting enzyme (MseI + A or MseI + C). The PCR program consisted of 95 °C for 2 min, followed by 30 cycles of 94 °C for 30 s, 56 °C for 1 min and 72 °C for 2 min. This was followed by a final extension step for five minutes at 72 °C. The pre-amplified material was diluted 1:60 in a 1:10 mixture of TE and ultra-pure water.
In the selective amplification stage, 2.5 µL of the pre-amplified products were used, with 0.15 µM dNTPs (Invitrogen), 1X PCR buffer (Fermentas), 2 mM MgCl2 (Invitrogen), 8 µg mL–1 BSA (New England Biolabs),
1.5 U of Taq DNA polymerase (Fermentas), 0.5 µM of the primer for the rare-cutting enzyme (EcoRI + CN or EcoRI + CN), where N can be any nucleotide, and 0.5 µM of the primer for the frequent-cutting enzyme (MseI + CNN or MseI + ANN), with a final volume of 20 µL. The amplification program consisted of 95 °C for 2 min, followed by 12 cycles of 94 °C for 30 s, 65 °C for 30 s with a reduction of 0.7 °C per cycle, and 72 °C for 2 min; followed by 24 cycles of 94 °C for 30 s, 56 °C for 30 s and 72 °C for 2 min; with a final incubation at 72 °C for 2 min.
The amplified fragments were separated by elec-trophoresis in a 6% polyacrylamide denaturing gel at 70 W for 3 h. The amplification products were visualized by silver staining according to Creste et al. (2001). The molecular masses of the fragments were determined by comparison with a 50-bp ladder (New England Bio-labs).
Molecular analysis of the data
For each primer pair, the number of polymorphic fragments (NPF), polymorphic information content (PIC), marker index (MI) and primer resolving power (Rp) was calculated. The polymorphic information con-tent (PIC) was calculated using PICi=2fi(1-fi), where i
is the information of marker I, fi is the frequency of the amplified allele (presence of fragments) and (1 – fi) is the frequency of the null alleles (Roldan-Ruiz et al., 2000). The PIC was taken as the average of each primer combination.
The marker index (MI) was calculated by MI = PIC x EMR, where EMR is the “effective multiplex re-lationship” given by the product of the total number of fragments per primer (n) and the fraction of polymor-phic fragments (b) (Varshney et al., 2007). The resolving power (Rp) was calculated using the formula Rp = ∑Ib, where Ib=1-[2x|0.5-p|] and p is the proportion of acces-sions with fragments (Prevost and Wilkison, 1999).
AFLP polymorphic markers were computed as the absence (0) and presence (1) of fragments. The dis-similarities between the genotypes were calculated by the complement of simple matching, using the Genes
program (Cruz, 2006). From the dissimilarity matrix, the dendrogram was generated with the UPGMA meth-od (Unweighted Pair Group Methmeth-od with Arithmetic Mean), using Statistica 7.1 software (Statsoft, 2005). Fusion point criteria were used as cutting point to de-fine clusters (Mingoti, 2005), where a graph with the number of groups versus the distance at each stage (fu-sion) is made, and jumping points indicate the optimal number of clusters. The consistency between the dis-similarities of the clusters and of the matrices was veri-fied using cophenetic correlations with the Genes 1.0 program (Cruz, 2006). The presence of private alleles was determined using the GenAlEx program (Peakall and Smouse, 2006).
Results
Informative content of the AFLP marker
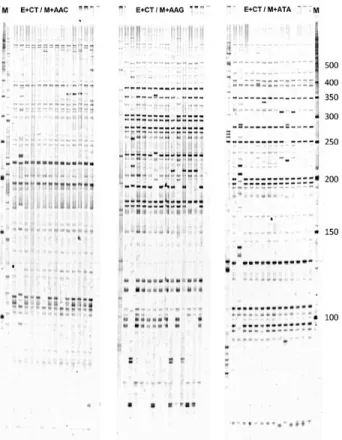
Consistent molecular profiles were obtained for all of the isolates evaluated. The 25 AFLP primer pairs produced 1,050 fragments (ranging from 30 to 916 bp). Of this total, 989 (94.0 %) fragments were poly-morphic (Table 2). On average, each primer pair pro-duced 40 polymorphic fragments. The lowest number of fragments was detected for the EcoRI + CC / MseI + ATC pair and the highest for EcoRI + CT / MseI + AAA, with 20 and 58 fragments, respectively. Figure 1 illustrates three primer combinations that were evalu-ated (E+CT / M+AAC, E+CT / M+AAG and E+CT / M+ATA).
The polymorphic information content for domi-nant markers such as the AFLP ranged from 0 to 0.50 (Roldan-Ruiz et al., 2000). Thus, on average for the prim-ers pairs evaluated, the polymorphic information content (PIC) varied from 0.15 (primers E+CA / M+ATC and E+AA / M+CTG) to 0.28 (primers E+CT / M+ATA), with an average of 0.20, which reflects the informative content of the primers used (Table 2).
The marker index (MI), which incorporates the informative content of the marker (PIC), the number of fragments per primer pair and the fraction of poly-morphic fragments, varied from 3.60 (EcoRI + CC / M + ATC) to 12.72 (EcoRI + CA / MseI + AAT), with an average of 7.92. In the isolates evaluated, Rp varied from 4.62 to 17.90 for the combinations EcoRI + CC / MseI + ATC and EcoRI + CA / MseI+AAT respectively, fol-lowing the same tendency as the MI. This fact is shown by the high correlation between these two indices (r = 0.97, p < 0.01).
Discriminatory capacity of AFLP markers
+ AAA and EcoRI + CT / MseI + AAT, respectively; and a range of 8 to 27 absences (-) for the combinations EcoRI + CC / MseI + ATT/ATC and EcoRI + CA / MseI + ATC, respectively, with an average of 23.0 -/+ per com-with an average of 23.0 -/+ per com-bination (Table 3). Considering presence and absence of unique fragments, 575 differences were observed among the isolates evaluated. Only isolates FOP003, FOP004, FOP022, FOP057 and FOP069 had no unique finger-printing. However, a large number of exclusive FOC fragments were observed, highly differentiated fromthe
passiflorae form.
Among the FOP isolates studied, FOP002 produ-isolates studied, FOP002 produ-002 produ-ced the highest number of differences (137), distributed among 24 combinations of AFLP primers; followed by FOP028, with 25 different fragments (presence/absen-ce) distributed among 17 primer combinations; FOP008, with 12 different fragments (presence/absence) distribu-ted among 11 primer combinations; and FOP005, with 11 different fragments (presence/absence) distributed among eight primer combinations. On the other hand, two unique fragments were found for isolate FOP023 (EcoRI + CG / MseI + AAT - 234 bp and EcoRI + CG /
MseI + ATT - 115 bp) and three combinations (EcoRI + CA / MseI + AAA - 150 bp, EcoRI + CA / MseI + AAT - 626 bp and EcoRI + CA / MseI + ATA – 249 bp) for iso-ATA – 249 bp) for iso-late FOP001. For isoiso-lates FOP013, FOP071 and FOP072, a single specific fragment was generated for the combi-nations EcoRI + CC / MseI + AAG - 215 bp, EcoRI + CT / MseI + AAT - 260 bp and EcoRI + CT / MseI + AAA - 775 bp, respectively. In FOP, the absence of fragments in just one specific isolate was observed in FOP002 with 9 absences (Table 3).
Molecular characterization of the FOP
The genetic dissimilarity varied from 4% to 48%, with an average of 25%. Although the isolates had differ-ent geographical origins, the most similar isolates were FOP004 and FOP022, with only 4% dissimilarity. The cophenetic correlation was 0.95, indicating a high lev-el of accuracy between the original data of the genetic distance matrix and the data represented in the dendro-gram (Figure 2).
Using the cutting point defined by the fusion point criteria (Mingotti, 2005), five groups were formed (Fig-ure 2). Isolate FOC143 remained separate from the oth-ers in Group I, showing broad molecular differences in relation to those of FOP isolates. Group II consisted of isolates from Cruz das Almas (FOP001), Ubaira (FOP013, FOP023 and FOP057) and Linhares (ES) (19°23'27" S, 40°4'17" W) (FOP069).
Group III contained many isolates (FOP003, FOP004, FOP005, FOP008, FOP022, FOP071 and FOP072). The isolates of this group had quite diverse origins, including the municipalities of Cruz das Almas (12º48' 38" S, 39º6'26" W), Ubaira (13°15'7" S, 39°39'15" W), Porto Seguro (16°27'4" S, 39°3'53" W) and Livra-mento de Nossa Senhora (13°38'36" S, 41°50'32" W)", although all are within the state of Bahia. On the other
Figure 2 – Dendogram of the genetic relationships among 15 isolates (14 FOP and one FOC) obtained with the use of the dissimilarity matrix with simple matching coefficient. The grouping method was UPGMA. The vertical bar represents fusion point. Bootstrap values are shown in the branches nodes, and 0.95 of cophenetic value. Figure 1 – Amplification pattern of three AFLP primer combinations.
hand, isolates from this state were also found in two oth-er groups, with FOP028 (Group IV) and FOP002 (Group V) from Ubaira and Cruz das Almas, respectively.
Discussion
AFLP markers have been used to access the genetic variation of intimately related breeds or species, which would be impossible to discover using morphological traits or other molecular mechanisms (Abdel-Satar et al., 2003). In this study, these markers served to analyze the genetic variation of 14 isolates of FOP, representative of different passion fruit–producing fields. In general, the haplotypes generated by the AFLP markers showed high informative capacity and indicated high genetic variabil-ity present in FOP isolates.
For the selection of combinations of more infor-mative markers, the polymorphic information content (PIC), marker index (MI) and resolving power (Rp) have traditionally been used. The Rp takes into consideration the capacity of a given primer combination to discrimi-primer combination to discrimi- to discrimi-nate the genotype. In the isolates evaluated, the Rp var-ied in the same manner as the marker index (MI), which is shown by the high correlation between these two in-dices (r = 0.97 p < 0.01). This reinforces the fact that
Table 3 – Number of unique fragments per FOP (Fusarium oxysporum f. sp. passiflorae) and FOC (Fusarium oxysporum f. sp. cubense) isolates in each AFLP primer combination.
Combination
No. of fragments
absent
No. of fragments
present
FOC1431 FOP001 FOP002 FOP005 FOP008 FOP013 FOP023 FOP028 FOP071 FOP072
E+CC/M+ATA 7 9 -(6) / +(5) -(1) / + (2) +(2)
E+CC/M+ATT 10 8 -(10) / +(6) +(2)
E+CC/M+ATC 6 8 -(6) / +(5) +(3)
E+CG/M+AAA 2 16 -(2) / +(10) +(6)
E+CG/M+AAT 11 19 -(10) / +(9) -(1) / +(6) +(1) +(1) +(1) +(1)
E+CG/M+AAC 6 14 -(5) / +(7) -(1) / +(4) +(2) +(1)
E+CT/M+AAC 12 16 -(12) /+ (9) +(6) +(1)
E+CT/M+AAG 7 13 -(7) / +(6) +(5) +(1) +(1)
E+CA/M+ATC 8 27 -(7) / +(13) -(1) / +(10) +(2) +(1) +(1)
E+CG/M+ATG 4 12 -(4) / +(8) +(4)
E+CG/M+ATT 5 16 -(5) / +(9) +(5) +(1) +(1)
E+CC/M+AAC 9 17 -(9) / +(10) +(6) +(1)
E+CG/M+AAG 9 14 -(9) / +(8) +(5) +(1)
E+CT/M+ATA 2 9 -(2) / +(6) +(1) +(1) +(1)
E+CT/M+ATT 7 15 -(6) / +(9) -(1) / +(5) +(1)
E+CT/M+ATC 8 14 -(8) / +(8) +(3) +(1) +(2)
E+CC/M+AAG 11 22 -(9) / +(11) -(2) / +(6) +(1) +(1) +(3)
E+CT/M+AAA 6 26 -(6) / +(14) +(6) +(2) +(1) +(2) +(1)
E+CT/M+AAT 12 20 -(11) / +(11) -(1) / +(5) +(1) +(2) +(1)
E+CA/M+AAA 6 16 -(6) / +(5) +(1) +(9) +(1)
E+CA/M+AAT 11 16 -(10) / +(5) +(1) -(1) / +(8) +(2)
E+CA/M+ATA 6 16 -(6) / +(7) +(1) +(4) +(1) +(1) +(2)
E+AA/M+CTG 6 19 -(6) / +(11) +(5) +(2) +(1)
E+AT/M+CTG 6 15 -(6) / +(9) +(5) +(1)
E+AC/M+CTG 3 18 -(2) / +(10) +(8)
1+ = presence of fragment and - = absence of fragment, numbers between brackets indicate the number of marks absent or present.
both indices can be used as criteria for selection of the best primers. Thus, adopting the principle of selection on the basis of the average values of the MI (7.92) and Rp (10.66), the primer combinations E+CA/M+AAT,
E+CG/M+AAA, E+AC/M+CTG, E+CT/M+AAA,
E+CT/M+AAG, E+CA/M+AAA, E+CC/M+AAG,
E+CT/M+ATT, E+CC/M+AAC, E+AT/M+CTG and E+CG/M+AAC are the most promising for analysis of variability of the FOP (Table 2).
The highly informative nature of these markers contributes to the observation of polymorphisms be-tween the FOP isolates, as well as contributes to identify specific marks for each isolate. The 395 differences of fragments among the 14 FOP isolates and one FOC iso-late allow the identification of specific fingerprinting for 10 isolates. Of these isolates, FOP002 and FOP028 have particularly high numbers of polymorphic and specific fragments. As a consequence of the higher number of unique fragments; these isolates were grouped separate-ly (Figure 3).
which emphasizes the highly diverse natures of these two pathogens of the same species.
Studies of the diversity among pathogenic isolates of Fusarium have been done using mitochondrial DNA, ITS (Internal Transcribed Spacer) regions, PCR and real-time PCR techniques to determine genetic relationships between formae speciales (Kim et al., 1993; Oliveira and Costa, 2002) and to differentiate them into pathogenic races (Hirano and Airie, 2006; Inami et al., 2010). How-ever, the success in the differentiation of pathogenic iso-lates between different formae speciales has given rise to contradictions, for example, in not distinguishing iso-lates of F. solani that are pathogenic to either soybeans or beans from those that are pathogenic to both crops with the use of the ARDRA technique (Amplified Ribo-somal DNA Restriction Analysis) (Oliveira and Costa, 2002). On the other hand, Werner and Irzykowska (2007) demonstrated the applicability of RAPD in differentiat-ing between pathogenic and non-pathogenic isolates of
F. oxysporum, and Hirano and Arie (2006) used molecu-lar differences in the endo-polygalacturonase (pg1) and exo-polygalacturonase (pgx4) genes of F. oxysporum f. sp.
lycopersici and radicis-lycopersici isolates to design a set
Figure 3 – Distribution of unique fragments (presence) for nine isolates of FOP and one of FOC using AFLP markers. A: graphic of the number of unique fragments in the isolates analyzed. B: fingerprinting of the isolates on the basis of the unique fragments.
of primers able to differentiate between the pathogenic types of F. oxysporum in tomato.
Although the number of FOP isolates is reduced, the 14 analyzed in this study are representative of the principal passion fruit-producing State in Brazil, and therefore, the molecular results demonstrate that the AFLP technique has high potential for the identification of specific marks among the forma specialis passiflorae. The specific fragments could be cloned and transformed into SCAR (Sequence-Characterized Amplified Region) markers, enabling molecular analyses to be conducted more rapidly, as SCAR technique has fewer stages. The use of this information may help in the rapid identifi ca- identifica-tion of FOP, even within this forma specialis.
This is one of the first studies conducted to charac-terize FOP isolates from producing regions with a high rate of infestation of the disease. The results show that there are no differences in the gene pool in relation to geographic locations, as there is no grouping according to these criteria. Thus, the drawing up of a genetic im-provement program for the selection of genotypes resis-tant to wilt disease should focus on the genetic diversity of the pathogen, verifying whether this standard does or does not reflect the aggressiveness and pathogenicity of the FOP isolates.
The isolates from the same geographic origin were found not to have identical fingerprinting. This observa-tion corroborates the work of other authors showing that molecular information does not detect a strong relation-ship between genetic variation and geographic distribu-tion or in the groupings generated (Abdel-Satar et al., 2003).
Group III included half of the isolates analyzed (Figure 2), showing genetic similarities between isolates from quite geographically distant areas in the state of Ba-hia, although significant molecular diversity was found. These considerations can also apply to Group II, includ-ing isolates with even higher genetic divergence, even from different states such as Bahia and Espirito Santo.
The information on the specificity of fragments is directly or indirectly related to the dissimilarity matrix between the FOP isolates, which is also shown by the dendrogram formed (Figure 2). Isolates FOP003, FOP004 and FOP022 had no specific fragments belonging to the same group. Furthermore, isolates FOP004 and FOP022 showed the lowest dissimilarity. Similarly, FOP069 from Linhares (ES), which also showed no specific fingerprint-ing, was allocated to Group II, along with isolates from different geographic areas of the Bahia.
recombinants with diploid nuclei, which quickly and progressively loose individual chromosomes to revert to their haploid state (Agrios, 2005). Earlier research suggested genetic exchanges between and within in-dividual lineages. Fourier et al. (2009), studying the relationships between VCG of FOC, demonstrated re-combination of genetic material within some lineages of this pathogen, which must be due to parasexuality or heterokaryosis between individuals with very similar genomes.
The results found here are relevant to the study of passion fruit-FOP interactions, as the separation of the FOP isolates into different groups will help in screening for sources of resistance to this pathogen. The selection of the genotypes must be performed by inoculation of the plants with isolates from different groups. Thus, the genotypes with resistance to multiple isolates from dif-ferent groups will have a greater chance of having longer-lasting resistance under field conditions. Understanding the diversity of this pathogen adds value to research on resistance to wilt disease, allowing the identification of future races and helping in the identification of sources of genetic resistance that are consistent in the various regions of the country.
Acknowledgments
To CNPq (National Council for Research and De-velopment) and to FAPESB (Foundation for Research Support of the Bahia State), for the financial support. ASS acknowledges CAPES (Coordination for Improve-ment of Higher Education Staff) for her master degree fellowship. E.J.O is fellow CNPq researchers.
References
Abd-Elsalam, K.A.; Omar, M.R.; Migueli, Q.; Nirenberg, H.I. 2004. Genetic characterization of Fusarium oxysporum f. sp. vasinfectum isolates by random amplification of polymorphic DNA (RAPD) and amplified fragment length polymorphism (AFLP). Journal of Plant Diseases and Protection 111: 534– 544.
Abdel-Satar, M.A.; Khalil, M.S.; Mohmed, I.N.; Abd-Elsalam, K.A.; Verreet, J.A. 2003. Molecular phylogeny of Fusarium species by AFLP fingerprint. African Journal of Biotechnology 2: 51–55.
Agrios, G.N. 2005. Plant Pathology. 5 ed. Elsevier Academic Press, Amsterdam, Netherlands.
Baayen, R.P.; O'Donnell, K.; Bonants, P.J.M.; Cigelnik, E.; Kroon, L.P.N.M.; Roebroeck, E.J.A.; Waalwijk, C. 2000. Gene genealogies and AFLP analysis in the Fusarium oxysporum complex identify monophyletic and non-monophyletic formae speciales causing wilt and rot diseases. Phytopathology 90: 891-900.
Belabid, L.; Baum, M.; Forts, Z.; Bouznad, Z.; Eujayl, I. 2004. Pathogenic and genetic characterization of Algerian isolates of Fusarium oxysporum f. sp. lentis by RAPD and AFLP analyses. African Journal of Biotechnology 3: 25-31.
Bogale, M.; Wingfield, B.D.; Wingfield, M.; STeenkamp, E.T. 2006. Characterization of Fusarium oxysporum isolates from Ethiopia using AFLP.: SSR and DNA sequence analyses.Fungal Diversity 23: 51-66.
Creste, S.; Tulmann Neto, A.; Figueira, A. 2001. Detection of single sequence repeat polymorphisms in denaturing polyacrylamide sequencing gels by silver staining. Plant Molecular Biology Reporter 19: 299-306.
Cruz, C.D. 2006. Programa Genes (Versão Windows): Aplicativo Computacional em Genética e Estatística = Genes (Windows version): Software for Experimental Statistics in Genetics. Editora UFV, Viçosa, MG, Brazil.
Fourier, G.; Steenkamp, E.T.; Gordon, T.R.; Viljoen, A. 2009. Evolutionary relationships among the Fusarium oxysporum f. sp. cubense vegetative compatibility groups. Applied and Environmental Microbiology 75: 4770-4781.
Groenewald, S.; Berga, N.V.D.; Marasasb, W.F.O.; Viljoen, A. 2006. The application of high-throughput AFLP’s in assessing genetic diversity in Fusarium oxysporum f. sp. cubense. Mycological Research 110: 297-305.
Hirano, Y.; Arie, T. 2006. PCR-based differentiation of Fusarium oxysporum f. sp. lycopersici and radicis-lycopersici and races of F. oxysporum f. sp. lycopersici. Journal of General Plant Pathology 72: 273–283.
Inami, K.; Yoshioka, C.; Hirano, Y.; Kawabe, M.; Tsushima, S.; Teraoka, T.; Arie, T. 2010. Real-time PCR for differential determination of the tomato wilt fungus.; Fusarium oxysporum f. sp. lycopersici. and its races. Journal of General Plant Pathology 76: 116–121.
Kim, D.H.; Martyn, R.D.; Magill, C.W. 1993. Mitochondrial DNA (mtDNA) - Relatedness among formae speciales of Fusarium oxysporum in the Cucurbitaceae. Phythopathology 83: 91-97.
Kistler, H. 1997. Genetic diversity in the plant-pathogenic fungus Fusarium oxysporum. Phytopathology 87: 474-479.
Kistler, H.C. 2001. Evolution in host specificity in Fusarium oxysporum. In: Summerell, B.A.; Leslie, J.F.; Backhouse, D.; Bryden, W.L.; Burgess, L.W., eds. Fusarium: APS Press, St. Paul.; MN, USA.
Klister, C.H.; Miao, V.P.W. 1992. New modes of genetics change in filamentous fungi. Annual Review of Phytopathology 30: 131-152.
Leslie, J.F. 1993. Fungal vegetative compatibility. Annual Review of Phytopathology 31: 127–151.
McKnight, T. 1951. A wilt disease of the passion vines (Passiflora edulis) caused by a species of Fusarium. The Queensland Journal of Agricultural Science 8:1-4.
Mingoti, A.S. 2005. Análise de Dados Através de Métodos de Estatística Multivariada: uma abordagem aplicada = Data analysis using multivariate statistics methods: an applied approach. Editora UFMG, Belo Horizonte, MG, Brazil. O'Donnell, K. 2000. Molecular phylogeny of the Nectria
haematococca-Fusarium solani species complex. Mycologia 92: 919-938.
Peakall, R.; Smouse, P.E. 2006. GenAlEx 6: genetic analysis in Excel. Population genetic software for teaching and research. Molecular Ecology Notes 6: 288–295.
Prevost, A.; Wilkinson, M. J. 1999. A new system of comparing PCR primers applied to ISSR fingerprinting of potato cultivars.
Theoretical and Applied Genetics 98: 107–112.
Roldan-Ruiz, I.; Dendauw, J.E.; Van bockstaele, E.; Depicker, A.; Loose, M. 2000. AFLP markers reveal high polymorphic rates in ryegrasses (Lolium spp.).Molecular Breeding 6: 125-126. Statsoft. 2005. Statistica for Windows (Data Analysis Software
System): Version 7.1. Statsoft. Tulsa.; OK, USA.
Stewart, J.E.; Kim, M.; James, R.L.; Dumroese, R.K.; Klopfenstein, N.B. 2006. Molecular characterization of Fusarium oxysporum and Fusarium commune isolates from a conifer nursery. Phythopathology 96: 1124-1133.
Varshney, R.K.; Chabane, K.; Hendre, P.S.; Aggarwal, R.K.; Graner, A. 2007. Comparative assessment of SSR.; EST-SNP and AFLP markers for evaluation of genetic diversity and conservation of genetic resources using wild. cultivated and elite barleys. Plant Science 173: 638–649.
Vos, P.; Hogers, R.; Bleeker, M.; Reijans, M.; Lee, T.; Hornes, M.; Fritjers, A.; Pot, J.; Peleman, J.; Kuiper, M.; Zabeau, M. 1995. AFLP: a new technique for DNA fingerprinting. Nucleic Acids Research 23: 4407-4414.
Werner, M.; Irzykowska, L. 2007. The pathogenicity and DNA polymorphism of Fusarium oxysporum originating from Dianthus caryophyllus, Gypsophila spp. and soil. Phytopathologia Polonica 46: 25–36
Zeller, K.A.; Summerell, B.A.; Bullock. S.; Leslie. J.F. 2003. Gibberella konza (Fusarium konzum) sp. nov. from prairie grasses, a new species in the Gibberella fujikuroi species complex. Mycologia 95: 943-954.