P
REDICTION
OF POOR INFmT GROWTH’
Francisco Mardones-Restat and GZorh Jones2
I
NTRODUC’IlON
There have been sustained and spectacular reductions of low birth weight, malnutrition, and infant mortal- ity in Chile in recent times (1, 2). How- ever, deterioration of the National Sup- plementary Food Program in 1983, as a result of the world recession (3, 4), has made it evident that this trend could change. This danger, which has also been observed in developed countries such as the United States (3, 6), justifies adopt- ing techniques that will make it possible to pinpoint the groups most exposed to malnutrition, disease, and death.
Epidemiology has provided us with new techniques for predicting harm, and both the World Health Orga- nization (WHO-~) and its Regional Of- fice for the Americas, PAHO/ WHO (8-
12), have spearheaded utilization of the risk approach in health programs. The Inter-American Institute of the Child, in cooperation with the Latin American Center for Perinatology, has offered nu- merous courses on this subject (13). In addition, the available medical literature includes a large number of studies and
l The study reported here was begun iu 1982 under an agreement between the Ministry of Health (Conscjo p-kale AIimentaciQn y Nutciddnj and the IJ&ersity bf Chile ktituto de Nutrieibn v Tecnoletia de lss Ali- mento;). Various phases of it w& financ<d by the Uni- veaity of Chile Libra&s and Research Unit (am), the World Health Organization (WHO), and the Baaed on Science and Technology foer Development @osno)/
articles directed at identifying risk factors whose presence in individuals or groups/ provid& grounds for taking prevent&e measures. WHO has published an anno- tated bibliography on this subject (14), and use of the technique has recently been extended to a variety of fields
(15, 16).
In 1982 the Chilean Health Ministry included in its rules and stan- dards for care of infants and adolescents (17) a list of risk factors and appropriate measures designed to ensure preferential care for the children or families con- cerned. The risk factors selected have demonstrated their value in the interna- tional literature. However, certain Chil- ean studies have shown that the neces- sary data are not always recorded in patients’ clinical histories, and that the mere fact of recording them does not au- tomatically trigger specific corrective actions (18). Other Chilean authors have not found differences in the rates of mal- nutrition, disease, and death between groups with and without the risk factors cited (19).
U.S. National Academy ofSciences/LJSAID. Thk tuti- cle will also be published in Spaoish ln the Bal& Be la
Ojcina Sunitmi3 Pananzeticana vol. lC4, 1988,
These observations justify re- ducing the number of risk factots to those that will ensure maximum predic- tive value. They also justify assigning each risk factor a weight based on the strength of its association with the spe- cific dependent variable (either malnu- trition or certain morbidity or mortality deriving therefrom-20, 21), recogniz- ing the possible synergism of these fac- tors when they are combined in certain groups, and evaluating the time factor in terms of how long a particular variable needs to be present to produce its effect. (Regarding this last point, one must ac- cept that the predictive value of the risk factors in foreseeing a particular undesir- able outcome changes with the length of time that the corresponding data are re- corded. It should also be noted that the failure to detect significant differences between the two above-mentioned groups could simply mean that the pres- ence of the risk factors in one group prompted sufficient differentiated care to reduce the risk factors’ impact.)
Taking account of these vari- ous considerations, an instrument was developed for predicting deterioration of infant growth using two sets of indica- tots. One set, termed “biomedical risk” indicators, related to susceptibilities of the infant. These indicators included birth weight, age, the number of the mother’s children, maternal of newborn
s pathology, etc. The other set, termed
m
1 “family incompetence” indicators, in-
3 volved exposure to adverse conditions.
r; These indicators included parental occu-
$j pations, maternal education, housing
p1
* a quality and sanitation, degree of health
2
service use, etc. (22-29)).
“Biomedical risk” scales and “family incompetence” scales were de-
342
vised and found capable of distinguish- ing groups facing varying levels of mal- nutrition risk (Figure 1). This was done by applying the “simple relative risk” method proposed by WHO (7, 8) and also a logistic regression model (30-32) that successfully weeded out indicators with less predictive value from among a number of mutually dependent indi- caters .
It should be noted that for more than half a century Chile’s health policies have been focusing special at- tention on maternal and child health problems, and have been assigning high priority to the nutritional status of vul- nerable populations. In this same vein, Chile’s Food and Nutrition Council (33- 36) has designed specific measutes to stimulate milk production in the country and to finance the distribution of milk to those insured by the social security system. 3
Following establishment of the National Health Services in 1952, these programs were expanded with ad- ditional funding derived from Social Se- curity contributions and the Worker’s Family Allowance (2).
Since 1975, the Chilean Health Ministry has been publishing the nutrition status (age : weight ratio) of children below age six who are under Na- tional Health Service supervision (37, 38). But this universal procedure only makes it possible to tell when a child ceases to grow at the expected rate, and so only serves as a signal for starting or reinforcing preventive measures of a sec- ondary nature-those taken after harm has already become evident.
FIGURE 1. Estimated probabiliis of inadequate weight gains among infants, based on their “biomedical risk” and Vamily inmmpatence” smras. (A) shows pmbabiii far the O-90 day period and (8) shows pmbabililfes for the 90-360 day period. (N = 876 infants in both cases.)
According to current health ministry standards, a nursing child (un- der two years old) is classified as being at risk of biomedical malnutrition when its weight gain at two consecutive checkups is less than 75% of what it should be (600 g per month in the fist year) (2 7).
Also, anthropometric evaluation accord- ing to the reference pattern selected (32) has lost sensitivity because of changes in anthropometric patterns. Thus, in 1975
15.4% of the Chilean infant population under observation was below one stan- dard deviation from the Sempe average, while in 1984 the figure was 8.4%. This indicates that the Chilean child popu- lation is above the Sempe average by
almost three-quarters of a standard de- viation. These two situations justify adoption of a reference standard stricter than Sempe and also efforts to identify children likely to deviate from the nor- mal growth trend in the future, using a prediction instrument that selects vari- ables associated with this likelihood,
WI-ICI has proposed universal
out over more than a decade (40, 41). A large number of countries, including Chile, participated in that study. The work reported here makes use of this lat- ter standard, converting it to a unisex ba- sis in accordance with a proposal by one of the authors (EM-R.) (see Figure 2). Reports submitted to the Ministry of Health by Habicht (42) and Horwitz (43, 44) concerning the Food and Nutrition Council and development of a food and nutrition surveillance system have con- sidered this modified standard very useful.
M
ATERIALS
AND
METHODS
Data were gathered on a co- hort of children born in January 1982 at five Santiago maternity hospitals4 and follow-up work was performed at 11 of the city’s district clinics,> all of which provided helpful collaboration in devel- oping the investigation. The population studied, which was representative of the clientele of the National Health Services, included families protected by the Social Security System as well as indigent fami- lies that received the benefits of an inte- gral health program free of charge. (Care given under this program was provided by a multiprofessional health team and consisted of immunizations, provision of food from the prenatal period throughs ’ El Salvador, Barros Luco, San Jose. San Juan de Dies, .$ and S6tero de1 Rio.
9, 3
( Dr. Albertz, Independencia, Julio AcuAa, La Bandera, cq La Faena, Lucas Sierra, Pefialolin, Repliblica de1 Uru- guay. Rosita Rcnard. Salvador Bustos. and Santa Julia.
344
six years of age, in-hospital delivery ser- vices, and hospitalization as needed.) The cohort of all children born in Janu- ary 1982 numbered 1,15 1. Of these, 876 were followed until they reached one year of age. The remaining 275 were suc- cessfully monitored only through the ninety-day checkup, mainly because their families tended to move around a lot. (Many of these frequently moving families belonged to certain subgroups of families whose children were especially apt to have development problems.)
Prenatal information about
the cohort members was obtained retro- spectively from the children’s clinical his- tories. All the information was entered on preceded forms, using data normally gathered in the health establishments, and professional visits were made to the children’s families-especially to deter- mine the mother’s acceptance of the pregnancy, her interest in the child after its birth, and the family’s current socio- economic status.
FIGURE 2. A unisex version of the WHO growth chark (1978), as modified by one of the authors (EM-R.).
NAME OF CHILC CAP.0 ho NAME OF MOTHER CARD t<O
ANTHROPOMETRIC EVALUATIOF. OF INFANT (BOTH SEXES)
IMMUNIZATIONS E 2 1 br
lI_LLIlIII-I
32 36 40 MONTHS WHO Reference Growlh Charls (1978) meddled by F Mafdones-Resfal Estabhshmenr
w
2 PAHO Bdietin 21(4), 1987
TABLE 1. Risk factors selected for use in seeking to find infants at high risk of inadequate weight gains by the simple relative risk method. The figures shown are derived from histories and interview data and from weighings of children in the cohort studied during two periods-newborn to 90 days and 90 to 360 days.
Risk factors High risk/low risk
Development, O-90 days Development, 90-360 days
% %
Relative 95% population Relative 95% population risk confidence with risk confidence with
(RR) interval factor Ch? Score (RR) interval factor Chi* Score
Family data:
Father’s occupationa Parental alcoholism
Connections (nonpaying relatives
O-4, 17/5-16 1.81 1.5/2.2 42.0 39.95 6 1.30 l.lI1.5 42.7 8.40 3 Yes/no 1.36 1.0/l .9 13.8 3.32 3 1.04 0.8/l .4 13.8 0.05 1
or friends) residing in the home Yes/no No. of persons in household 2, rU3or4 No. of persons per bed r3/1 or 2 No. of persons per bedroom 2511-4
Bedroom floor Earthen/other
Fuel for cooking Other/gas
Potable water Other/in the home Excreta disposal
Type of housing Inadequate/adequate Inadequate/adequate
1.35 1.1/1.7 52.2 8.44 3
1.34 1.171.6 28.9 8.3 3 1.28 1.41 1.1/1.8 22.0 9.19 3 1.29 1.41 1.612.6 12.2 10.6 3 1.69 2.14 1.712.7 14.6 45.5 8 1.68 2.24 1.8/2.8 10.7 43.9 8 1.6 1.55 1.311.9 33.4 18.5 4 1.4 1.52 1.2/1.9 31.4 16.7 4 1.4 1.82 1.5/2.3 43.3 31.07 6 1.43
Data on mother: Age (years) Civil status Years of education Employeda
Age (years) at first pregnancy Outcome of last pregnancy Week of first prenatal visit Weight (kg) at first prenatal visit Week of last prenatal visit Weight (kg) at last prenatal visit Weight increase (g/wk) No. of prenatal visits Pathology of pregnancya lntrapartum pathologya Puerperal pathologya Height (meters) Interested in child Weight (kg) at puerperium
Data on newborn: Birth order Sex
Gestationalage (weeks) Birth weight (g) Pathologies?
<19, >35/19-35 1.26 Unmarried/married 1.50
O-6/r7 1.7
No/yes 1.89
~17 and >30/17-30 1.64 Stillbirth/live birth 1.43
rl7/<17
<55Jr55 1.34 <39Jr39 2.27 <65Js65 1.99 <200, >700/200-700 1.75 O-5 and r13/6-12 1.46 1,4,7,11,13,15/ethers and 0 1.74 2,8,14Jothers and 0 1.60 7,8/ethers and 0 1.51 <1.52/>1.52 1.43
No/yes 3.28
<55Jz55 1.34
z-5/1-4 F/M <39/239 <2,901/r2,901 BycodesJnone K4 4.3 2.15 1.87
1.0/i .6 1.2/1.9 1.4J2.0 1.3J2.6 1.112.4 0.712.9 18.1 21.1 33.5 85.4
1.1/1.6 30.9 1.7J2.7 53.7 1.612.6 48.9 1.312.4 21.0 1.2/1.8 30.0 1.4J2.1 40.8 1.2/1.9 23.9 0.6J2.0 2.5 l.lJ1.8 34.2 2.3/4.7 3.2 0.9/2.1 33.6
1.2J2.2 9.2
1.611.5 52.7 3.5J5.2 30.0 1.712.6 29.0 1.5J2.3 21.7
3.6 2 13.15 4 24.9 5 10.20 6 7.3 5 1.01 4
13.90 42.9 37.31 19.52 13.16 28.97 13.42 0.08 10.2 42.8 1.64 3 8 i 4 6 4 1 1: 3 8.7 4.2 214.1 53.6 33.71 1.0 1.2 1.35 1.71 1.10 1.08 1.37 1.19 1.54 1.39 1.14
1.11 0.9J1.4 17.5 0.85 1
1.29 1 eOJ2.2 2.7 0.22 3 1.40 1.211.7 34.8 13.48 3 2.23 1.5/3.2 3.7 17.9 8 1.25 i.OJ1.8 33.9 3.73 3
1.44 1.1/1.9 0.2 6.3 4 1.54 1.411.9 52.9 30.1 5 1.57 1.311.9 24.9 23.7 5 2.04 1.7/2.4 29.1 70.9 7 1.11 0.9/l .4 21.6 1.0 1
0.9/1.4 18.1 1.73 1.011.4 20.8 2.51 l.lJl.6 33.4 11.9 1.3J2.3 86.4 11.81 0.9/l-4 17.4 1.10 0.6J1.9 3.8 1.08 1.211.6 65.5 12.34 l.OJ1.4 39.4 3.59 1.311.8 42.9 21.76 1.2/l-7 48.9 13.15 0.9J1.4 27.9 1.79
a By codes.
I
classified as having inadequate devel- opment .
In this way a more dynamic evaluation of the growth process was achieved. The 90% weight limit corre- sponds to the level of the eighteenth to twentieth percentile of infants used to es- tablish the reference standard (in Figure
2 this limit is the lower limit of “d”). The joint evaluation of biomedical fac- tors and those of an economic, social, and cultural nature with respect to the dependent weight variable, as reported in various publications (22, 45-4i’), pro- vides guidance for the appropriate selec- tion of interventions that can be used to strengthen primary prevention.
The data obtained in the study reported here were processed on the INTA2 terminal of the computer be-
longing to the University of Chile’s Ser- vice for Computational and Information Systems (SECI). The packages used were the SPSS (statistical package for the social
sciences) and SAS (statistical analysis sys- tem), preferentially employing a “logis- tic regression” procedure that permits construction of models wherein variables are selected according to their degree of independence, thereby optimizing pre- dictability.
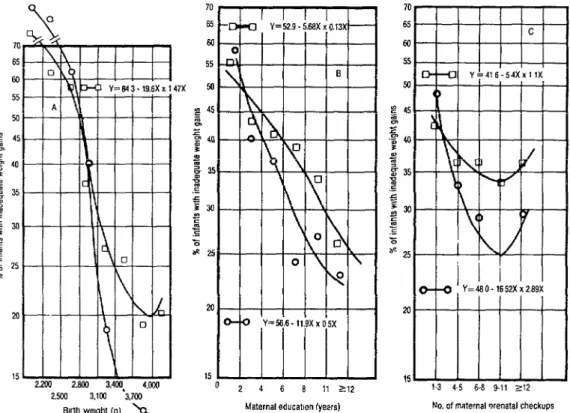
FIGURE 3. Charts showing the distribution of the whole study cohort and cohort members with inadequate weight gains in terms of (A) birth weighl (in grams), (G) maternal education (in years), and (C) maternal prenatal checkups. (O-O = whole cohort; 0-O = cohort members with inadequate weight gains.)
-=2001 2301.2600 2901.32ul 3501-3800 2.Lxw2 xa 2 em-7 w 3 Ml-35M z3.801
Etr(h weight (g) 25 r
Maternal educatmn (years)
Analysis of the data gathered from the Santiago cohort made it possi- ble to devise simple instruments for pre- dicting unfavorable growth-both in the
0 to 90 day period and the 90 to 360 day l-3 45 No of maternal prenatal checkups 6-7 6 9 10 11 32
x period. This analysis was performed as
2
follows:
3
The “simple relative risk” method proposed by WHO was used first (7, 8). All the risk factors that were
clearly and accurately recorded for over
placed at least 5% of the study popula- tion at risk, were selected (see Table 1). Since this method requires “dichoto- mized” variables (each risk factor is deemed either present or absent), selec- tion of the cutoff point for variables such as birth weight that have a continuous range of values provided grounds for concern.
Figure 3 illustrates the prob- lem. Figure 3A charts the entire study population and the children with inade- quate weight gains, showing the percent- ages in different birth weight ranges. Figure 3B does the same but substitutes years of maternal education for the birth weight variable; and Figure 3C does the same but substitutes the number of pre- natal checkups. As the Figure 3A data clearly show, selecting a birth weight risk factor cutoff point of 2,900 g creates two subgroups confronting appreciably dif- ferent risks of inadequate weight gain: it also leaves nearly 30% of the study sub- jects in the high-risk group, a proportion close to that with inadequate weight gain. Similarly, selecting a cutoff point for maternal education of 7-8 years (see Figure 3B) creates rwo groups facing no- tably different risks of inadequate weight gain while leaving a large percentage of subjects in the high-risk group. And, as the Figure SC data show, lumping those whose mothers had O-5 and over 12 pre- . natal checkups into a single high-risk cat- egory creates two groups having mark- edly different risks of inadequate weight gain and places nearly 30% of the sub- jects in the high-risk group.
One risk factor that affected only 3.5 %I of the mothers surveyed in the hospital had the highest predictive value; that is, its presence was associated
with the highest probability of failure to attain normal growth. This indicator, designated “lack of maternal interest in the child,” was observed and recorded by the sociologist or social worker during the interview, at which the newborn was al- ways present. When the mother ex- pressed a desire to get rid of the child, this was taken to indicate “extreme lack of interest.” (Mothers who spoke this way were generally single women without family support who were therefore un- able to care for their children.) Also, some children were placed in this cate- gory because they were abandoned at the hospital. In other cases, lack of interest was discerned from observation of the mother’s behavior-such as rough han- dling of the newborn; inability to corn- fort it; and (particularly) insensitivity to crying, at times accompanied by refusal
to nurse the child. z t!3
In general, it is felt that the mere presence of this risk factor alone justifies immediate interventions to edu- cate the mother (behavior modification) in conjunction with efforts to interest the family in caring for the child. This means efforts to interest the couple involved if 3 the man has not abandoned the mother,
or else (especially) efforts to interest the t5 grandmother. In this regard, it has been E found that care by the grandmother will
significantly improve the probability of
$
normal growth. 2 .
‘Igble 1 lists the risk factors ex- 2
amined that met the foregoing require- s
ments and also had a lower confidence 2
interval corresponding to a relative risk s that was equal to or greater than one. 3 This table also shows the cutoff points for
each factor, the relative risk (RR) in-
,$ ’ 2
valved, the extreme values of the 95% B
confidence interval in accordance with -2
the formula 95 % confidence interval = s RR11 + l.~6’Jchi21 (47), the percentage of the study population with each risk factor,
to the risk. The latter score was calculated for each factor by multiplying the natural logarithm of the relative risk (RR) ties
10 and rounding to the nearest whole number (8).
The prediction instrument
derived by the simple relative risk method is simply the total of all the scores corresponding to the risk factors present in each child, these being used to establish scales of (1) biomedical risk and (2) family incompetence. This latter des- ignation is intended to emphasize the role of the family as the first, principal, and permanent provider of care for each child (48). It also encourages recognition of the need to have the health team en- sure that parents receive proper guidance and training, and that effective means of
communication are used to attain ade- quate health standards.
The prediction instrument
derived by the logistic regression proce- dure involves applying this regression to the relevant data (32). Like discrimina- tion analysis, logistic regression makes it possible to select those indicators that have the greatest predictive value or asso- ciation with the dependent variable from among a larger set of indicators (24, 2J). For our purposes it is preferred over dis- crimination analysis, which requires a normal curve of values, because many of the biological and social factors studied do not produce values following such a curve.
Table 2 lists the variables se- lected by the logistic regression method for the two age ranges studied (0 to 90 days and 90 to 360 days). It also shows the values of the logistic regression coef-
TABLE 2. Independent variables selected for use in seeking to find infants at high risk of inadequate weight gains by the logistic regression method. Beta is the natural logarithm of the relative risk, SE is the standard error, and p is the level of significance of the logistic regression.
Values for variables measured at:
O-90 days (N=789) 90-360 days (N=786)
Variables Beta SE Chi2 P Beta SE Chi* p
Family data:
Father's occupation 0.6654 0.2379 7.82 0.0052 - - - - No. ofpersonsin householda 0.4116 0.1703 5.84 0.0157 - - - - Bedroom floor quality 1.5145 0.3456 19.19 0.0000 0.5949 0.2460 5.85 0.0156 Fuel for cooking 1.1622 0.3830 9.20 0.0024 - - - - Data on mother:
Civil status 0.7293 0.2973 6.02 0.0142 - - - - Years of education - - - 0.0433 0.0284 2.32 0.1277 Employed 0.8437 0.3622 5.42 0.0199 0.4392 0.2602 2.85 0.0914 No. of prenatal visits? 0.0185 0.0482 4.80 0.0284 0.0592 0.0347 2.91 0.0878 lntrapartum pathology 0.6062 0.2643 5.26 0.0218 - - - -
Data on newborn:
Birth order - - - - 0.1731 0.0665 6.83 0.0090
Birth weight 0.0042 0.003 122.50 0.0000 0.0009 0.0002 16.16 0.0001
Data at three months:
Height - - - - 0.1318 0.0277 22.51 0.0000
ficients corresponding to each selected variable. In this regard, it should be noted that Beta represents the natural logarithm of the relative risk (RR); SE is the standard error of the preceding value; and p is the level of significance of the logistic regression. Each instrument derived in this manner could also include one or two additional indicators which, while they may not add much to the total predictability index, can serve to remind the health team of the importance of
certain prevention programs-such as
those encouraging breast-feeding-and thereby help to improve local acceptance of such programs.
For both age ranges (O-90 days and 90-360 days) the overall value of p is less than 0.0001; the probability of predicting concordant pairs is 89.7 % for the first period and 75.7 % for the second.
The prediction instrument shown for the first period includes nine selected indicators, seven of which can be obtained in the clinic during prenatal visits, to which should be added the scores for birth weight and newborn pa- thology. The prediction instrument for the second period (90460 days) includes fewer indicators.
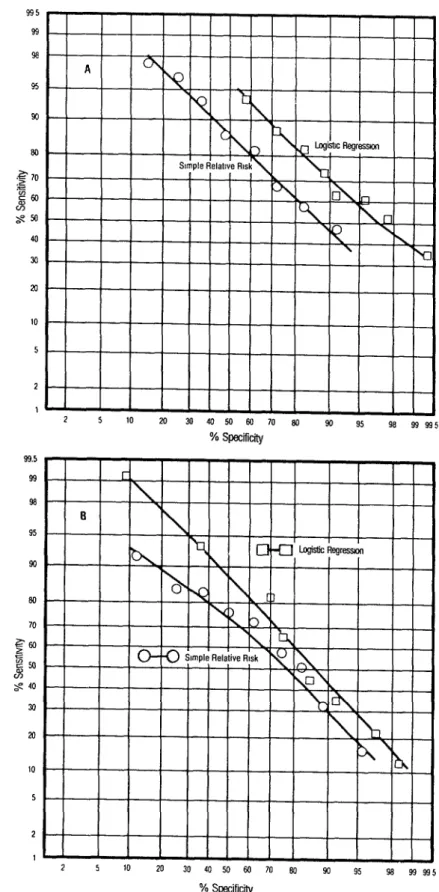
Figure 4 indicates the sensitiv- ity and specificity relationships found by the simple relative risk and logistic re- gression methods for both periods of de- velopment studied. These results clearly indicate that the logistic regression method provides a better basis for pre- diction, despite the fact that the simple relative risk method uses many more in- dicators, because the former attains a higher degree of sensitivity at any given level of specificity and a higher degree of specificity at any given level of sensitivity. It is also interesting to observe the behavior of certain continuous vari- ables such as birth weight (Figure SA), maternal education (Figure SB), and
prenatal consultations (Figure 5C). Each of these graphs charts the variable in question against the percentage of the study cohort failing to show an adequate weight gain during each of the two de- velopment periods covered. For each age range, a line representing the association between the variable and inadequate weight gain was calculated by means of a quadratic regression. It is noteworthy that the logistic regression method can use the data provided on these continu- ous variables directly, while the simple relative risk method requires that the data be used to indicate merely whether the risk factor in question was present or absent.
D
ISCUSSIONThe results presented here show that the instruments devised were able to perform the required function successfully while remaining simple and easy to use. Evaluation of their accept- ability by local health personnel-and of the time needed to apply them-has be- gun. It should be noted, of course, that our work has only shown these instru- ments to provide reliable results for cli- ents of the National Health Service in Santiago. This is a population that re- ceives a package of health services (im-
munizations, health team checkups,
995 99 se 95 93 w) .?a 70 :S E60 w S%
40 30 al 10
5 2 1 99.5 99 98 95 90 80 70 S-M) pl $ 40
30 a 10
5 2 1
L 5
^ _ 10 --
93 95
2” 30 40 50 M) 70 eQ 90 93 995
FIGURE 4. Sensitivii and specificity of the simple relative risk (O-O) and logistic regression (O-0) methods for detecting in- adequate weight gain, as applied to 876 members of the study cohort. The data shown are for inadequate weight gains over the two periods covered, these be- ing (A) O-90 days and (6) 90-360 days.
FIGURE 5. Charts showing rates of inadequate weighf gain among 876 members of the study cohort over O-90 days (O-O) and 90-360 days (0-O) relative to three contfnuous variables, these being (A) birth weight in grams, (B) maternal education in years, and (C) the number of maternal prenatal checkups.
47x 70 F m- w- 55 - so- 45- 40 - 35- xi- 25 - M- 15 -
0 Erlh wght (g)
2 4 6 8 11 212 Maternaleducatm lyem)
These growth prediction in- struments thus need to be validated for heterogeneous populations, a process that will require monitoring cohorts of children similar to the one studied. The same biomedical risk and family incom- petence indicators will need to be re- corded for these children, together with any other indicators having a significant bearing on inadequate growth that may be identified by ad hoc socioanthropo- logic studies.
This validation process needs to be applied in parts of the country where health indicators (based on
h’o.ofmaternal prenatal checkups
Health Ministry data-17) and living standards exhibit substantial differences. Regions selected for this purpose include regions II (Antofagasta), V (Valparaiso), VII (Talca), VIII (Los Angeles and Chi- l&n), and IX (Temuco).
ment than the other 876, and were also differentiated from the others by several variables-including birth weight, gesta- tional age, and the mother’s civil status. However, as Figure 6 shows, a satisfactory degree of prediction was attained by ap- plying the logistic regression model for the 876 children to the 275, and also by applying a model developed especially for the 275. This can be accounted for by the similar associations existing between the dependent variable and the risk fac- tors employed in both cases-as indi- cated by the very similar relationships
found between sensitivity and specificity in these cases.
If these associations are gener- ally similar, it should prove possible to devise a single prediction instrument valid for the entire country, and for both
of the development periods studied, by making certain adjustments to the model developed in Santiago. Of course, some loss of predictive ability would be as- sumed in making broad application of
FIGURE 6. Sensitiiiiy and specificity of the logistic regression method-as indicated by applying the model developed for the 876 cohort members followed 360 days to those 876 infants for the O-90 day period (X-X); by applyhlg this model to 275 cohort members who were followed only 90 days for this O-90 day period (0 -0); and by applying the model developed for these 275 cohort members to those same members for the same O-90 day period (O-U).
2 5 10 20 30 40 50 w 70 80 w Y:, w)a*5
such an instrument; and if this loss proved significant, it would then be pref- erable to develop two or three predic- tive models applicable to segments of the population with different living standards.
A
CKNOWLEDGMENTS
The authors wish to express their gratitude to the following persons and institutions for assistance with this
study: Abraham Horwitt, Director
Emeritus of PAHO / WHO; Jean-Pierre Ha- bicht, Cornell University, USA; Nor- berto Dachs, University of Campinas, Brazil; Jose Villar, Johns Hopkins Uni- versity, USA; German Rodriguez Galant, Catholic University of Chile; Fernando Monckeberg (Director), Erica Taucher, Mirtha Diaz, Rosa Avendaiio, and Mar- cela Palma, Institute of Nutrition and Food Technology, University of Chile; August0 Schuster (Assistant Secretary), Sergio Gonzalez, Fernando Symon, Eduardo Parker, Albert0 Vigneau, Ar- turo Leon, Cecilia Vargas, Mabel An- dino, and Hector Sanchez, Ministry of Health, Chile; Nicolas Gonzalez, Food and Nutrition Council, Chile; Dr. Enri- que Aboya, Argentine Fellow of the United Nations University; the National Statistics Institute, Chile; and the Direc- torate of Civil Registry, Chile.
S
UMMARY
The investigation reported here sought to develop a statistical in- strument capable of identifying infants at high risk of failing to achieve adequate growth. Accordingly, factors associated with inadequate weight gains were stud- ied in a cohort of 1,15 1 infants born dur- ing January 1982 at five National Health
Service maternity hospitals in Santiago, Chile. Data were obtained from the chil- dren’s medical histories, visits to their
families, and follow-up assessments.
Most of the children (876) were followed for a year, the remaining 275 being fol- lowed for 90 days.
Each study infant was
weighed at least three times during the first 90 days following delivery and (if possible) at least three times during 90 to 360 days. All the infants who were below 90% of the standard weight for age at the last of the three weighings in a set, or at two out of the three, or at all three were classified as having inadequate de- velopment.
To devise instruments capable of predicting inadequate development, a
series of risk factors were examined. The E
ones selected had to be clearly and accu- h rately recorded for over 90% of the co- ti hort infants and had to affect at least 5 % of the study group. In this way 35 risk 2
factors were selected. s
Prediction instruments were then developed using two methods, the
z
“simple relative risk” method and the 8
“logistic regression” method. The sim- 8
ple relative risk method was applied by assigning each risk factor a score based on
$ % relative risk, determining which factors 3
were present or absent in each case, and 5
adding up the scores. The logistic regres-
sion method was applied by determining 2
which factors appeared to have the great- .
est predictive value and using them to 2
make the determination. 2 B
The results of these applica- B
tions indicated that both instruments B
were able to perform the required func- 2
tion while remaining simple and easy +
to use. Evaluation of their acceptability tz 2
by local health personnel is now in 3
progress. 2
RE
FERENCES
1 Mardones-Restat, F. Evoluci6n de1 eso al na- cer en Chile (1977-1984). Rev C d Pea’zatr %, 56(4):27. 1985 and 57(1):900, 1986.
2 Mardones-Restat, E Beneficios de la Seguridad Social en el cuidado de la nutrici6n y salud de la madre y el n&o en Chile. Rev Chil Nzltr 12(1):23-27, 1984.
3 Mardones-Restat, F. Cobertura de1 PNAC y tasa
de desnutricibn en Chile (1982-83). Rev 0% Nutr 12(1):54-55, 1985.
4 Atalah, E., R. Puentes, C. Castillo, and M. E. Rodrigan. Programa de alimentacibn comple- mentaria en Chile 1965-1985. Rev C/d Pe- diatr 56(5):362-368, 1985.
5 Miller, C. A. Infant mortality in the U.S. Sci- e&j% American 53:32-38, 1985.
6 Fineberg, H., et al. Infant Mortality and So- cioeconomic Conditions. Health Sciences Re- port I-11-85. School of Public Health, Harvard University. Cited in Bobtin de Vigilancia Epi- demiohgica de Chile 12 : 14- 15 ( 198 5.
7 Davies, B., and A. Petros-Barvazian. El con- cepto de kg0 en la asistencia sanitaria. OMS, Cuadernos de Salud PGblica, No. 76. Organi- taci6n Mundial de la Salud, Geneva, 1985.
8 Organizaci6n Panamericana de la Salud!Or- ganizacibn Mundial de la Salud. Manual sobre enfoque de ries o en la atenciBn de salud. Mimeographed ocument (3 volumes). Wash- f
9
10
11
ington;D:C., 1984.
Su%rez-Ojeda, E. N. El enfoque de riesgo en la atencibn perinatal y maternoinfantil. Bol Of Sanit Panam 92(6):482-489, 1982.
Prindle, R. R., and C. Y. Gbmez. Identifi- cation of Maternal Risk by the PAHO/WHO
System. Mimeographed document. Pan American Health Organization, Washington, D.C., 1973.
Osuna, J. Enfoque de riesgo en la acenci6n maternoinfantil y atenci6n primaria en las Americas. In: Organitaci6n Panamericana de la Salud. S&d maternoinfantily atencih pri- maria en /as Amhikas-Hechos y tenden&.
PAHO Scientific Publication 46. Washington,
D.C., 1984.
12 F
13
14
15
16 /
17
18
19
20
21
‘laut, R. Anglisis de riesgo: Alcance y limita- iones para el administrador de salud. Bol Of :anit Panam 96(4):296-306, 1984.
3ertoni, N., C. Serrano, E. Same, and A. 1ia.z. Manual sobre enfoaue de rieseo v salud. nstituto Interamericand de1 Ni&, ‘Monte- rideo, Uruguay, 1983.
World Health Organization. Riik Approach Br Maternal and Child Health: A Selected Annotated Bibliography. WHO document
MCH/RA/81.1. Geneva, 1981.
National Academy Press. Rid Assessment in the Federal Government. Washinecon. D.C., 1983.
Institute of Medicine. Preventing Low Birthweight. National Academy Press, Wash- ington, D.C.. 1985.
Ministerio de Salud, Chile. Normas de aten- ci6n infantil y de1 adolescente. Chile, 1982.
Directors of various social security clinics. Per- sonal communications. Chile, 1982.
GonzBlez, J.. T. Tironi, M. Parodi, A. Vargas, M. 0 a&n, J. Numair, and G. Hein. Valida- cidn d e la escala de riesco de1 oroerama infan- til a nivel local. C&z’ Mid -SOG (Chile) 26(4):147-151, 1985.
Lettieri, D. J. Prediction: A prolegomenon. In: National Institute on Drug Abuse (USA). Predicting Adolescent Drzlg Abuse. DHHS
Publication No. (ADM) 81-299. Washington, D.C., 1980.
Mardones-Restat, F., and G. Jones 0. Prea’ic- cio’n en l’a administracih de programas de sa- Iud. Curso International de Viailancia Nutri- cional (CIVAN). INTA Publicayion No. 47. Instituto de Nutricicin v Tecnoloeia de 10s Ali- mentos, Santiago, 1985. -
22 Jones 0. de M., G., and F. Mardones-Restat. PredicciBn de1 riesgo de desnutrirse del reciin nacido: disefio metodoldgico. COPAN report.
Ministerio de Salud, Chile, 1982.
23 Jones 0. de M.. G., F. Mardones-Restat. and A. Le6n B. PredicciBn de1 riesgo de desnu- trirse. Advance report to COPAN. Ministeno de
Salud, Chile, 1982.
24 Jones 0. de M.. G., F. Mardones-Restat. A. Le6n B., and C. Vargas. Final report fo (‘(1N-
PAN. Ministerio de Salud. Chile. 1982. 25 Mardones-Restat , F., and G. Jones 0. de M. A
Preliminary Report. Mimeographed docu- ment. Board on Science and Technoloev for Deve1opmentlU.S. National Research coun- cil, Washington. D.C., 1983.
26 Jones, 0. de M., G., and E Mardones-Restat. Competencia familiar y desnutricion de1 lac- tante. Rev Cbil’Nutr 12(2):128, 1984.
27
28
29
30
Mardones-Restat, E, G. Jones 0. de M., M. Diaz, and J. Villar. Prediction de fallas en el crecimiento infantil. Rev Cbi/ Nutr 12(2):132. 1984.
Mardones-Restat, E, and G. Jones 0. de M. Report of the First Phase of Research Related to a Malnutrition Risk Assessment Instrument. Mimeographed document. Board on Science and Technology for Development/National Academy of Sciences, Washington, D.C., 1985.
Mardones-Restat, E, G. Jones 0. de M., and M. Diat. Un predictor de la desnutncrdn in- fantil. Paper presented at the XI Jomadas Chi- lenas de Pediatria held at Santiago on 28-30 November 1985.
Bradley, E. The efficiency of logistic regression compared to normal discrimination analysis. Journal of the American Statistical Association
70(3):892-898. 1975.
31 Press, J., and S. Wilson. Choosing between lo- gistic regression and discrimination analysis. JournaL of the Amencan StatisticaL Association
73(4):699-705, 1978.
32 Harrel, F. E. The Logistic Procedure SUGl
S. A.S. Supplemental Library Useri Guide. S.A.S., Inc.; Gary, North Carolina: 1983.
33 Mardones, J.. and R. Cox. La ahmentacih en Chile. Edit. Universitaria. Santiago, 1942.
34 Monckeberg, E Politica de alimentacio’n en Chile. Consejo para la AlimentaciBn y Nutri- cidn. Santiago, 1975.
35 Gonzalez! N., and H. Sanchez. Politicas de alimentacion v nutrition en Chile. Cuaa’ernos M&&co-Sociaies 21: 18-27, 1984.
36 Mardones, J. La re orma de /a seguridaa’social de/ obrero en d C i’e. Ed. Juridica de Chile, Chile, 1954.
37 Ministerio de Salud de Chile. Atenciones y re- curses. Annual publication. years 1975-1984. Published in Chile, 1976-1985.
38
39
40
41
42
43
44
Monckeberg, F., S. Valientes, and F. Mar- dones-Restat. Desnutricidn v mortalidad in- fantil en Chile en 10s Gltimos 20 anos. Revista
CRECES 10(5):24-33, 1984.
Sempe, M. .Szrue&ance de k croissences de l’enfant: References practiques. Les contours medicales 43. Paris, France, 1964.
World Health Organization. A Growth Chart for International Use in Maternal and Child Heahb Care: Guidehnes for Primary Hear’th
Care Personnel’. Geneva, 1978.
Organitacidn Panamericana de la Salud. Ficba de crecimiento para use internaciond en d cuidado de l’a salud materna e infantd Wash- ington, D.C., 1980.
Habicht, J-P A Nutritional Surveillance Sys- tem in Chile. Report of a PAHO/WHO consulta-
tion. Pan American Health Organization, Santiago, 1980.
Horwitz, A. Funciones de CONPAN. Report to the Ministry of Health (Mimeographed docu- ment). Santiago, 1980.
Horwitz, A., C. Martinez, and J. Munoz. Bases oara un sistema de vieilancia de la ali- menta& y nutrici6n en C&e. FAO consulta- tion. Food and Agriculture Organization, San- tiago, 1982.
45 Jones 0. de M., G., and F. Mardones-Restat. Investigaciones operativas en programas de orevencidn inteeral de la desnutricibn. ‘Cuaa’ernos MZdEo-Socia/es (Chile) 2 I: 39- 53, 1980.
46
47
48
49
Schiaffmo. A., A. Poch, F. Esoin, G. Jones, and F. Mardones-Restat. Mortahdad infantil en Uruguay. (OPS/OMS/UIWPA.) Ministerio de
Salud, Montevideo, 1983.
Kleinman, D. G., L. L. Kupper, and H. Morgenstern. Epidemiol’ogic Research. Wads- worth; Belmont, California, 1982.
Mardones-Restat. E Salud v bienestar familiar.
PAHO/WHO report (mimeographed). Santiago, Chile, 1984.