PRODUCTIVITY SPILLOVERS FROM MULTINATIONAL CORPORATIONS IN THE PORTUGUESE CASE: EVIDENCE FROM A SHORT TIME PERIOD
PANEL DATA
Isabel Proença *, Maria Paula Fontoura** and Nuno Crespo***
* CEMAPRE and ISEG, Technical University of Lisbon ** CEDIN and ISEG, Technical University of Lisbon *** ISEG, Technical University of Lisbon
Correspondence address: Isabel Proença (isabelp@iseg.utl.pt) ISEG, Rua do Quelhas, 6
1200-781 Lisboa
Abstract
Empirical evidence on productivity spillovers - a concept that embodies the fact that foreign enterprises own intangible assets which can be transmitted to domestic firms, thus raising their productivity level - is ambiguous. With a panel data set at the firm level for the Portuguese manufacturing industry, we aim to uncover the possibility that the choice of statistical techniques will have profound effects on evidence of spillovers diffusion. We will consider the panel data models commonly used in the literature and the recent and more robust Extended GMM technique, specially devised for panels with a small number of time periods. We find that positive spillovers occur only when the technologic gap between domestic and foreign firms is moderate. Though all methods agree on this result, there are differences worth to be noted, revealing that the traditional estimates can sometimes be misleading.
JEL Codes: F21, F23, 052
PRODUCTIVITY SPILLOVERS FROM MULTINATIONAL CORPORATIONS IN THE PORTUGUESE CASE: EVIDENCE FROM A SHORT TIME PERIOD
PANEL DATA1
1. Introduction
One of the benefits most cited from multinational corporations (MNCs) and associated foreign direct investment (FDI) on host countries is the increase in domestic firms’ productivity. This is related to the concept of productivity (or technology) spillovers, which embodies the fact that foreign enterprises own intangible assets such as technological know-how, marketing and managerial skills, international experience or reputation, which can be transmitted to domestic firms, raising their productivity level. Productivity spillovers diffusion is thus a matter of externalities from established foreign producers to domestic ones.
The knowledge content of the spillover effect is inherently an abstract concept and, thus, not directly measurable. The approach usually adopted in the empirical literature consists in capturing this effect indirectly, in the framework of an econometric analysis in which labour productivity (or another measure for productivity) in domestic firms is regressed on a number of covariates assumed to have an effect on productivity, including the presence of foreign firms.
A substantial body of literature to analyse whether there are productivity spillovers from the presence of MNCs to domestic firms in host countries has developed over the past 25 years, but recent years have seen a surge of such studies. This reflects, on the one hand, the growing interest on the subject, considering the widespread attitude favourable to attracting FDI inflows. On the other hand, it is a consequence of the fact that in many countries disaggregated data at the firm level is more easily available than in the past and also to the improvement of econometric techniques to deal with panel data sets of enterprises.
Empirical evidence on spillovers diffusion produces mixed results, as the survey of Blömstrom and Kokko (1998) shows. Considering the lack of formal theoretical modelling, ambiguity on the empirical evidence on spillovers can always be justified on
1
account of a specification problem. The negative results may be due, for instance, to omitted variables and the reduced form used. But it might also be a result of the data set used (sectoral or firm level; longitudinal or cross-section), definition of variables and/or to the econometric techniques adopted. Görg and Strobl (2001) performed a meta-regression analysis to a sample of papers representative of the subject and concluded that the results of productivity spillover studies do not appear to be affected by whether the studies use sector or firm level data but that it is important whether the data used are cross-sectional or panel data.
The differences found between cross-sectional studies and panel data studies are quite expectable if there are time-invariant firm or specific effects on the relationship between MNCs and productivity. The spillover effect in the former will be, most probably, overstated. In fact, studies in the seventies and eighties were basically performed with cross-sectional data while, more recently, the majority adopted a panel data set. Nonetheless, the mix results on the sign of the coefficient of the spillover variable remain. For instance, we find a negative result in Djankov and Hoekman (2000) and Kathuria (2000) but a positive one in Liu et al. (2001). The question as to why some studies find positive, while others find negative or no spillover effects from MNCs and why the magnitude of the regression coefficients differs across studies remains, thus, in part unanswered.
In this paper we have recourse to a panel data set for micro data at the firm level of the Portuguese manufacturing industry in the period 1996-98 and uncover the possibility that the choice of statistical techniques will have profound effects on the results obtained in what concerns the spillovers diffusion. Results on this literature are in general based on simple popular panel data, as the classic Pooled OLS or, if the purpose is to take into account the heterogeneity of the firms, the Fixed and Random Effects models. However these methods may not be reliable because they do not take into account both heteroscedasticity and autocorrelation, or/and endogeneity, which are likely to occur in this type of modelling. In what concerns endogeneity of some explanatory variables, it is well known that high productivity sectors or firms may attract the location of MNCs in the same sector yielding a positive relationship even without spillovers taking place; productivity shocks may also have an effect on the input factors employed in the firm.
In the case study analysed in this paper we use the recent Extended Generalized Method of Moments (GMM) technique for panel estimator of Blundell and Bond (2000). This estimating technique is a solution to the expected above mentioned econometric problems and is adapted to the characteristics of our sample. The advantage of this recent Extended version is to elude the finite-sample bias and lack of precision that frequently occur in the traditional Differenced GMM estimates when the number of time-periods is small, as it is the case in our sample.
For purposes of comparison, we will also consider the panel data models commonly used in the productivity spillovers literature: the Pooled OLS, a Fixed Effects (FE) model and a Random Effects (RE) model2. The FE model was selected, in spite of the characteristics of our sample, for it avoids the inconsistency due to correlation between the regressors and the firm specific (permanent) effect. Results for the several methods of estimation used are discussed and compared based on the reasonability of parameter estimates and underlying hypothesis.
Apart from the methodological points mentioned above, this study aims to be a meaningful addition to the studies already performed for Portugal as well as to other country studies on the subject, namely those for other “emerging” E.U. economies, like Spain, Ireland and Greece3.
Portugal became an important recipient of foreign direct investment inflows after joining the European Union (E.U.) in 1986. Foreign direct investment as a percentage of GDP rose up from less than 1 % before 1986 to 5 % in 1990 and, in spite of the fact that this ratio decreased between 1991 and 1994, another positive trend occurs in the second half of the nineties till a peak of 11.4 % in 1998. A significant share of this inflow has been increasingly directed to the manufacturing sector (47.4 % of total FDI inflow in 1995-99). It should be pointed out however that if foreign direct divestment is taken into account, the previous picture is altered to more modest values since the beginning of the nineties. In fact, for this decade, inward FDI net of divestment displays only an average of 2 % of GDP, while the 1998 peak is reduced to 2.54 %.
Previous results for Portugal on the topic display the mix results of the literature in general. Santos (1991) did not find a significant influence of FDI on the productivity
2
See Konings (2000) for an estimation with the traditional GMM. 3
level of domestic firms in a sectoral analysis for the period 1977-82. However, Farinha and Mata (1996), with micro data at the firm level and covering the 1986-92 period, found a positive effect. Flôres et al. (2000), with a study at the sectoral level for 1992-95, concluded that the relationship between domestic firms productivity and the foreign presence does take place in a positive way only if a proper technology differential between the foreign and domestic producer exists and the sectoral characteristics are favourable.
Considering that the main purpose of this study is to analyse the impact of alternative statistical techniques on the results of the crucial spillovers variable, we chose to estimate a rather standard model of the FDI-spillovers’ literature, based on the pioneering work of Caves (1974) and Globerman (1979). This model will be, nonetheless, extended in order to include the technological gap effect, pointed out as relevant in the Portuguese case by Flôres et al. (op. cit).
In what follows, section 2 presents a standard productivity spillovers model, including the description of the data and the variables; section 3 discusses the panel data estimates to be used in this paper; section 4 presents the empirical results of the standard model. In section 5, we extend the standard model in order to get a more accurate picture of the spillovers effect. Section 6 concludes.
2. An empirical standard model
Productivity spillovers can occur through three main channels (Blömstrom and Kokko, 1998): (i) learning of more efficient technologies through arm´s length relationships with MNCs; (ii) labour mobility of highly-skilled staff from MNCs to domestic firms; (iii) incentives to competition resulting from the foreign affiliates entrance either through a more efficient use of existing technology and resources or a search for more efficient technologies, or a restraint on the exercise of market power by domestic firms. This last effect may reduce productivity in domestic firms if MNCs attract away demand from their domestic counterparts, thus forcing them to spread their fixed costs over a smaller market (Aitken and Harrison,1999).
domestic firms to 1604 due to the need to exclude sectors without foreign presence. Sectoral disaggregation is done at the three digit-level of the NACE Nomenclature (Eurostat), which corresponds to 103 sectors, of which only 62 report the existence of foreign firms.
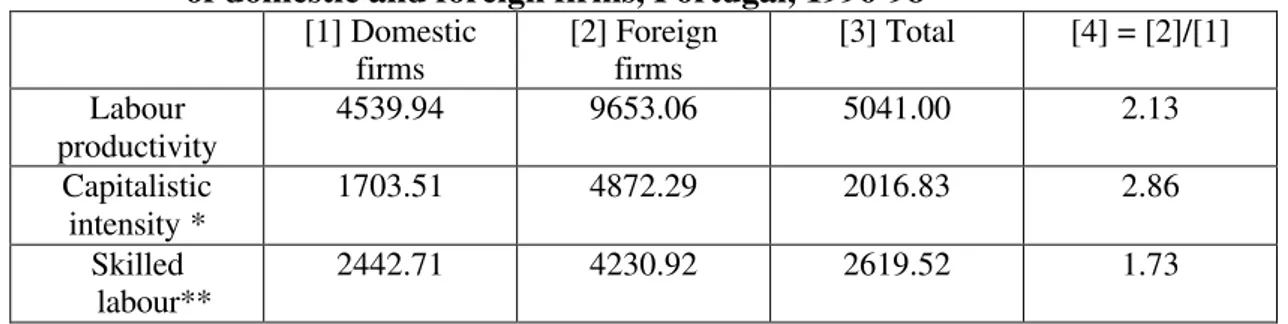
A crucial premise of this kind of studies is that MNCs are more technologically advanced than domestic firms. A preliminary investigation of our data indicates the existence of statistically significant differences between the labour productivity of domestic and foreign firms. The latter are, on average for the three years period analysed, 2.13 times more productive than the former (table 1).
Table 1:Labour productivity, capitalistic intensity and skilled labour of domestic and foreign firms, Portugal, 1996-98
[1] Domestic firms
[2] Foreign firms
[3] Total [4] = [2]/[1]
Labour productivity
4539.94 9653.06 5041.00 2.13
Capitalistic intensity *
1703.51 4872.29 2016.83 2.86
Skilled labour**
2442.71 4230.92 2619.52 1.73
* Total fixed assets divided by the number of workers ** Total remuneration per worker
A disaggregation at the sectoral level (for the two-digit level of the NACE, as presented in the Annex) reveals that only in four sectors (19, 23, 27 and 33), domestic firms are more productive than their foreign counterparts (Table 1-A in the Annex). Sector 23 is worthwhile being signalled, as the former are four times more productive, but this may be explained on account on the exceptional good performance of one firm (the Petrogal SA). In sectors 16, 30 and 37 there is no foreign presence, according to our database.
Table 1 also reports that, in the period analysed, on average, the capitalistic intensity, as measured by total fixed assets divided by the number of workers of the firm, is almost three times higher for the foreign firms, while the skilled labour intensity, proxied by the wage level of the firm, displays a superiority close to two times more. Together, these results point out to the possibility of benefits in terms of positive spillovers for the host country stemming from FDI.
firms to be a function of the foreign affiliates’ share and various other industry characteristics.
To account for the spillovers effect, we follow the common practice to use a variable for foreign presence (FP) measured at the sectoral level. This approach assumes that spillovers are sector-specific and ignores possible inter-industry spillovers4. With the proviso that labour productivity is at best a partial measure of overall multi-factor productivity5, if spillovers occur there should be higher productivity levels for domestically owned firms in sectors with a larger foreign presence. Variable FP should then have a significant positive coefficient.
As the amount of technology that could potentially spill over to local firms is probably not exogenously given, but dependent on both host country and industry characteristics, we include several control variables for the domestic firms: the skill of the labour force (SL), the capitalistic intensity (CI), the level of scale economies (SE) and a proxy for the degree of concentration (H).
We expect a positive relation between SL, CI, SE and domestic productivity. SL and CI stem from a rearranged version of a production function6. SE must capture that, in presence of increasing returns to scale, the larger the output of the firm, the higher labour productivity will be. On what concerns variable H, there are different positions concerning the influence of the degree of concentration in productivity. On the one hand, a higher concentration forces domestic firms to improve their productive processes but, on the other hand, it can lead to a reduction of the speed of innovation due to monopolistic inefficiencies (Sjöholm, 1999). The expected sign for H is, thus, ambiguous. Finally we include fixed time effects as represented by λt to capture possible common aggregate shocks in production, like technological progress or other unobserved time varying (pro-cyclical) influences on productivity.
Variables definition
The dependent variable of our model, PRODit (productivity of the domestic firm i at time t), is a labour productivity variable given by total added value of domestic firm i divided by the number of workers of the firm, at time t.
4
For a preliminary search on intersectoral spillovers, see Sjöholm (1999) and Flôres et al. (2000). 5
A concept which takes into account the combined productivity of the firm when all inputs are included. See Haddad and Harrison (1993) for a firm specific measure of multi-factor productivity.
6
The choice of the independent variables is determined by the issues above exposed. They are the following:
it
FP (foreign presence) – Share of equity capital held by foreign firms in the industrial sector of domestic firm i,at time t.
it
SL (skilled labour) – total remuneration per worker in domestic firm i, at time t.
it
CI (capitalistic intensity) - total fixed assets of domestic firm i divided by the number of workers, at time t.
∑ ∑
∈∈
=
J g
J g
gt gt it
X X H
2
(Herfindhal concentration index) – where Xgt represents the output
of firm g at time t; g is an index for the firms (domestic or foreign) belonging to sector J to which domestic firm i belongs.
it
SE (scale economies) - the ratio of the output of domestic firm i to the average output of the five larger firms (in terms of output) in the same sector of firm i, at time t.
All data are built from the Dun & Bradstreet dataset but for the foreign presence proxy. The latter was collected from the Ministry of Employment, a reliable source for information at the sectoral level.
3. Econometric estimation
The standard model described in last section can be specified in the following linear equation (model 1):
PRODit = β1 FPit + β2 CIit + β3 SEit + β4 SLit + β5 Hit + λt + ηi + εit [1]
where the variables have the same meaning as before. Of the unobservable error components, ηiis a random time invariant firm specific effect, the permanent effect, andεit is a transitory random effect (with mean zero), which may be heteroscedastic and/or autocorrelated.
have consistent estimates, the permanent effect has to be removed either by considering the Within estimator or fixed effects model or by differencing the model, which amounts to built equation [1] defined in the variables first-differenced.
Another expectable problem is endogeneity of some explanatory variables, requiring the use in estimation of instrumental variables in order to achieve consistency. It is highly plausible that workers remuneration, the proxy for skilled labour, may depend also on the productivity itself. Attempts to measure the spillover effects from FDI may face another similar critical identification problem, expressed as follows by Aitken and Harrison (1999): “if foreign investment gravitates towards more productive industries, then the observed correlation between the presence of foreign firms and the productivity of domestically owned firms will overstate the positive impact of foreign investment” (p. 606). Thus, skilled labour and foreign presence are considered potentially endogenous.
Since we observe 1604 firms belonging to many different economic sectors and having dissimilar characteristics, we expect to have some heterogeneity, which will be captured by the random permanent effect (the unobserved firm specific effect), and an heteroscedastic transitory effect. In fact, an heteroscedasticy test applied to the residuals of the differenced model in each year rejects the hypothesis of homoscedasticity. Therefore, we assume that the transitory effect is heteroscedastic and when possible (i.e., in all models but the RE), estimated standard deviations are heteroscedasticity robust.
It is natural to suspect also that observations for the productivity may be correlated in time. However since we have only three periods in time it is likely that we are not able to detect it. On the other hand, the presence of heteroscedasticity invalidates the known autocorrelation tests for panel data like the Durbin and Watson (see for instance Baltagi, 1995), the MCS tests of Arellano (1990) and the tests based on the m-statistics of Arellano and Bond (1991).
inconsistent as well. As we have pointed out above, these situations are likely to occur with our data, what points out to the need of more robust estimation methods.
GMM estimators are a solution, for they may be robust to heteroscedasticity and autocorrelation and allow for instrumental variables. Estimating model [1] with variables first-differenced gives the Differenced GMM model, whose estimates can be consistent in all the settings described before. More recently, Blundell and Bond (2000) introduced the Extended GMM (or System GMM) as an alternative to the Differenced GMM that has revealed to be particular efficient in situations with short panels and thus more appropriate to our needs.
In fact, using the model in first-differences to eliminate the permanent effect and estimating it with GMM using as instruments the lagged values of variables in levels to correct for simultaneity, as proposed by the Differenced GMM, has given poor results in some problems where there is a weak correlation between variables in levels and in first-differences, and consequently weakness of instruments. This problem can lead even to serious finite-sample biases and imprecision of parameter estimates in short panels, as we could confirm in our sample. To reduce these biases, Blundell and Bond (2000) propose to include more informative moment conditions that are valid under quite reasonable assumptions. The result is an extended GMM where the equations in first-differences are estimated simultaneously with the equations in levels. For the last equations, instruments are lagged variables in first-differences. Equations in levels embody the permanent effect, so that instruments have to be defined for all the explanatory variables that are suspected to be correlated with it. Therefore, this procedure assumes that lagged differenced variables are not correlated with the permanent and transitory effects and these are the additional moment conditions considered.
4. Results for the standard model
Table 2 displays the results of these estimations with the four econometric methods. Time effects λ98, λ97 and λ96 are, respectively, the Constant (C), λ98+δ97 and λ98+δ96. Observe that δ96 and δ97 in the table are the difference in the temporal effect relatively to year 98. We include the Hausman test statistics, which tests the null hypothesis that the (random) effects are uncorrelated with the explanatory variables. Though the null is rejected, the results of this test should be taken with care due to the lack of control for heteroscedasticity. In order to test the validity of the instruments, a Sargan test asymptotically χ2 distributed is computed.
The Extended GMM estimates were obtained considering endogeneity of skilled labour alone and together with foreign presence. We use as instruments for the first-differenced variables the lagged values of the regressors in levels (lagged twice). For the quantities in levels, the instruments are the lagged values of the regressors first-differenced.
With all methods we verify that the foreign presence variable is always non significant and, thus, the expected spillover effect is not confirmed.
Table 2: A standard model
Independent Variables
OLS Fixed
Effects Model Random Effects Model Ext. GMM (endogeneity of SL) Ext. GMM (endogeneity of SL and FP)
C 1042.93
(2.15) 2451.28 (13.60) 860.53 (3.81) 1706.23 (3.70)
FP 4.23
(.37) -2.23 (-.35) .32 (.07) -6.60 (-.95) -14.93 (-.77)
CI .009
(1.60) -.002 (-1.31) -.002 (-3.26) .08 (1.32) .01 (1.43)
SL .90
(4.91) -.002 (-.01) .31 (13.78) .66 (6.58) .66 (6.54)
SE 3113.50
(3.64) 5247.92 (3.15) 4148.36 (13.61) 2569.83 (2.87) 2591.59 (2.83)
H 7898.67
(2.00) 2577.23 (.87) 8295.92 (7.47) 2668.38 (1.38) 3352.19 (1.37)
δ96 -286.32
(-1.47)
-732.68 (-6.83)
-622.35 (-8.66)
δ97 -185.34
(-1.03) -302.22 (-3.89) -261.53 (-3.69) -129.85 (-2.13) -122.68 (-1.95) Hausman Test (H0:RE vs.FE) CHISQ(5) = 14.41 [P-value= .01]
[P-value=.08] [P-value=.06]
Diff. Sargan Test 0.52 (df=1)
[P-value=.47]
t-values (between brackets) using White´s heterocedasticity correction in OLS, FE and GMM estimates
Instead of assuming that the foreign impact on performance increases monotonically with the degree of foreign ownership, it is possible that foreign ownership affects the performance of domestic firms in a uniform way, i.e., causing a shift which can be estimated through a dummy if the foreign presence crosses a certain threshold. We built such a dummy variable equal to 1 if the foreign presence in the sector is higher than 10 % and run again all models in Table 2 with this dummy for FP. However, the results are quite similar to those for the continuous variable.
5. Extending the standard model
Foreign presence and the technologic gap
One reason for the absence of a significant effect of foreign investment on the productivity level could be a dynamic interaction between FP and PROD which can not be properly analysed within the so-short time period available. In fact, it presumably takes time for firms to restructure and the effects on productivity will appear perhaps only after a few years. However, if such dynamic behaviour exists, we believe it may not be so relevant, at least within the short period of our analysis. In fact, estimates for the coefficients of FP (as well as for the transformed FP variable proposed in this section), lagged one and two years, are not statistically significant in the equation for domestic productivity in 1998.
Kokko et al. (1996) and Flôres et al. (2000) found evidence for productivity spillovers only to domestic firms with moderate technologic gaps vis-à-vis foreign firms, i.e., domestic firms with at least some capability of being able to make use of MNCs indirect effects. For considerable lower levels of technology, the effect will not occur. We follow Flôres et al. (2000) specification for the inclusion of the technologic gap, with some alterations. Accordingly, we not only include the influence of the technologic gap but we also seek for the most appropriate gap, i.e. the interval that maximises the spillover effect.
To include the influence of the technologic gap, we build the variable TGit as the ratio of the productivity of domestic firm i to the highest productivity of the foreign firms in the industrial sector of firm i. By assuming that a higher productivity signals a better technology, TG is an indirect measure of the gap. For values below 1, the higher the gap the lower is TG.
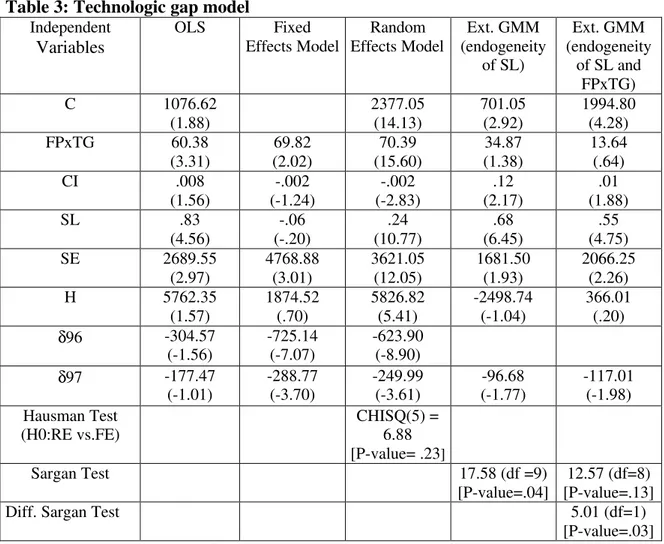
In order to express the possibility that, even if FP is high, a high gap (i.e. a low TG) would not be favourable to spillovers, TG is interacted with FP (FPxTG) and we estimate the new following model (model 2):
PRODit = β1 FPitxTGit + β2 CIit + β3 SEit + β4 SLit + β5 Hit + λt + ηi + εit [2]
where λt ,ηi and εit have the same characteristics as in [1].
Table 3: Technologic gap model
Independent Variables
OLS Fixed
Effects Model Random Effects Model Ext. GMM (endogeneity of SL) Ext. GMM (endogeneity
of SL and FPxTG)
C 1076.62
(1.88) 2377.05 (14.13) 701.05 (2.92) 1994.80 (4.28)
FPxTG 60.38
(3.31) 69.82 (2.02) 70.39 (15.60) 34.87 (1.38) 13.64 (.64)
CI .008
(1.56) -.002 (-1.24) -.002 (-2.83) .12 (2.17) .01 (1.88)
SL .83
(4.56) -.06 (-.20) .24 (10.77) .68 (6.45) .55 (4.75)
SE 2689.55
(2.97) 4768.88 (3.01) 3621.05 (12.05) 1681.50 (1.93) 2066.25 (2.26)
H 5762.35
(1.57) 1874.52 (.70) 5826.82 (5.41) -2498.74 (-1.04) 366.01 (.20)
δ96 -304.57
(-1.56)
-725.14 (-7.07)
-623.90 (-8.90)
δ97 -177.47
(-1.01) -288.77 (-3.70) -249.99 (-3.61) -96.68 (-1.77) -117.01 (-1.98) Hausman Test (H0:RE vs.FE) CHISQ(5) = 6.88 [P-value= .23]
Sargan Test 17.58 (df =9)
[P-value=.04]
12.57 (df=8) [P-value=.13]
Diff. Sargan Test 5.01 (df=1)
[P-value=.03]
t-values (between brackets) using White´s heterocedasticity correction in OLS, FE and GMM estimates
The technologic gap best range
It is possible that technologic gap matters for the spread of the FDI indirect effect but only within a certain range. For this purpose, we performed a test of the sensitivity of the model to alternative ranges for the gap.
Several alternatives were created by “cutting” variable TG outside pre-set ranges (40-80%; 40-95%; 50-80%, 50-95%; 60-95%). Next we define a dummy with value one whenever the TG values are within the pre-defined ranges and zero otherwise, and we interact this new variable with FP. Accordingly, FP is now defined only within the range for TG; otherwise, it takes value zero.
We estimate again equation [2] but replacing FPxTG by each one of these dummies multiplied by FP, as shown in the following equation (model 3):
where λt,ηi and εit are the same as before and Dit is a dummy variable that takes the
value one if TGitis in the specified range, and zero otherwise.
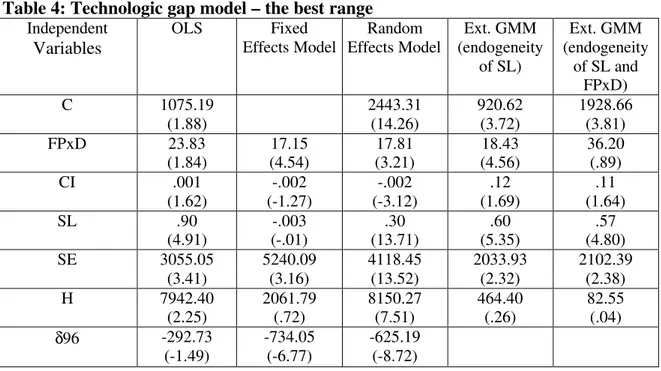
Only in the two last mentioned ranges is the variable FPxD significant. This result confirms the idea that the gap can not be too high in order to guarantee the existence of the absorptive capacity of domestic firms. The “best range”, i.e., the one for which we get not only a significant but also the highest coefficient, is the 60-95% one. This result is confirmed with all methods of estimation. Of course, this range is a data-driven finding, and, accordingly, should not be taken as an “optimal range”, even for the Portuguese reality. The interest of this exercise is basically to confirm the role of the gap range for the occurrence of spillovers.
Table 4 reports the results when we estimate the equation [2] replacing the variable FPxTG by FP defined within the range 60-95% for TG (FPxD). Here again the spillovers effect with the proxy is clear superior in magnitude to the one given by FP alone. More important, the spillovers variable is always statistically significant, even with the Extended GMM, except when SL and FPxD are considered both endogenous. Nevertheless, the neutral effect in this latter case can be due to a severe lack of precision given that the Difference Sargan’s test suggests that endogeneity of FPxD can be rejected. Therefore, we can rely on the estimates of the Extended GMM with endogeneity of SL alone.
Table 4: Technologic gap model – the best range
Independent Variables
OLS Fixed
Effects Model Random Effects Model Ext. GMM (endogeneity of SL) Ext. GMM (endogeneity
of SL and FPxD)
C 1075.19
(1.88) 2443.31 (14.26) 920.62 (3.72) 1928.66 (3.81)
FPxD 23.83
(1.84) 17.15 (4.54) 17.81 (3.21) 18.43 (4.56) 36.20 (.89)
CI .001
(1.62) -.002 (-1.27) -.002 (-3.12) .12 (1.69) .11 (1.64)
SL .90
(4.91) -.003 (-.01) .30 (13.71) .60 (5.35) .57 (4.80)
SE 3055.05
(3.41) 5240.09 (3.16) 4118.45 (13.52) 2033.93 (2.32) 2102.39 (2.38)
H 7942.40
(2.25) 2061.79 (.72) 8150.27 (7.51) 464.40 (.26) 82.55 (.04)
δ96 -292.73
(-1.49)
-734.05 (-6.77)
δ97 -182.08 (-1.01)
-300.06 (-3.87)
-259.18 (-3.66)
-109.38 (-1.64)
-111.42 (-1.67) Hausman Test
(H0:RE vs.FE)
CHISQ(4) = 10.14 [P-value= .04]
Sargan Test 12.95 (df =9)
[P-value=.17]
12.58 (df=8) [P-value=.13]
Diff. Sargan Test 0.37 (df=1)
[P-value=.54]
t-values (between brackets) using White´s heterocedasticity correction in OLS, FE and GMM estimates
Finally, we interacted the FPxTG value with this pre-defined dummy for the 60-95% technologic gap range. The purpose is to evaluate whether, for spillovers diffusion, more relevant than the range of the technologic gap is the level of the variable TG in this range. However, the results are quite similar in terms of the significance for all the variables.
This exercise confirms that, in what concerns productivity spillovers, the presence of MNCs affects only a certain group of firms, those with moderate technologic gaps vis-à-vis foreign firms. The aggregate study we performed with equation 1 was underestimating the true significance of the foreign presence for the spillovers effect.
6. Final remarks
More significant differences may occur, of course, with other specifications and/or dataset. Several control variables are also very sensitive to the estimation method.
A remark should be done about the validity of instruments used. If the foreign presence and the technologic gap influence productivity dynamically, the validity of their lagged values as instruments may be questionable. However, as mentioned before, it appears that such dynamic behaviour may not be so relevant, at least in the short period of our analysis.
In what concerns the role of the technologic gap, our study basically confirms the conclusions of Flôres et al. (2000) with a study for nine sectors of the manufacturing industry. Apparently, this particular result is not sensitive to whether the study uses sector or firm level, as also found by Görg and Strobl (2001).
References
Aitken, B. and Harrison, A. (1999), “Do Domestic Firms Benefit From Direct Foreign Investment? Evidence From Venezuela”, American Economic Review, 89, pp. 605-618.
Arellano, M. (1990), “Testing for Autocorrelation in Dynamic Random Effects Models”, Review of Economic Studies, 57, pp. 127-134.
Arellano, M. and Bond, S. (1991), “Some Tests of Specification for Panel Data: Monte Carlo Evidence and an Application to Employment Equations”, Review of Economic Studies, 58, pp. 277-297.
Baltagi, B. (1995), Econometric Analysis of Panel Data, 1st ed., Chichester, Wiley.
Barrios, S. (2000), “Foreign Direct Investment and Productivity Spillovers: Evidence From the Spanish Experience (1990-1994)”, Working Paper 2000-19, Fundacíon de Estudios de Economia Applicada, Madrid.
Blomström, M. and Kokko, A (1998), “Multinational corporations and spillovers”, Journal of Economic Surveys, 22, pp. 247-77.
Blundell, R. and Bond, S. (2000), “GMM Estimation with Persistent Panel Data: An Application to Production Functions”, Econometric Reviews, 19(3), pp. 312-340.
Caves, R. (1974), “Multinational Firms, Competition and Productivity in Host-Country Markets”, Economica, 41, pp.176-193.
Dimelis, S. and Louri, H. (2001), “Foreign Direct Investment and Efficiency Benefits: Do Size and Ownership Matter?”, Paper delivered at the Business & Economics Society International Conference, Paris, 22-26 July.
Djankov, S. and Hoekman, B. (2000), “Foreign Investment and Productivity Growth”, World Bank Economic Review, vol. 41, pp. 49-64.
Farinha, F. and Mata, J. (1996), “The Impact of Foreign Direct Investment in the Portuguese Economy”, Working Paper nº. 16/96, Bank of Portugal.
Flôres, R., Fontoura, M. and Santos, R. (2000), “Foreign Direct Investment Spillovers: What Can we Learn From Portuguese Data?” Working Paper 4/2000, Department of Economics, ISEG, Technical University of Lisbon.
Globerman, S. (1979), “Foreign Direct Investment and Spillover Efficiency Benefits in Canadian Manufacturing Industries”, Canadian Journal of Economics, 12, pp.42-56.
Haddad, M. and Harrison, A. (1993), “Are There Positive Spillovers From Direct Foreign Investment? Evidence From Panel Data For Marocco”, Journal of Development Economics, 42, pp.51-74.
Kathuria, V. (2000), “Productivity Spillovers From Technology Transfer to Indian Manufacturing Firms”, Journal of International Development, 8, pp. 517-30.
Kokko, A., Tansini, R. and Zejan, M. (1996), “Local Technological Capability and Productivity Spillovers From FDI in the Uruguayan Manufacturing Sector”, Journal of Development Studies, 32, pp. 602-11.
Konings, J. (2000), “The Effects of Foreign Direct Investment on Domestic Firms: Evidence from Firm Level Panel Data in Emerging Economies”, CEPR Discussion Paper nº 2586.
Liu, X., Siler, P. Wang, C and Wei, Y. (2000), “Productivity Spillovers From Foreign Direct Investment: Evidence From UK Industry Level Panel Data”, Journal of International Business Studies, 31, pp.407-25.
Ruane, F. and Ugur, A. (2000), “Foreign Direct Investment and Productivity Spillovers in Ireland - Some Preliminary Results” Paper delivered at the Annual Conference of the Irish Economic Association in Waterford, 31st March-2nd April.
Santos, V. (1991), “Investimento Estrangeiro e a Eficiência da Indústria Portuguesa” Estudos de Economia,11(2), pp. 181-201.
Annex
Table 1 – A: Labour productivity of domestic and foreign firms, Portugal, 1996-98, sectoral level*
Sector [1] Domestic firms [2] Foreign firms [3]=[1]/[2]
15 5171.44 11629.99 .44
17 3393.71 4212.40 .81
18 2901.85 6072.81 .48
19 3153.31 2371.29 1.29
20 4578.91 9014.35 .51
21 6309.86 8086.89 .78
22 6532.75 8481.98 .77
23 80969.89 20959.32 3.86
24 6625.64 16886.46 .39
25 5686.92 7533.21 .75
26 5036.37 7139.03 .71
27 4419.67 3508.32 1.23
28 3918.76 5696.74 .69
29 4454.82 6133.85 .73
31 5877.13 6463.00 .91
32 6554.35 7905.23 .83
33 6941.16 3601.57 1.93
34 6115.36 6255.20 .98
35 2695.36 7068.80 .38
36 3208.56 7562.10 .42
* Two-digit level of the NACE
NACE nomenclature
15 – Manufacture of food products and beverages 16 – Manufacture of tobacco products
17 – Manufacture of textiles
18 – Manufacture of wearing apparel; dressing and dyeing of fur
19 – Tanning and dressing of leather; manufacture of luggage, handbags, saddlery, harness and footwear
20 – Manufacture of wood and of products of wood and cork, except furniture; manufacture of articles of straw and plaiting materials
21 – Manufacture of pulp, paper and paper products
22 – Publishing, printing and reproduction of recorded media 23 – Manufacture of coke, refined petroleum and nuclear fuel 24 – Manufacture of chemicals and chemicals products 25 – Manufacture of rubber and plastic products
26 – Manufacture of other non- metallic mineral products 27 – Manufacture of basic metals
28 – Manufacture of fabricated metal products, except machinery and equipment 29 – Manufacture of machinery and equipment n.e.c.
30 – Manufacture of office machinery and computers 31 – Manufacture of electrical machinery and apparatus n.e.c.
32 – Manufacture of radio, television and communication equipment and apparatus 33 – Manufacture of medical, precision and optical instruments, watches and clocks 34 – Manufacture of motor vehicles, trailers and semi-trailers