I. Introduction
T
HE These photosensitive cells react to the light reflected by objects. visual perception of color involves the cone cells on retina. There are three types of cone cells with different sensitivities: S-cones, M-cones, and L-cones, which are sensitive to small, medium, and large wavelengths of light, respectively. These three types of cones work well for an individual without color vision deficiency (CVD), and he/ she is called a trichromat [1].(a) (b) (c) (d)
Fig 1. Color wheel when seen by (a) regular trichromat people; (b) protanope people, (c) deuteranope people and (d) tritanope people.
However, about 5% of world population have some sort a disturbance in color perception, which reduces their visible color spectrum [2]. This visual disturbance of CVD people may reduce their perception of the surrounding world, specifically when compared to trichromats (cf. Fig. 1). For example, a trichromat can distinguish two overlapping objects with distinct colors in an image, but a CVD person may not distinguish
them, i.e., two distinct colors are perceived as one.
A. Color Vision Deficiencies
CVD mainly stems from the partial or total malfunctioning of a cone cell type, as shown in Fig. 2. In the case of partial malfunctioning of a single type of cones, the deficiency is called anomalous trichromacy, but if this malfunctioning is total, the impairment is called dichromacy; finally, in the case of total malfunctioning of two or three types of cone cells, the impairment is known as monochromacy [3] [4]. Besides, as illustrated in Fig. 2, the prefixes ‘protano’ (or protan), ‘deuterano’ (or deutan) and ‘tritano’ (or tritan) denote the handicap of L-, M- and S-cones, respectively.
Fig 2. Degrees of severity of color vision deficiency and its subtypes.
Contour Enhancement Algorithm for Improving
Visual Perception of Deutan and Protan Dichromats
M. Madalena G. Ribeiro
1,2, Abel J.P. Gomes
3,4*
1
Polytechnic Institute of Castelo Branco, ESART, 6000-084 Castelo Branco (Portugal)
2
Centro de Investigação em Património, Educação e Cultura, 6000-084 Castelo Branco (Portugal)
3Universidade da Beira Interior, 6200-001 Covilhã (Portugal)
4
Instituto de Telecomunicações, Delegação da Covilhã, 6200-001 Covilhã (Portugal)
Received 3 May 2019 | Accepted 21 May 2019 | Published 27 May 2019
Keywords
Image Color Analysis, Color Vision Deficiency, Dichromacy, Image Naturalness, Contour Enhancement, CVD Adaptation.
Abstract
A variety of recoloring methods has been proposed in the literature to remedy the problem of confusing red-green colors faced by dichromat people (as well by other color-blinded people). The common strategy to mitigate this problem is to remap colors to other colors. But, it is clear this does not guarantee neither the necessary contrast to distinguish the elements of an image, nor the naturalness of colors learnt from past experience of each individual. In other words, the individual’s perceptual learning may not hold under color remapping. With this in mind, we introduce the first algorithm primarily focused on the enhancement of object contours in still images, instead of recoloring the pixels of the regions bounded by such contours. This is particularly adequate to increase contrast in images where we find adjacent regions that are color-indistinguishable from the dichromacy’s point of view.
* Corresponding author.
E-mail addresses: [email protected] (M. Madalena G. Ribeiro), [email protected] (Abel J.P. Gomes).
In the present work, the research focus is on dichromacy, specifically deuteranopy and protanopy. As shown in Fig. 1, the deutan and protan dichromat individuals only see blues and yellows, while the tritan see bluish cyans and reds. More specifically, deutan/protan dichromats only see two different hues, considering the HSV (Hue, Saturation, and Value) color wheel depicted in Fig. 1: 60◦- yellow and 240◦-blue. That is, all the colors Fig. 1(b)-(c) seen by deutan and protan dichromats just result from varying saturation and brightness. Analogously, the tritan dichromats only see two hues, 0◦-red and 180◦-cyan, as the remaining colors observed in Fig. 1(d) are obtained from either 0◦-red or 180◦-cyan with varying values of saturation and brightness. These results were achieved using the simulation algorithm due to Viennot et al. [5]. Note that the dichromacy corresponds to anomalous trichromacy with a 100% of severity [6].
B. Related Work
Currently, most color adaptation algorithms are based on color mapping, i.e., they map some colors onto other colors, as it the case of the following algorithms due to Martin et al. [7], Ichikawa et al. [8], Rasche et al. [9], Iaccarino et al. [10], Huang et al. [11], Kuhn et al.
[12], Doliotis et al. [13], Wang et al. [14], Chen et al. [15], and Ribeiro and Gomes [16][17]. However, in general, these algorithms tend to recoloring most pixels of an image, causing loss of naturalness of color as perceived by dichromat people [Ichikawa et al. 2003] [Wakita and Shimamura 2005] [Huang et al. 2007] [Kuhn et al. 2008] [Flatla et al. 2013], though the resulting contrast is more noticeable after all. But, this may have negative implications on the perceptual learning of CVD people, possibly causing more perceptual confusion in many cases. These naturalness- and contrast-related problems have led to the investigation of alternative color identification algorithms, called content-independent methods [18][19], which overlay patterns (e.g., color names and meters) on colored visualization contents. But, clearly, these techniques have the downside of causing noise in the color perception, though they minimize ambiguities in color identification.
In this paper, we follow a distinct approach, which consists in enhancing the contours (not the interiors) of image regions featuring objects. As far as we know, this is the first contour-based adaptation algorithm for minimizing ambiguities if color perception of CVD people. As shown in paper, this allows for increasing the contrast without compromising the naturalness of imaging. In addition, this allows CVD people to see more objects than they see normally.
C. Contributions
The idea of the adaptation algorithm proposed in this paper is to increase the contrast of neighbor pixels that are indistinguishable for dichromat people, but at the same time to maintain the naturalness of color as much as possible. Color contrast is obtained by increasing the perceptual difference between neighboring regions of a given image. For that purpose, the interior of each region remains unchanged, being the contrast increased by lightening or darkening its region contours. As far as we are aware, there is no similar contour-based algorithm in the literature.
D. Organization Paper
The remainder of this paper is organized as follows. Section II describes our contour enhancement method. Section III presents the most relevant results about our algorithm with respect to the evaluation parameters: contrast and naturalness. Section IV describes our study of usability. Section V draws the most important conclusions about our work.
II. Contour Enhancement
The individuals with dichromacy see only two distinct hues; more specifically, blues and yellows for deutan and protan dichromats, and
reds and greenish blue for tritan dichromats, although with different values of saturation and brightness. For example, a deutan dichromat perceives a weakly saturated yellow as a moss green. The reduced chromatic range as perceived by dichromat people may lead to lack of discrimination between neighbor regions in an image, resulting in confusion about what is being seen in the image.
To mitigate this problem, we propose an approach that enhances contours between adjacent image regions, which are indistinguishable for dichromat individuals. The idea is to highlight the contours that separate contiguous regions represented with different colors, but seen as similar or identical by dichromat people.
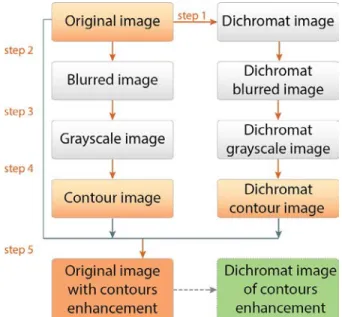
Fig 3. Diagram of the contour enhancement algorithm (CEA). This contour enhancement procedure is illustrated in Figs. 3 and 4, and comprises the following steps:
1. Generate the image as seen by (deutan and protan) dichromat individuals from the original image.
2. Apply a Gaussian blur filter to both original and dichromat images. 3. Convert both original and dichromat images to grayscale. 4. Compute contours in both original and dichromat images. 5. Highlight those contours of the original image that are absent in
the respective dichromat image.
A. Dichromat Image Generation
Taking the original image as input data, the first step of our algorithm consists in generating the corresponding image as seen by a dichromat individual. This is accomplished using the simulation algorithm due to Vienot et al. [5].
Essentially, this algorithm comprises three steps: (i) the RGB LMS conversion [20][21]; (ii) the dichromat simulation (e.g. deuteranope) in the LMS color space, as proposed by Vienot et al. [5]; (iii) the LMS-RGB conversion. Each step is associated to a specific matrix, so the entire process reduces to a product of three matrices, resulting in the following overall matrix:
(1)
Summing up, we generate the image as seen by a dichromat individual by multiplying the matrix M above by the vector [R G B]T associated to each pixel. This step may be adjusted to any sort of CVD using a distinct overall simulation matrix M.(a) Original image (b) Dichromat image
(c) Blurred image (d) Dichromat blurred image
(e) Grayscale image (f) Dichromat grayscale image
(g) Contour image (h) Dichromat contour image
(i) Original image with enhanced contours
(j) Dichromat view of image with enhanced contours Fig 4. The contour enhancement process applied to a hibiscus flower. Interestingly, as shown in Figs. 4(a)-(b), a deutan dichromat person cannot see the hibiscus flower at all, because he/she cannot distinguish the green background from the red flower.
B. Gaussian Blur Filter
Both images, the original image and dichromat image, are subject to a noise reducing procedure through a Gaussian blur filter (see [22] for
further details). This is a pre- processing step, and is performed using the Gaussian 3 × 3 kernel matrix:
(2)
This matrix corresponds to a Gaussian kernel of width of 1. Recall that this sort of image-blurring filters is commonly used in image analysis and processing, particularly when they coupled with contour detectors, which are sensitive to noise.C. Grayscale Conversion
The conversion to a grayscale representation is performed by computing the luminance of each pixel [23], in conformity with the following expression:
I
= 0.2989
R+ 0.5866
G+ 0.1145
B(3)
where, R, G and B are color components of the pixel. This conversion is justified by the fact that the human eye can perceive brightness changes better than color changes [22]. This fact is not only valid for trichromat, but also for dichromat people. Figs. 4(e) and (f) show the images that result from converting the images in Figs. 4(c) and (d) to grayscale, respectively.D. Contour Detection
The core of our method lies in the detection of contours of regions within the grayscale images of both original and dichromat images. Its leading idea is to identify contours (or part of them) in the grayscale original image that do not exist in grayscale dichromat image. This is illustrated in Figs. 4(e) and (f), where the contours of the flower are completely absent in the grayscale dichromat image (Fig. 4(f)). This is because a deutan dichromat individual cannot perceive the difference between the green background from the red flower at all.
Such contours are determined by applying the Sobel gradient masks in the x and y directions to each pixel [22]. As a result, we obtain two Sobelized images Gx and Gy in the x and y directions, respectively, which are then merged into a Sobelized image through the following expression:
(4)
Note that this process must be applied to both grayscale counterparts (Figs. 4(e) and (f)) of the original image and dichromat image. The resulting images are shown in Figs. 4(g) and (h).E. Contour Highlighting
The contour enhancement step in subtracting the contours of the grayscale dichromat image to those contours of the grayscale original image. In this way, we obtain the missing contours in the dichromat image, which are then highlighted with more or less luminance, depending on the current luminance of each pixel in the dichromat image, as illustrated in Figs. 4(i) and (j).
III. Results
To our best knowledge, CEA is the first contour-based color adaptation algorithm for CVD people. However, our testing was focused exclusively only on deutan and protan dichromat people, largely because their color perception is quite similar, in addition to the fact that deuteranopy and protanopy are the most common types of dichromacy we find in world male population.
A. Setup
(a) (b)
(c) (d)
Fig 7. Recycling sign as seen by: (a) a trichromat individual; (b) a deutan dichromat person; (c) a trichromat person after CEA adaptation; (d) a deutan dichromat person after CEA adaptation.
(a) (b)
(c) (d)
Fig 6. Nameplate of danger as seen by: (a) a trichromat individual; (b) a deutan dichromat individual; (c) a trichromat individual after CEA adaptation; (d) a deutan dichromat individual after CEA adaptation.
(a) (b)
(c) (d)
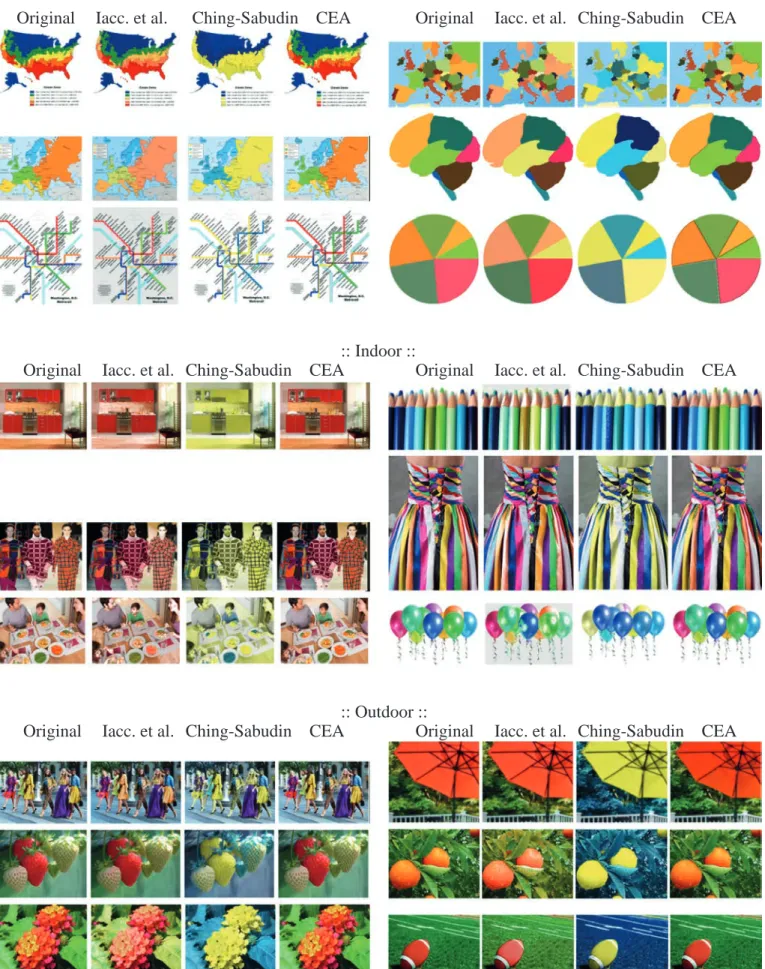
Fig 5. Europe map: (a) original image as seen by a trichromat individual; (b) original image as seen by a deutan deuteranope individual; (c) image as seen by a trichromat individual after adaptation through the CEA method; (d) image as seen by a deutan deuteranope individual after adaptation through the CEA method.
equipped with an Intel Core i7-4750HQ CPU 2.0GHz, with 8GB RAM. CEA algorithm and its competitors (Ching-Sabudin method [24] and Iaccarino et al.’s method [10]) were coded in Javascript programming language for HTML5 web compliant browsers, including Firefox and Chrome. Note that we also implemented in Javascript the Vienot et al.’s algorithm [5] which simulates how deuteranope people see colors, and yet an algorithm to count regions in images.
Those two competitor algorithms (Ching-Sabudin method and Iaccarino et al.’s method) were chosen because they also apply to deutan and protan dichromat people. Besides, these algorithms have the further advantage of their codes are publicly available.
In methodological terms, as explained further below, we used three metrics to evaluate the efficiency of CEA algorithm: perceived region rate (ρ), naturalness (ν), and contrast (C).
B. Perceived Region Rate
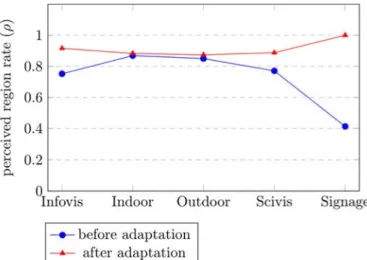
By definition, the perceived region rate (ρ) is the ratio of the number of regions (or objects) seen by the CVD individual to the number of regions as seen by a trichromat individual. For example, the image depicted in Fig. 7(a) has 7 regions seen by a trichromat individual, but the same image as seen by a deutan dichromat individual has only one region; therefore, the value of ρ = 1/7. That is, there are 6 out of 7 regions that not seen by the deutan dichromat individual. But, after applying our CEA algorithm, every single deutan dichromat person could see those 6 unseen regions. This was accomplished without changing the color of pixels inside each region; only region contour pixels were changed where needed to avoid color confusion. This made it possible to distinguish between Spain and France in Fig. 5 along their common border.
Fig 8. Perceived region rate for five categories of images before (in blue) and after (in red) adaptation through CEA.
In Fig. 8, we show the overall results for perceived region rate in respect to a dataset of 100 images divided into five categories, namely: infovis (information visualization), indoor, outdoor, scivis (scientific visualization), and signage. Examples of these images are shown in Figs. 9-10 further ahead. As observed from Fig. 8, the perceived region rate of our algorithm has significant gains for infovis-, scivis-, and signage-type images, when compared to the corresponding images as seen by deutan and protan dichromats before adaptation. That is, these CVD people see more image regions after adaptation than before adaptation, resulting in an increasing of their visual perception.
C. Contrast
In the literature, there are various ways for contrast measuring of images. Our contrast metric C is based on Squared Laplacian [25], and is as follows:
(5)
being G (x, y) given by:(6)
where I (x, y) is the value of the intensity of the pixel at position (x, y). W and H are the width and height of the image.For the computation of the pixel intensity, we use the formula from Eq. 7, derived from by Poynton [23]:
(7)
After applying the simulation algorithm for deuteranopes described in [5], the mean average value of the contrast of the original dataset as seen by deuteranope people was = 0.0418. After applying our contour enhancement procedure, the average contrast increased to = 0.054, representing a gain of 28.5%. In respect to Iaccarino et al.’s method [10], the average contrast for the same dataset of 100 images was = 0.0417, so there was no gain in contrast. Finally, we obtained an average contrast of about 0.047 for Ching-Sabudin method [24], featuring an increase of 12.4% relative to the average contrast before the color adaptation process.Notice that the contrast computation is achieved only after the deuteranope view simulation (which comes after the contour enhancement), since our goal is to improve the perception of images for deutan and protan dichromat people.
D. Naturalness
According to Flatla et al. [26], the color naturalness of an image can be expressed as follows:
(8)
where W × H denotes the image resolution, Pi is the color of the i-th pixel, and is the color of this pixel after the color adaptation, while ∆(Pi , ) denotes the color difference between Pi and in conformity with the CIE76 color-difference formula expressed in CIE Lab space coordinates given by(9)
where (Li, ai, bi) and ( , , ,) represent the Lab colors of Pi and , respectively. The smaller the value of ν, more natural is the re-coloring procedure of each image.Considering the reference dataset of 100 still images, we achieved an average value for the naturalness of about ν = 2.0 for deuteranope people. For the methods in comparison, Iaccarino et al. [10] and Ching and Sabudin [24], we got the naturalness scores of ν = 8.6 and
ν = 20.76, respectively. These values are expectable, since our
method only changes the contour pixels, not interior pixels of regions; Iacarinno’s et al.’s method changes colors to close colors, while Ching-Sabudin method changes colors to far away colors. Summing up, CEA method outperforms those two competitor algorithms in respect to color naturalness maintenance.
IV. Subjective Evaluation
To assess the CEA algorithm in the perceptual augmentation of CVD users, we carried a statistical study based on a questionnaire as described below.
A. The Universe of CVD People
The subjective evaluation involved 13 CVD male volunteers. Initially, they performed the D-15 Color Arrangement Test [27] for a more accurate characterization of the universe of CVD users. The following results were obtained: 2 people with strong protanomaly (ages 32 and 49), 1 person with moderate protanomaly (age 27), 5 people with strong deuteranomaly (ages 49, 51, 57 and 69), 4 people with moderate deuteranomaly (ages 17, 21, 26 and 46), and 1 person with deuteranopy (age 35). In spite of the fact that the CEA algorithm has been designed for deuteranope and protanope people, we also considered deuteranomalous and protanomalous people in our study because of their high degree of CVD severity, i.e., they see in a similar way to deutan and protan dichromats [28].
B. The Questionnaire
Methodology
Unlike most color adaption usability studies based on questionnaires
[11] [12], we have not adopted the Law of Comparative Judgment (LCJ) of L.L.Thurstone [29], because this law only allows us to compare two alternatives or algorithms. In our study, we compare four alternatives: the original image without color adaptation (WCA), Iaccarino et al.’s method [10], Ching-Sabudin method [24], and our CEA method. Consequently, we decided to use descriptive statistics techniques [30] [31], particularly the following metrics: arithmetic mean (x), standard deviation (σ), and coefficient of variation (υ = σ/ x), also called relative standard deviation. For each questionnaire image, those four alternatives are presented randomly to each CVD individual to not influence the choice of the respondents somehow.
Dataset of images
In our subjective evaluation study, we considered five categories of images (see Figs. 9 and 10): InfoVis, concerning visualization of information; Indoor, concerning indoor scenes, Outdoor, concerning outdoor scenes, SciVis, concerning scientific visualization; and Signage, concerning traffic and warning signs. More specifically, we selected six images by category, in a total of thirty images. Therefore, each CVD individual had to score thirty images times four alternatives in a total of thirty images. Therefore, each CVD individual had to score thirty images times four alternatives, in a total of 120 images; the scores were thus 1 (highest score), 2, 3, and 4 (lowest score).
It is worth noting that the dataset of images was selected in conformity with the principles of representativeness and diversity suggested by Shaffer and Zhang [31]) to reduce the sampling error and, consequently, getting a significant statistical confidence interval.
Implementation
For the implementation of the questionnaire available at http://cea. ipcb.pt/, we used the Google Forms from the Google Docs application package to collect data from each CVD individual. Basically, the questionnaire consists of six web pages, one page per category of images. These images are disposed in the questionnaire in the same order as they are in Figs. 9 and 10.
In the questionnaire, each CVD volunteer expresses his/her satisfaction degree (or preference) by scoring the four alternatives of each image, regarding the discrimination of the contents (contrast) and naturalness. Scoring is performed using a (discrete) qualitative ordinal scale, from the more (highest score 1) to less (lowest score 4) preferred alternative. Note that this scoring scale is adequate up to five items [32][33].
Validation
For the validation of the questionnaire, we benefited from the contribution of 2 statisticians and 2 CVD researchers. The statistics experts were important to adopt descriptive statistics techniques, as adequate for multiple options up to 5, as well as to design the questionnaire itself. In respect to CVD researchers, one of whom is also a dichromat individual, they played an important role in the formulation of the questions focused on color contrast and naturalness, as selected for the questionnaire.
C. Data Scoring and Collecting
Fig. 11 shows the raw quantitative results obtained from the questionnaire. These results express the CVD people’s preferences relative to five image categories depicted in Figs. 9 and 10, namely: InfoVis, Indoor, Outdoor, SciVis, and Signage. Recalling that we have 6 images per category and a universe of 13 respondents, we see the data sample consists of 78 responses (= 6 × 13) per category; for example, considering the CEA method, the data sample for the SciVis category (see Fig. 11(d)), comprises 1 response with score 1, 16 responses with score 2, 22 responses with score 3, and 18 responses with score 4. Summing the number of responses for any other method, we always obtain 78 responses with the scores ranging in [1, 4]. Thus, the number of scores is equal to the number of methods under analysis.
D. Data Analysis
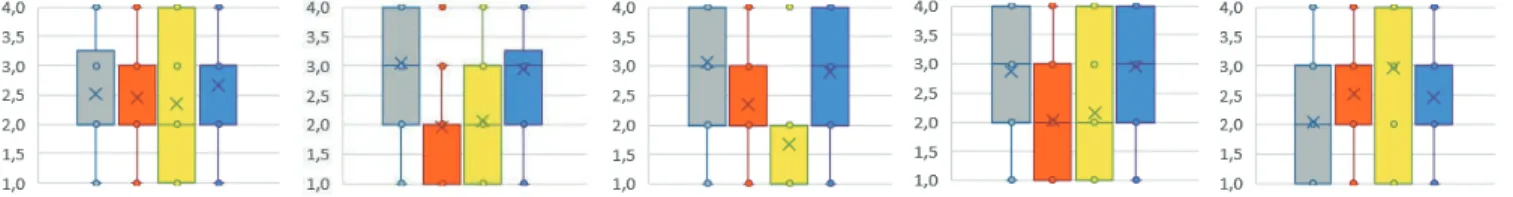
We based data analysis on two descriptive statistical tools: (i) box-and-whisker diagrams (see Fig. 12); (ii) coefficient of variation (see Table I). Such diagrams and statistical data were produced from raw data presented in Fig. 11. The box-and-whisker diagrams constitute a visual tool that helps us to observe the distribution of preferences of CVD respondents radidly [34]. As its name says, a box-and-whisker diagram has one box and two box-and-whiskers (see Fig. 12). The box represents the consensus of preferences and includes at least 50% of the preferences of each method. More specifically, such box represents the preferences of the second and third quartiles, which are put apart through the median (cf. horizontal straight-line segment inside the box. The arithmetic mean shows off as a cross inside the box.
On the other hand, the coefficient of variation (CV, for brevity) measures the dispersion/concentration of the distribution of such preferences [30], as shown in Table I. Recall that the coefficient of variation υ is given by the ratio x/σ, where x stands for the mean, and σ the standard deviation. Sometimes, the coefficient of variation is also called relative standard deviation.
Therefore, a brief glance at Figs. 11 and 12 and statistical data listed in Table I shows us the following:
• Infovis: When compared to other methods, CEA method is the one with the highest mean (2.67). Furthermore, it presents the lowest coefficient of variation (36%). So, in respect to infovis-type images, CEA method clearly performs better than any other testing method, including the WA approach.
• Indoor: Taking into consideration the diagram (b) in Fig. 12, we again see that both WA and CEA methods are clearly better than the other two methods, but their arithmetic means are similar, 3.04 and 2.94, respectively. Despite its higher dispersion (31%) face to the CEA method (26%), the WA method tends to count with higher scores (31 out of 78 preferences with score 4) than CEA method. Therefore, the WA method ranks first for the indoor-type images. • Outdoor: In respect to outdoor-type images, the WA alternative
reaches the higher mean (3.06) and the smaller dispersion (29%), so it ranks first for the outdoor-type images. Thus, the best color adaptation method for outdoor-type images seems to be not using any recoloring procedure at all.
:: InfoVis ::
Original
Iacc. et al. Ching-Sabudin CEA
Original
Iacc. et al. Ching-Sabudin CEA
:: Indoor ::
Original
Iacc. et al. Ching-Sabudin CEA
Original
Iacc. et al. Ching-Sabudin CEA
:: Outdoor ::
Original
Iacc. et al. Ching-Sabudin CEA
Original
Iacc. et al. Ching-Sabudin CEA
:: SciVis ::
Original
Iacc. et al. Ching-Sabudin CEA
Original
Iacc. et al. Ching-Sabudin CEA
:: Signage ::
Original
Iacc. et al. Ching-Sabudin CEA
Original
Iacc. et al. Ching-Sabudin CEA
Fig 10. Thumbnails of scivis- and signage-type images used in the usability test.
(a)
(b)
(c)
(d)
(e)
• SciVis: Regarding scivis-type images, the best adaptation method is the CEA method, since it has the higher mean (2.96) and the smaller dispersion (27%), i.e., it is more consensual than any other method.
• Signage: Ching-Sabudin method ranks first in this image category because it has the higher mean (2.97), despite its high coefficient of variation (45%). In fact, the coefficient of variation is not relevant in this case because most scores (46 out of 78) accumulate at bin 4. Note that the CEA method is also a good solution for signage-type images because it also allows for the identification of unseen image regions, as shown in Fig. 8.
Summing up, CEA method seems to be better than WA method in three categories of images, namely infovis-, scivis- and signage-type images. Regarding indoor- and outdoor-type images, the best option is to leave them as they are, i.e., the WA method, according which there is no need performing any computational recoloring procedure. These results agree with those shown in Fig. 8.
Recalling that it is too difficult to find CVD people who could collaborate in the kind of studies, most of published works in this area carried out the assessment without the opinion of this audience, or involving only a group with a small number of people. However, this constitutes a limitation in the results achieved and in the drawn conclusions, as with our study.
TABLE I. Statistical Results
category metric WA Iaccarino
et al. Ching-Sabudin CEA InfoVis x 2.51 2.49 2.36 2.67 σ 1.090 0.989 1.386 0.963 υ 43% 40% 59% 36% Indoor x 3.04 1.96 2.06 2.94 σ 0.946 1.038 1.231 0.779 υ 31% 53% 60% 26% Outdoor x 3.06 2.36 1.68 2.90 σ 0.873 0.911 1.211 0.906 υ 29% 39% 67% 31% SciVis x 2.87 2.04 2.15 2.96 σ 0.958 1.145 1.228 0.813 υ 33% 56% 57% 27% Signage x 2.04 2.53 2.97 2.46 σ 1.133 0.768 1.348 0.963 υ 56% 30% 45% 39% Statistical metrics:
x: arithmetic mean; σ: standard deviation; υ: coefficient of variation.
V. Conclusions
In contrast to the state-of-the-art of the color adaptation methods, which use a pixel-wise recoloring procedure in an attempt of improving the color perception of deutan and protan dichromats, the focus of the CEA method is on the detection and highlighting of region contours where necessary, so the region interiors are left untouched. In other
words, the CEA method is contour-wise recoloring procedure. Thus, the CEA method is a disruptive technique when compared to the current state-of-the-art of color adaptation methods. This opens new perspectives for a new family of color adaptation methods based on image analysis and processing.
In fact, to discriminate between confusing neighbor regions of a given image, we have introduced a contour highlighting or enhancement algorithm that increases the image contrast, while keeping the naturalness of image color, since there are no color changes in the region interiors and most contours do not need to be highlighted. Consequently, deutan and protan dichromats can see more images regions than usual, i.e., their image perception increases to a rate close to trichromats’ perception, but without disturbing their perceptual learning about the surrounding world.
Acknowledgment
The authors would like to thank to Carla S. Pedro, Isabel Castanheira and Paulo Silveira for their support in statistical analysis of usability questionnaire, Marco Bernardo and Vasco Almeida for their criticism relative to color adaption techniques, as well as CVD participants for their help and time to answer the usability questionnaire.
This research has been partially supported by the Portuguese ResearchCouncil (Fundação para a Ciência e Tecnologia), under the FCT Project UID/EEA/50008/2019.
References
[1] I. Paterson, A Dictionary of Colour. London: Thorogood Publishing Ltd., 2003.
[2] H. K. Kolb, E. F. Fernandez, and R. N. Nelson, WebVision: The Organization of the Retina and Visual System. John Moran Eye Center, University of Utah, 2011.
[3] J. Birch, Diagnosis of Defective Colour Vision, 2nd ed. Edimburgh: Elsevier Science, 2001.
[4] B. J. Case, “Color blindness,” Pearson Education, Tech. Rep., 2003. [5] F. Vienot, H. Brettel, and J. D. Mollon, “Digital video colourmaps for
checking the legibility of displays by dichromats,” Color Research and Application, vol. 24, no. 4, pp. 243–252, 1999.
[6] S. Yang and Y. M. Ro, “MPEG-21 digital item adaptation for color vision deficiency,” in Proceedings of the 2003 International Workshop on Advanced Image Technology (IWAIT’03), Nagasaki, Japan, January 21-22, 2003.
[7] C. Martin, S. Rogers, and M. Kabrisky, “Digital production of color mach bands using a color human visual system model,” IEEE Transactions on Systems, Man and Cybernetics, Part A: Systems and Humans, vol. 28, no. 1, pp. 127–130, 1998.
[8] M. Ichikawa, K. Tanaka, S. Kondo, K. Hiroshima, K. Ichikawa, S. Tanabe, and K. Fukami, “Preliminary study on color modification for still images to realize barrier-free color vision,” in Proceedings of the 2004 IEEE International Conference on Systems, Man and Cybernetics, vol. 1. IEEE Press, 2004, pp. 36–41.
[9] K. Rasche, R. Geist, and J.Westall, “Detail preserving reproduction of color images for monochromats and dichromats,” Computer Graphics and Applications, IEEE, vol. 25, no. 3, pp. 22–30, 2005.
[10] G. Iaccarino, D. Malandrino, M. Del Percio, and V. Scarano, “Efficient edge-services for colorblind users,” in Proceedings of the 15th International Fig 12. Box-and-whisker diagrams of the distribution of preferences per category: (a) infovis; (b) indoor; (c) outdoor; (d) scivis; and (e) signage. The mean is represented by a cross, while the median is represented by a horizontal line.
Conference on World Wide Web (WWW’06), Edinburgh, Scotland, May 23-26. ACM Press, 2006, pp. 919–920.
[11] J.-B. Huang, Y.-C. Tseng, S.-I. Wu, and S.-J. Wang, “Information preserving color transformation for protanopia and deuteranopia,” IEEE Signal Processing Letters, vol. 14, no. 10, pp. 711–714, 2007.
[12] G. Kuhn, M. Oliveira, and L. Fernandes, “An efficient naturalness preserving image-recoloring method for dichromats,” IEEE Transactions on Visualization and Computer Graphics, vol. 14, no. 6, pp. 1747–1754, 2008.
[13] P. Doliotis, G. Tsekouras, C.-N. Anagnostopoulos, and V. Athitsos, “Intelligent modification of colors in digitized paintings for enhancing the visual perception of color-blind viewers,” ser. IFIP Advances in Information and Communication Technology, I. Iliadis, M. Maglogiann, T. Tsoumakasis, V. Vlahavas, and B. Bramer, Eds. Springer Boston, 2009, vol. 296, pp. 293–301.
[14] M. Wang, B. Liu, and X.-S. Hua, “Accessible image search for colorblindness,” ACM Transactions on Intelligent Systems and Technology, vol. 1, no. 1, pp. 8:1–8:26, October 2010.
[15] W. Chen, W. Chen, and H. Bao, “An efficient direct volume rendering approach for dichromats,” IEEE Transactions on Visualization and Computer Graphics, vol. 17, no. 12, pp. 2144–2152, 2011.
[16] M. M. Ribeiro and A. J. Gomes, “A skillet-based recoloring algorithm for dichromats,” in Proceedings of the 15th IEEE International Conference on e-Health Networking, Applications & Services (Healthcom’ 13), Lisbon, Portugal, October 9-12. IEEE Press, 2013, pp. 702–706.
[17] “Creating accessibility to web contents for colorblind people,” in Proceedings of the 5th International Conference on Applied Human Factors and Ergonomics (AHFE’14), Krakow, Poland, July 19-23, P. Arezes and P. Carvalho, Eds., vol. 10. AHFE Press, 2014, pp. 646–656. [18] B. Sajadi, A. Majumder, M. M. Oliveira, R. G. Schneider, and R. Raskar,
“Using patterns to encode color information for dichromats,” IEEE Transactions on Visualization and Computer Graphics, vol. 19, no. 1, pp. 118–129, 2013.
[19] D. R. Flatla, A. R. Andrade, R. D. Teviotdale, D. L. Knowles, and C. Stewart, “ColourID: Improving colour identification for people with impaired colour vision,” in Proceedings of the 33rd Annual ACM Conference on Human Factors in Computing Systems (CHI’15), Seoul, Republic of Korea, April 18-23. ACM Press, 2015, pp. 3543– 3552. [20] V. Smith and J. Pokorny, “Spectral sensitivity of the foveal cone
photopigments between 400 and 500 nm,” Vision Research, vol. 15, no. 2, pp. 161–171, 1975.
[21] D. Travis, Effective Color Displays: Theory and Practice. London: Academic Press, 1991.
[22] R. Gonzalez and R. Woods, Digital Image Processing, 3rd ed. Pearson, Prentice Hall, 2007.
[23] C. Poynton, Digital Video and HDTV: Algorithms and Interfaces. The Morgan Kaufmann Series in Computer Graphics. Morgan Kaufmann Publishers, 2003.
[24] S.-L. Ching and M. Sabudin, “Website image colour transformation for the colour blind,” in Proceedings of the 2nd International Conference on Computer Technology and Development (ICCTD’10), Cairo, Egypt, November 2-4. IEEE Press, 2010, pp. 255–259.
[25] X. Xu, Y. Wang, J. Tang, X. Zhang, and X. Liu, “Robust automatic focus algorithm for low contrast images using a new contrast measure,” Sensors, vol. 11, no. 9, pp. 8281–8294, 2011.
[26] D. R. Flatla, K. Reinecke, C. Gutwin, and K. Z. Gajos, “SPRWeb: preserving subjective responses to website colour schemes through automatic recolouring,” in Proceedings of the ACM Conference on Human Factors in Computing Systems (CHI’13), Paris, France, April 27 - May 02. ACM Press, 2013, pp. 2069–2078.
[27] A. J. Vingrys and P. E. King-Smith, “A quantitative scoring technique for panel tests of color vision,” Investigative Ophthalmology & Visual Science, vol. 29, no. 1, pp. 50–63, January 1988.
[28] L. Sharpe, A. Stockman, H. Jagle, and J. Nathans, “Opsin genes, cone photopigments, color vision and color blindness,” in Color Vision, K. Gegenfurtner and L. Sharpe, Eds. New York: Cambridge University Press, 1999.
[29] L. Thurstone, “A law of comparative judgment,” Psychological Review, vol. 34, no. 4, pp. 273–286, 1927.
[30] J. W. Tukey, Exploratory Data Analysis. Addison-Wesley, 1977.
[31] D. Shafer and Z. Zhang, Introductory Statistics. Saylor Foundation, 2012. [32] R. Taplin, “The statistical analysis of preference data,” Applied Statistics,
vol. 46, no. 4, pp. 493–512, 1979.
[33] S. Abeyasekera, “Analysis approaches in participatory work involving ranks or scores,” Statistical Services Centre, The University of Reading, and Natural Resources Institute, United Kingdom, Tech. Rep., August 2000.
[34] K. Potter, “Methods for presenting statistical information: The box plot,” in Visualization of Large and Unstructured Data Sets, ser. Lecture Notes in Informatics, H. Hagen, A. Kerren, and P. Dannenmann, Eds. Gesellshaft fur Informatik, 2006, vol. S-4, pp. 97–106.
M. Madalena G. Ribeiro
M. Madalena G. Ribeiro reached her PhD in Computer Science at the University of Beira Interior, Covilhã, Portugal, in 2017, a Master’s degree in Electrical Engineering and Computers at the Instituto Superior Técnico – University of Lisboa, Lisbon, Portugal, in 2001 and a degree in Mathematics (with Computer Graphics majors) at the University of Coimbra, Coimbra, Portugal, in 1994, having completed the final project as Erasmus student at the Fraunhofer Institute for Computer Graphics Research, in Darmstadt (Germany). She is professor at the School of Applied Arts at the Polytechnic Institute of Castelo Branco (Portugal) since 2005, after 10 years in the Superior School of Technologies (in the same Polytechnic). teaching subjects in the areas of Web design, UI and UX and Programming Languages. Prof. Madalena Ribeiro was collaborator in the Instituto de Telecomunicações (IT) for several years and currently she is an integrated member of the Centro de Investigação em Património, Educação e Cultura (CIPEC) since January’2018, being a founding member. Her expertise is focused in the Human-Computer Interaction (HCI) area. Interface design, usability, user experience, accessibility, color, image processing, web design and development and augmented reality are research interests.
Abel J. P. Gomes
Abel J. P. Gomes is an Associate Professor in Computer Graphics at the University of Beira Interior, Portugal. He obtained a PhD degree in geometric modeling at Brunel University, England, in 2000. He has over 100 publications, including journal and conference articles, and 1 book published by Springer-Verlag. He was Head of the Department of Computer Science and Engineering, University of Beira Interior, Portugal, and the leader of a research unit of Instituto de Telecomunicações, which is one of the biggest research centers in Portugal. He is also a licensed Professional Engineer and member of the IEEE, ACM, and Eurographics. His current research interests include color accessibility, computer graphics algorithms, molecular graphics, geometric computing, and implicit curves and surfaces.