Patrícia Concórdio dos Reis
Licenciada em Bioquímica
Optimization of FucoPol bioreactor
production and exopolysaccharide
applications
Dissertação para obtenção do Grau de Mestre em Biotecnologia
Orientador: Doutora Maria Filomena Andrade de Freitas,
Senior Researcher, FCT-UNL
iii
Patrícia Concórdio dos Reis
Licenciada em Bioquímica
Optimization of FucoPol bioreactor production and
exopolysaccharide applications
Dissertação para obtenção do Grau de Mestre em Biotecnologia
Orientadora: Doutora Maria Filomena Andrade de Freitas
v
Optimization of FucoPol bioreactor production and exopolysaccharide
applications
Copyright © Patrícia Concórdio dos Reis, Faculdade de Ciências e Tecnologia, Universidade Nova de Lisboa.
vii
Acknowledgements
This work marks the end of a journey, one of the most challenging of my life, that I could never gone through without the support of so many. To them, I’m extremely thankful.
I would like to express my sincere gratitude to my thesis advisor, Dr. Filomena Freitas, for sharing her expertise and for all the patience, guidance and wise advises, without which I would never be able to accomplish this achievement.
I would also like to thank both Dr. Filomena Freitas and Dr. Ascensão Reis for providing me the necessary tools to perform this research work and, most of all, for giving me the opportunity to work with such an amazing team. I am really grateful for the friendly welcoming that I received by all BIOENG members but, specially, by my lab co-workers. Diana Araújo, Sílvia Baptista, Inês Farinha, Sílvia Antunes and Cristiana Torres, I would like to thank you for integrating me, for the assistance, the stimulating discussions and helpful advises that you provide during this year, and for the great work environment. My gratefulness also goes to my thesis colleagues, Sofia Pereira, João Pereira and Joana Marques, for helping me in the daily basis, for the friendship and fun moments that we shared.
I would like to recognize the support of those who entered this journey with me, my university friends, specially Joana Pinto, Marisa Ferreira, Catarina Lopes and Sara Conceição. Together we shared the work, the frustrations, the knowledge, the difficulties and some of the greatest moments of this academic adventure.
ix
Palavras-chave
FucoPol, exopolissacárido, Enterobacter A47, impacto do fósforo, atividade biofloculante, bioadsorção de metais pesados.
Resumo
O FucoPol é um exopolisacárido (EPS) produzido pela bactéria Enterobacter A47, composto por açúcares (fucose, galactose, glucose e ácido glucurónico) e grupos acilo (sucinato, piruvato e acetato), e possui um peso elevado molecular de (>106 Da).
O primeiro objetivo desta tese foi investigar o efeito da concentração de fósforo (P) na produção deste polissacárido. Para tal, foram realizados ensaios de produção com diferentes concentrações deste nutriente: de 0.8 a 2.6 g.L-1 (concentração standard). As condições implementadas não afetaram o crescimento da Enterobacter A47, mas resultaram numa redução da produção de EPS: 24% menos polímero quando 2 e 1.3 g.L-1 de P foram utilizadas, e 44% para 0.8 g.L-1 de fósforo. Uma pequena redução na concentração de fósforo para 2.0 g.L-1 não surtiu efeito na composição do polímero, nem no peso molecular. Contudo, os EPS obtidos nos ensaios com menos P apresentaram menor conteúdo em fucose e eram ricos em glucose.
O segundo objetivo deste trabalho foi avaliar as propriedades floculantes do FucoPol. A taxa de floculação foi determinada utilizando uma suspensão de pó caulim (5 g.L-1) na presença de CaCl2. Pequenas quantidades de biofloculante (1 mg.L-1) apresentaram taxas de floculação superiores a 70% para valores de pH entre 3-5 e temperaturas entre 15-20 ºC. O biofloculante também se apresentou estável após ser submetido a congelamento/descongelamento e aquecimento até 100 ºC, durante 20 min.
O trabalho realizado nesta tese também teve como objetivo explorar a capacidade de o polissacárido adsorver metais pesados. O FucoPol revelou um bom desempenho na bioadsorção de cobalto, cobre e zinco. Este polímero foi excecionalmente eficiente na remoção de chumbo, pelo que este metal foi escolhido para estudos acerca do impacto de diferentes fatores, nomeadamente da concentração de EPS, da concentração inicial de Pb2+, pH e temperatura. À concentração ótima (5 mg.L-1), o FucoPol demonstrou ser capaz de adsorver até 18645 mg
metal.g -1
xi
Keywords
FucoPol, exopolysaccharide, Enterobacter A47, phosphorus impact, bioflocculant activity, heavy metal biosorption.
Abstract
FucoPol is an exopolysaccharide (EPS) produced by the bacterium Enterobacter A47, composed of sugars (fucose, galactose, glucose and glucuronic acid) and acyl groups (succinyl, pyruvyl and acetyl), and with a high average molecular weight (>106 Da).
The first main goal of this thesis was to investigate the effect of the phosphorus (P) concentration on FucoPol production. Production assays were performed under different concentrations of this nutrient: from 0.8 to 2.6 g.L-1(standard concentration). The conditions implemented did not affect Enterobacter A47 growth, but a reduction of the EPS synthesis was observed: 24% less polymer when 2 and 1.3 g.L-1 of P were used, and 44% for 0.8 g.L-1 of phosphorus. A slight reduction to 2.0 g.L-1 in the phosphorus concentration did not affect the polymer’s composition, neither the molecular weight. However, the EPS obtained from the assays with fewer P showed less fucose content and was richer in glucose.
Secondly, this thesis aimed to assess the flocculation properties of FucoPol. The flocculation rate of FucoPol was determined using a kaolin clay suspension (5 g.L-1) in the presence of CaCl
2. Flocculation rate values above 70% were achieved with a low bioflocculant dosage of 1 mg.L-1, for pH values in the range 3-5, and temperature within 15-20 ºC. The bioflocculant was also shown to be stable after freezing/thawing and heating up to 100 ºC, for 20 min.
The work performed in this thesis also had as an objective to explore the metal binding efficiency of the polysaccharide. FucoPol revealed a good performance in the biosorption of cobalt, copper and zinc. The polysaccharide was an excellent biosorbent of lead so this metal was chosen for further studies, namely the impact of EPS dosage, Pb2+ initial concentration, pH and temperature. Optimal FucoPol concentration of 5 mg.L-1 was found to uptake 18645 mg
xiii
List of Contents
1. Introduction and Motivation ... 1
1.1. Polysaccharides ... 1
1.2. Composition of Exopolysaccharides... 2
1.3. EPS: biological functions and biosynthesis ... 3
1.4. FucoPol ... 4
1.5. Motivation ... 5
2. Effect of phosphorus concentration on FucoPol production ... 7
2.1. Introduction ... 7
2.2. Materials and Methods ... 10
2.2.1. Biopolymer Production ... 10
2.2.2. Analytical techniques ... 11
2.2.3. Calculus ... 13
2.2.4. Biopolymer characterization ... 14
2.3. Results and discussion ... 15
2.3.1. Effect of phosphorus in exopolysaccharide synthesis ... 15
2.3.2. Effect of phosphorus in exopolysaccharide composition and molecular mass distribution ... 21
2.4. Conclusions ... 23
3. Evaluation of the flocculating properties of FucoPol ... 25
3.1. Introduction ... 25
3.2. Materials and Methods ... 27
3.2.1. Exopolysaccharide extraction and purification ... 27
3.2.2. Bioflocculant characterization ... 27
3.2.3. Determination of the flocculation rate ... 28
3.2.4. Flocculation rate of the culture broth and cell-free supernatant ... 28
3.2.5. Effect of different factors in the flocculation rate of FucoPol ... 29
xiv
3.3. Results and discussion ... 30
3.3.1. Bioflocculant production and characterization ... 30
3.3.2. Evaluation of the flocculation rate of Enterobacter A47 culture broth and cell-free supernatant ... 31
3.3.3. Evaluation of the flocculation rate of purified FucoPol ... 32
3.3.4. Effect of bioflocculant dosage and suspended solids content ... 35
3.3.5. Effect of pH and temperature ... 37
3.3.6. Thermal stability of the bioflocculant ... 39
3.3.7. Effect of different cations ... 40
3.4. Conclusions ... 41
4. Evaluation of FucoPol’s metal binding capacity ... 43
4.1. Introduction ... 43
4.2. Materials and Methods ... 45
4.2.1. Extraction and characterization of FucoPol ... 45
4.2.2. Evaluation of heavy metal binding capacity ... 45
4.2.3. Effect of different factors in lead removal ... 46
4.3. Results and discussion ... 47
4.3.1. FucoPol characterization ... 47
4.3.2. Removal of different heavy metals with FucoPol ... 47
4.3.3. Effect of different factors in lead removal by FucoPol ... 50
4.4. Conclusions ... 56
5. Conclusions and future work ... 57
6. References ... 59
7. Appendixes ... 69
7.1. Glycerol calibration curves ... 69
xv
List of figures
Figure 1.1 – Schematic representation of the metabolic pathways associated with the synthesis
of nucleoside sugars that are involved in the biosynthesis of exopolysaccharides in gram-negative bacteria (Suresh Kumar et al., 2007). ... 4
Figure 2.1 – Cultivation profile of Enterobacter A47 with different phosphorus concentrations: a. 2.6 g.L-1, b. 2.0 g.L-1, c. 1.3 g.L-1 and d. 0.8 g.L-1; wherein experimental results of CDW (▲), EPS (□), ammonia (◊), phosphorus (●) and glycerol (×) are represented throughout the cultivations run. The fed-batch phase was initiated after 10 h of cultivation ( ). ... 15
Figure 3.1 – Scanning electron microscopy (SEM) images of (a) Enterobacter A47 and (b)
purified FucoPol produced by Enterobacter A47. ... 30
Figure 3.2 – Flocculation rate profile of Enterobacter A47 cultivation broth and cell-free supernatant during production of FucoPol ( , Cultivation broth; , Diluted broth (1:10, v/v); , Cell-free supernatant (diluted 1:10, v/v); , FucoPol concentration) ………..………..………...……….31
Figure 3.3 – Optical density measured at 550 nm (OD550) and flocculation rate for different settling times ( , Samples of kaolin clay suspension; , Samples of kaolin clay suspension flocculated with FucoPol at a concentration of 1 mg/L; ●, flocculation rate)………33
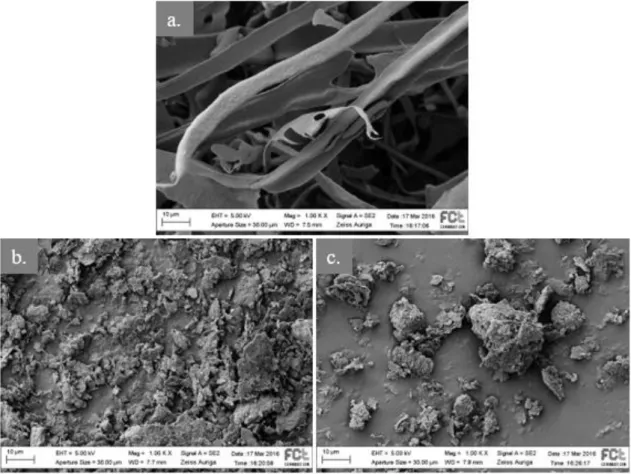
Figure 3.4 – Scanning electron micrograph of (a.) purified FucoPol (b.) kaolin clay particles and
(c.) kaolin clay particles flocculated with purified FucoPol (1 mg.L-1) produced by Enterobacter A47………...………..………...……….34
Figure 3.5 – Effect of bioflocculant dosage (a.) and suspended solids content (b.) on the
flocculation rate of kaolin clay suspensions using FucoPol as bioflocculant……….………35
Figure 3.6 – Effect of pH (a.) and temperature (b.) on the flocculation rate of kaolin
clay suspensions (5 g.L-1) using FucoPol (1 mg.L-1) as bioflocculant………37
Figure 3.7– Thermal stability of bioflocculant FucoPol………39 Figure 3.8 – Effect of different cations on flocculation rate of bioflocculant
FucoPol………..………...……….40
Figure 4.1–Removal of Zn2+(a.), Co2+(b.), Pb2+ (c.) and Cu2+ (d.) with different FucoPol
concentrations. Results are presented in terms of metal uptake (●) and metal absorbed to the biopolymer ( ). ... 48
Figure 4.2– Removal of lead with different FucoPol concentrations, for a Pb2+
concentration of 10 mg.L-1. Results presented in terms of metal uptake (●) and metal absorbed to the biopolymer ( )………...…………50
Figure 4.3 –Metal uptake of different initial lead concentrations with 5 mg.L-1 FucoPol
xvi
Figure 4.4– Effect of pH in lead uptake by FucoPol (initial Pb2+ concentration of 100
mg.L-1; EPS concentration of 5 mg.L-1; temperature 30 oC) ……….………53
Figure 4.5 – Effect of temperature in the lead uptake by FucoPol (initial Pb2+ concentration of 100 mg.L-1; EPS concentration of 5 mg.L-1; pH 4.9) ………55
Figure 7.1 – Glycerol calibration curve used in run P1 and P4. ... 69
Figure 7.2 – Glycerol calibration curve used in run P2………69
Figure 7.3 – Glycerol calibration curve used in run P3……….70
xvii
List of tables
Table 2.1 –Parameters of exopolysaccharide production by Enterobacter A47 with different phosphorus concentrations in the cultivation medium. ... 17
Table 2.2 – Physical-chemical characterization of the biopolymers produced by
Enterobacter A47 with different phosphorus concentrations in the cultivation medium. ... 21
Table 3.1 – Comparison of the flocculation rate for different bioflocculants. ... 36 Table 4.1 – Comparison of lead removal efficiency between exopolysaccharides
xix
Abbreviations
ATP Adenine triphosphate
CDW Cell Dry Weight
C/N Carbon to nitrogen ratio
DSMZ Deutsche Sammlung von Mikroorganismen und Zellkulturen GmbH
EPS Exopolysaccharide
FR
Flocculation rate
GDP Guanidine diphosphate
HPLC High performance liquid chromatography
IM Inner membrane
IR Infrared
LB Luria broth
N. A. Data not available
NDP Nucleotide diphosphate
NH4+ Ammonia
NMWCO Nominal molecular weight cut-off
OD Optical density
OM Outer membrane
P Phosphorus
PDI Polydispersity índex
Pi Inorganic phosphate
Poly P Polyphosphate
xx
PS Polysaccharide
SEC-MALLS Size Exclusion Chromatography – Multi-Angle Laser Light Scattering
SEM Scanning electron microscopy
SLPB Standard liters per minute
TFA Trifluoroacetic acid
UDP Uridine diphosphate
Variables
𝐶𝑚𝑒𝑡𝑎𝑙 Metal concentration after equilibrium (mg.L-1)
𝑑𝑃 Variation of concentration of product (g. L-1)
𝑑𝑡 Variation of time (days)
𝑀 Metal adsorbed to the polysaccharide (𝑚𝑔𝑚𝑒𝑡𝑎𝑙)
𝑚𝐸𝑃𝑆 Exopolysaccharide weight (mg)
Mn Number average molecular weight
Mw Average molecular weight
𝑞 Metal uptake (mgmetal. gEPS-1)
𝑟𝑃 Volumetric productivity (g.L-1.d-1)
𝑉 Volume (L)
Yp/S Product yield on substrate (g.g-1)
𝛥𝑝 Product produced (gEPS)
Optimization of FucoPol bioreactor production and exopolysaccharide applications 1
1.
Introduction and Motivation
1.1.
Polysaccharides
Polysaccharides are widely used in several growing industries, such as the pharmaceutical, cosmetic, food and paper industries, as well as in oil recovery and water treatment processes (Alves et al., 2010a; Freitas et al., 2011a). These materials are commercially appealing due to their interesting physical and structural properties (Cruz et al., 2011), since they can be used as emulsifiers, viscosifiers, stabilizers, thickening or flocculating agents (Alves et al., 2010a; Cruz et al., 2011). Moreover, the use of polysaccharides obtained from natural sources instead of synthetic polymers reduces the negative impact of those materials on the environment, since they are biodegradable and non-toxic (Ferreira et al., 2014). Despite the fact that these biopolymers can be obtained from several organisms (plants, algae and animals), their availability is largely influenced by uncontrollable conditions, such as climate and pollution (Alves et al., 2010a). Nevertheless, numerous bacteria have the ability to synthesize biopolymers which represent a more advantageous process in obtaining polysaccharides, since microorganisms have higher growth rates and the production conditions can be easily optimized, improving productivity and the polymer’s desirable characteristics (Alves et al., 2010a; Cruz et al., 2011). Moreover, agro-industrial byproducts or wastes, such as glycerol (biodiesel byproduct), can be used as a carbon source, making the use of these microorganisms an economic viable alternative (Donot et al., 2012).
Depending on their biological function, bacterial polysaccharides have different cellular locations: they can either be intracellular, associated with the storage of nutrients (e.g. glycogen), extracellular (e.g. xanthan), or as a compound of the cell wall (e.g. peptidoglycans), granting protection and structure to the cell (Schmid et al., 2015a). Extracellular polysaccharides or exopolysaccharides (EPS), are found outside the cell wall, either forming the bacterial capsule (covalently bound to the cell membrane) or as a slime which is loosely bound to the cell surface (Nwodo et al., 2012a; Suresh Kumar et al., 2007a). As such, harvesting the EPSs that were exported to the extracellular environment is rather easy (Schmid et al., 2015a), making EPSs valuable alternatives in the biopolymers’ market.
2 FCT/UNL over a wide range of conditions (pH, temperature, salt concentration) (Rosalam and England, 2006). Gram-negative bacteria of the genus Sphingomonas were found to produce different biopolymers (known as sphingans), such as gellan, welan, rhamsan or diutan. Gellan is mainly used as thickener and suspending agent in the medical and food industries since it is a gelling agent and provides stability to temperature and pH (Fialho et al., 2008). Alginate was first discovered in brown seaweeds in the 1880s and, later, it was found that the species Pseudomonas
aeruginosa and Azotobacter vinelandii were able to produce it as well. The use of this EPS has increased in recent years, since it can not only be used in the food and paper industries, but also, due to its biocompatibility, in the pharmaceutical and medical industries: in surgical and wound dressings, in controlled drug release and as dental impression compounds (Hay et al., 2013). Also, glucose-containing homopolysaccharides have found several applications in different areas. Examples include: dextran, produced by the bacterium Leuconostoc mesenteriodes, that is used as chromatographic media and in the food and pharmaceutical industries; curdlan, isolated from
Rhizobium meliloti and Agrobacterium radiobacter, has been applied in the removal of heavy metals and in the food and pharmaceutical fields. In addition, cellulose, a basic structural biomaterial found in plants, can also be obtained from Acetobacter spp. and is used in food (as an ingestible fiber) and in the biomedical field (Nwodo et al., 2012a).
1.2.
Composition of Exopolysaccharides
Polysaccharides are high molecular weight molecules (104 to 107 Da), obtained by polymerization of several sugar monomers, wherein glucose and galactose are the most common residues (Sutherland, 2001). These monomers are usually neutral sugars, acidic sugars (e.g. uronic acid) and/or amino-sugars (Torres et al., 2011), though, frequently, polysaccharides also contain non-sugar elements, namely organic acyl groups (e.g. acetate, pyruvate) and inorganic compounds (e.g. phosphate, sulphate) (Jaiswal et al., 2014; Nwodo et al., 2012a).
Optimization of FucoPol bioreactor production and exopolysaccharide applications 3
1.3.
EPS: biological functions and biosynthesis
Exopolysaccharides have different physiological roles depending on the microorganism and the environmental circumstances (Donot et al., 2012). Although EPSs are majorly associated with protective mechanisms, since they can prevent cellular desiccation due to their water retention capacity, and protect against predatory microorganisms (Suresh Kumar et al., 2007a), these biopolymers also act as structural elements in the formation of biofilms and play a major role in the adherence to surfaces (More et al., 2014). They are important in interactions with other microorganisms, namely in the bacterial cell-cell recognition and aggregation processes, and are also responsible for the sorption of exogenous compounds and inorganic ions, due to their anionic charge (Donot et al., 2012; More et al., 2014; Whitney and Howell, 2013)
These biopolymers can be synthesized by two different mechanisms depending on the bacteria that produces them. EPS originated from gram-positive bacteria are synthesized in the exterior of the cell by enzymes that were secreted by the bacteria or that are anchored to the cell surface (e.g. levan, dextrans and alternans). On the other hand, gram-negative bacteria synthesize EPSs intracellularly and then secrete the polysaccharides to the extracellular environment (e.g. xanthan, gellan, cellulose) (Madhuri and Prabhakar, 2014; Sutherland, 2001).
For gram-negative bacteria, the bioprocess can be divided into 3 steps that are mediated by different enzymes: EPS biosynthesis starts in the cytoplasm with the activation of simple sugars through the phosphorylation of monosaccharides (fig 1.1), followed by polymerization of the EPS and, finally, the secretion of the exopolysaccharide to the external environment.
4 FCT/UNL to the exterior of the cell by one of two possible mechanisms, Wzx/Wzy- or ABC transporter-dependent pathways (Schmid et al., 2015b; Whitney and Howell, 2013).
Figure 1.1 – Schematic representation of the metabolic pathways associated with the
synthesis of nucleoside sugars that are involved in the biosynthesis of exopolysaccharides in gram-negative bacteria (reproduced with permission from Suresh Kumar et al., 2007).
1.4.
FucoPol
In addition to their valuable properties, some EPS possess rare sugar monomers in their composition, which increases their market value. One of those monosaccharides that are rarely found in Nature is L-fucose (Roca et al., 2015). Moreover, it was reported that fucose-containing polysaccharides have biological activity, since fucose is able to reduce allergic reactions, accelerate wound healing (Péterszegi et al., 2003), also shows an anti-aging effect (Fodil-Bourahla et al., 2003), and can be used as a skin moisturizer or as an cancer and anti-inflammatory agent (Cescutti et al., 2005). These properties make fucose-containing biopolymers suitable to be used in the therapeutic and cosmetic areas.
Optimization of FucoPol bioreactor production and exopolysaccharide applications 5 Furthermore, the gram-negative bacterium Enterobacter A47 (DSM 23139) 1 was previously reported to produce a high molecular fucose-containing EPS, which was named FucoPol (Alves et al., 2010b). FucoPol is a heteropolysaccharide composed of sugar residues: fucose (32-36%mol), galactose (25-26%mol), glucose (28-37%mol) and glucuronic acid (9-10%mol); and acyl groups: succinyl (2-3%wt.), pyruvyl (13-14%wt.) and acetyl (3-5%wt.) (Torres et al., 2015). The composition of FucoPol varies depending on the physicochemical factors of the cultivation conditions, which makes this process very versatile, since it can originate different polysaccharide products that can be used in different applications (Freitas et al., 2014).
1.5.
Motivation
As mentioned above, bacterial exopolysaccharides are biocompatible, non-toxic and eco-friendly macromolecules that can be easily obtained from renewable sources. Moreover, EPSs obtained from microorganisms have different structural composition, showing a high variety of interesting properties: these biopolymers can change the rheological behavior of solutions and show great adsorption abilities (More et al., 2014).
Despite their useful properties, costs of production are still high, which difficult the commercialization of these microbial products. In order to reduce the costs associated to the process, exopolysaccharide production can be optimized either by manipulating the environmental conditions (pH, temperature), or by optimizing the nutritional requirements (carbon, nitrogen, phosphorus). As so, the first objective of this master’s thesis was to optimize the production of FucoPol, a fucose-containing exopolysaccharide produced by Enterobacter A47 (Alves et al., 2010b). Several cultivation parameters, such as the pH, temperature and the carbon/nitrogen ratio, were optimized in previous studies (Torres et al., 2012, 2014). This work aimed to assess the effect of phosphorus concentration on FucoPol production, as well as the impact on the polymer’s composition and molecular mass distribution.
Additionally, the suitability of FucoPol to be used as a flocculating agent and for the removal of heavy metals was evaluated.
1 Enterobacter A47: access number DSM 23139 at DSMZ (Deutsche Sammlung von Mikroorganismen
Optimization of FucoPol bioreactor production and exopolysaccharide applications 7
2.
Effect of phosphorus concentration on
FucoPol production
2.1.
Introduction
Over the past decade, attention has been raised towards several novel microbial extracellular polysaccharides (EPS) with industrially interesting properties that make them suitable to be used as biomaterials in the most different areas, such as medical, cosmetic, pharmaceutical, environmental or even in oil-recovery and paper industries (Roca et al., 2015). Despite their potential, the majority of EPS production processes are not economically viable to compete with polymers from other sources that currently dominate the market (Freitas et al., 2011a). Hence, a better understanding of the different factors that have an impact in the synthesis of EPS is needed in order to optimize the process and minimize the costs of production (Rehm, 2010).
EPS-producing organisms use a diverse range of carbon and nitrogen sources, and have different nutritional and environmental needs. In fact, the yield and efficiency of the EPS production process is largely influenced by several physicochemical factors, such as the carbon/nitrogen ratio (C/N), temperature, pH and nutrients concentration (Nwodo et al., 2012). EPS production frequently occurs under aerobic conditions and usually increases under sub-optimal incubation temperatures and constant neutral pH (Suresh Kumar et al., 2007).
As for the carbon sources, sugars, such as sucrose, glucose, lactose and maltose, are the most commonly used (Suresh Kumar et al., 2007). However, in order to reduce production costs, agro-industrial wastes and byproducts, such as glycerol, cheese whey, molasses or starch, are increasingly being used as carbon sources for exopolysaccharide production (Rehm, 2010; Roca et al., 2015). On the other hand, the use of those less pure substrates can be difficult to implement if the final product is going to be used in applications where high-purity and quality are required (Roca et al., 2015).
For the majority of these fermentative production processes, the yield is maximized with an excess of carbon source and a limitation of other nutrients, such as nitrogen, oxygen or phosphorus (Freitas et al., 2011a). In fact, it is known that FucoPol synthesis occurs under carbon availability concomitant with nitrogen and oxygen limitation (Torres et al., 2015), but the effect of phosphorus concentration hasn’t been studied in great detail.
8 FCT/UNL macromolecules and cellular compounds: in cellular membranes (phospholipids), in the DNA that contain all the genetic information of the cell, in the RNA, and also in the main molecule responsible for energy-transfer in the cell, ATP (White and Metcalf, 2007). Furthermore, inorganic phosphate (Pi) is involved in intracellular signaling in the regulation of several cellular processes, such as membrane transport, enzyme activity and in the metabolic synthesis of macromolecules (Santos-Beneit, 2015).
Despite this nutrient’s importance in the life of the cell, phosphorus availability in the environment is low (Santos-Beneit, 2015). So, researchers have been focusing in understanding the mechanisms involved in the phosphorus uptake process in bacteria. Gram-negative bacteria, such as Escherichia coli and Enterobacter sp., have an outer membrane (OM), that separates de external environment from the periplasm; and a cytoplasmatic or inner membrane (IM), that allows the concentration of nutrients in the cytoplasm (Beveridge, 1999; Rao and Torriani, 1990). Phosphate, like other nutrients, is able to cross the OM into the periplasm through channels (pores) that facilitate the diffusion of these small molecules. These phosphorylated compounds are then degraded by enzymes to inorganic phosphate (Pi) and captured by proteins that transport the Pi across the cytoplasmatic membrane (Rao and Torriani, 1990). There are two transport systems responsible for the uptake of phosphorus compounds by the cell: the Pst system, which is repressed by high Pi concentrations; and the Pit system, which is fully constitutive. In optimal nutritional conditions, the Pit transport system supplies P to the cell at the same rate as it is metabolized, also controlling the excretion of the excessive Pi out of the cell (Jansson, 1988). Phosphorus-starvation conditions induce the transcription of the Pho regulon that codes for several proteins involved in the transport of P into the cell and, therefore, activate the Pst transport system (Rao and Torriani, 1990; Santos-Beneit, 2015). In this conditions, a specific transporter (Ugp system) is activated and glycerol-phosphate is transported across the IM in order to maintain the optimal Pi concentration in the cell (Brzoska et al., 1994).
The majority of the metabolic precursors used in the cell biosynthetic pathways are phosphorylated (Rao and Torriani, 1990) and exopolysaccharide synthesis is no exception. In fact, the first step in the EPS biosynthesis process is the phosphorylation of the carbon source to sugar-6-phosphate (see section 1.3).
Optimization of FucoPol bioreactor production and exopolysaccharide applications 9 shown that for many EPS-producers, the phosphorus concentration that maximizes cell growth was not the same that optimized the production of EPS, such as the production of gellan and xanthan (Lee et al., 2009; Souw and Demain, 1979; Umashankar et al., 1996). On the other hand, a nutritional study performed with Klebsiella pneumoniae concluded that a reduction in the P content in the medium enhanced the production of a rhamnose-containing polysaccharide (Farres et al., 1997). Also, a study performed by Mendrygal and González (2000) showed that the phosphorus concentration determines which polysaccharide is produced by Sinorhizobium
meliloti, since low P concentration increased the synthesis of one type of polymer, the EPS II, while high phosphorus in the medium stimulated the production of succinoglycan. These authors were also able to relate the production of EPS II with a protein that is known to be involved in the regulation of the phosphate uptake in Escherichia coli, pho B (Jansson, 1988; Mendrygal and González, 2000). Janczarek and Urbanik-Sypniewska (2013) found that the Pi concentration affected the transcription of a gene required for the exopolysaccharide synthesis by Rhizobium
leguminosarum and that phoB was one of the proteins responsible for the regulation of this gene.
10 FCT/UNL
2.2.
Materials and Methods
2.2.1.
Biopolymer Production
2.2.1.1.
Cultivation media
The pre-inocula was performed in 250 mL baffled shake flasks with 50 mL of Luria broth (LB) medium (pH 7), which had the following composition (per liter): peptone, 10.0 g; yeast extract, 5.0 g; and NaCl, 10.0 g.
For the inocula, 500 mL Erlenmeyers with 200 mL of Medium E* (pH 7) were prepared with the following composition (per liter): (NH4)2HPO4, 3.3 g; K2HPO4, 5.8 g; KH2PO4, 3.7 g; 10 mL of a 100 mM MgSO4 solution; and 1 mL of a micronutrient solution. This solution was composed (per liter of 1 N HCl): FeSO4⋅7H2O, 2.78 g; MnCl2⋅4H2O, 1.98 g; CoSO4⋅7H2O, 2.81 g; CaCl2⋅2H2O, 1.67 g; CuCl2⋅2H2O, 0.17 g; and ZnSO4⋅7H2O, 0.29 g (Freitas et al., 2014). Medium E* was then supplemented with ~ 40 g.L-1 of glycerol (ReagentPlus 86-88% w/w, Scharlau) as a carbon source.
All solutions used were previously autoclaved (20 minutes at 120 oC, 1 bar) and all microorganism manipulations were performed in a laminar flow chamber, ensuring the maintenance of sterile conditions.
2.2.1.2.
Microorganism
FucoPol was produced by Enterobacter A47 (DSM 23139), which was preserved in glycerol (20% v/v) at -80oC. Culture reactivation was performed by growing the stock cultures in an agar plate (CHROMagarTM Orientation) for 24 h, at 30 oC. Afterwards, pre-inocula were prepared by inoculating an isolated colony from the plate into 50 mL of Luria broth (LB) medium and incubation for 24 h in an orbital shaker (New Brunswick Scientific), at 30 oC and 200 rpm. In order to prepare the inocula, Medium E* (200 mL) was inoculated with 20 mL of the pre-inocula and incubated, during 72 h under the same conditions.
2.2.1.3.
Bioreactor Operation
Optimization of FucoPol bioreactor production and exopolysaccharide applications 11 All assays were performed in a 2 L bioreactor (BioStat B-plus, Sartorius, Germany), using a modified Medium E*, differing in the phosphorus concentration, supplemented with glycerol (40 g.L-1). The temperature was maintained at 30.0 ± 0.1 oC and the pH was automatically controlled at 6.98 ± 0.05, by the automatic addition of NaOH (5 M) and HCl (2 M). A silicon-based antifoam (Sigma-Aldrich, Germany) was used in order to prevent the formation of foam throughout the process.
The bioreactor was inoculated aseptically with 10% (v/v) inocula and operated in batch mode during the first 10 hours after inoculation and, afterwards, in a fed-batch mode, wherein a feeding solution (modified Medium E*, previously supplemented with 200 g.L-1 of glycerol) was supplied to the reactor at a constant rate of 5 mL.h-1.
The air flow rate (0.4 SLPM, standard liters per minute, of compressed air) was kept constant during the cultivation and the dissolved oxygen concentration (DO) was controlled at 10% of the air saturation by automatic variation of the stirrer speed (300-800 rpm) provided by two 6-blade impellers (Freitas et al., 2011b, 2014).
Culture broth samples (24 mL) were periodically recovered from the bioreactor throughout the experiments for measurement of the culture’s broth apparent viscosity, quantification of nutrients’ consumption and production of biomass and polysaccharide. Cultivation broth samples were centrifuged at 10956 x g, for 10 min. (Sigma 4-16 KS, Germany) in order to separate the biomass from the cell-free supernatant. Viscous samples were diluted with deionized water (dilutions of 1:2, 1:4 or 1:10, v/v, depending on the viscosity) before centrifugation, for viscosity reduction. The cell-free supernatant was preserved at -20 oC and was used to determine the glycerol, ammonium and phosphate concentration, as well as to quantify the EPS production throughout the assays. The cell pellets were washed with deionized water and freeze dried (Scanvac, CoolSafe) for 48 hours, for quantification of phosphorus content in the biomass.
2.2.2.
Analytical techniques
2.2.2.1.
Apparent viscosity
12 FCT/UNL controlled stress rheometer (HAAKE MARSIII, Thermo Scientific) equipped with a cone-plate geometry (diameter 35 mm, angle 2º), with a gap of 0.105 mm. The samples were equilibrated at 25 ºC, for 5 min, after which the flow curves were obtained using a steady-state flow ramp in the range of shear rate from 10-5 to 1000 s-1.
2.2.2.2.
Determination of cell growth
Culture growth was determined by measuring the absorbance at 450 nm (with a VWR V-1200 spectrophotometer, Portugal) of the broth samples acquired throughout the cultivation run.The cell dry weight (CDW) was calculated considering that one unit of OD450nm is equivalent to 0.26 g L-1 CDW (as determined in previous studies). This analysis was performed in duplicate.
2.2.2.3.
Glycerol concentration
Glycerol concentration in the cell-free supernatant was determined by high performance liquid chromatography (HPLC) with a VARIAN Metacarb column (BioRad) coupled to an infrared (IR) detector. The analysis was performed at 50 ºC, using H2SO4 (0.01 N) as eluent at a flow rate of 0.6 mL.min-1. The samples were diluted (1:50) with a solution of H
2SO4 (0.01 N) and filtered using Vectra Spin Micro Polysulfone filters (Whatman), which had a pore diameter of 0.2 μm, at 3000 rpm for 10 min. A standard calibration curve was constructed by preparing solutions with different glycerol (ReagentPlus 86-88% w/w, Scharlau) concentrations: 1.0 g.L-1, 0.5 g.L-1, 0.25 g.L-1, 0.125 g.L-1 and 0.0625 g.L-1 (calibration curves in appendix 7.1). This analysis was performed in duplicate.
2.2.2.4.
Ammonia and phosphorus concentration
Phosphorus and ammonia concentration in the cell-free supernatant (dilution 1:200) were determined by colorimetry using a flow segmented analyzer (Skalar 5100, Skalar Analytical, The Netherlands). Standard solutions of phosphorus (KH2PO4) and ammonia (NH4Cl) were also prepared (4 – 20 ppm). This analysis was performed in duplicate.
For determination of the phosphorus content in the biomass, the freeze dried pellets were weighted (approximately 5 mg) and submitted to an acid digestion: the samples were hydrolyzed (1 h at 100 oC) with 400 mg of K
Optimization of FucoPol bioreactor production and exopolysaccharide applications 13
2.2.2.5.
Exopolysaccharide quantification
For EPS quantification, the cell-free supernatant, which contained the polymer, was dialyzed using a 12000 MWCO membrane (Roth Nalo Cellulose Membrane SO farblos) against deionized water, with constant stirring. The water was changed frequently and the conductivity was measured throughout the dialysis process, until a value bellow 10 µS m-1 was reached (around 48 h). Sodium azide, at a concentration of 10 mg.L-1, was added to prevent possible biological degradation of the polysaccharide during the dialysis process.
Afterwards, the purified polymer was freeze dried (Scanvac, CoolSafe) for 48 hours, and weighed, allowing the determination of the polysaccharide content during the cultivation run.
2.2.3.
Calculus
2.2.3.1.
Product yield
The product yield on substrate (Yp/S ,g.g-1) was determined as follows:
𝑌𝑝/𝑆 =𝛥𝑝𝛥𝑆
where 𝛥𝑝 is the the product produced (gEPS) and 𝛥𝑆 is the substrate consumed (gglycerol) during the cultivation run.
2.2.3.2.
Volumetric productivity
The volumetric productivity (𝑟𝑃, g.L-1.d-1) of the EPS production process was determined using the following equation:
𝑟𝑃=𝑑𝑃𝑑𝑡
14 FCT/UNL
2.2.4.
Biopolymer characterization
2.2.4.1.
Sugar and acyl groups
The biopolymer was analyzed in terms of sugar monomers and acyl groups composition. For determination of the sugar composition, dried samples of exopolysaccharide (~5 mg) were dissolved in deionized water (5 mL) and hydrolyzed with trifluoroacetic acid (TFA) (0.1 mL TFA 99%), at 120 ºC, for 2 hours. The hydrolysate was used for the identification and quantification of the constituent monosaccharides by liquid chromatography (HPLC) using a CarboPac PA10 column (Dionex), equipped with an amperometric detector, as described by (Freitas et al., 2014). The analysis was performed at 30 ºC with sodium hydroxide (NaOH 4 mM) as eluent, at a flow rate of 0.9 mL.min-1. (+)-Galactose (99%, Fluka), (+)-glucose anidra (99%, Scharlau), D-(+)-fucose (98%, Sigma), D-(+)-Xylose (99%, Merck), L-rhamnose monohydrate (99%, Fluka), D-(+)-mannose (99%, Fluka), D-glucuronic acid (98%, Alfa Aesan) and D-(+)-galacturonic acid monohydrate (97%, Fluka) were used as standards (50 – 1 ppm).
The acid hydrolysates were also used for the identification and quantification of acyl groups. The analysis was performed by HPLC with and Aminex HPX-87H 300×7.8mm (Biorad), coupled to an infrared (IR) detector, using sulphuric acid (H2SO4 0.01 N) as eluent, at a flow rate of 0.6 mL.min-1 and a temperature of 30 ºC. Standard solutions of acetate (99%, Fischer Chemicals), succinate (99%, Merck) and pyruvate (99%, Sigma-Aldrich) were also prepared (1 – 100 ppm).
This analysis was performed in duplicate.
2.2.4.2.
Molecular mass distribution
Optimization of FucoPol bioreactor production and exopolysaccharide applications 15
2.3.
Results and discussion
Nutritional conditions, such as phosphorus concentration, have a large impact in the yield of the production process and may also affect exopolysaccharide composition. Moreover, a reduction of the phosphorus concentration in the medium will also contribute to a decrease in the production costs. As so, this study aimed to assess the impact of phosphorus concentration on FucoPol production, as well as on the polymer’s properties.
2.3.1.
Effect of phosphorus in exopolysaccharide synthesis
Phosphorus is present in the cultivation medium E* as the following phosphate salts: (NH4)2HPO4, K2HPO4 and KH2PO4. (NH4)2HPO4 was kept constant in all assays, since it served as the nitrogen source, and the different phosphorus concentrations in the medium were achieved by altering the content of the other two salts.
Figure 2.1 – Cultivation profile of Enterobacter A47 with different phosphorus concentrations: a.
2.6 g.L-1, b. 2.0 g.L-1, c. 1.3 g.L-1 and d. 0.8 g.L-1; wherein experimental results of CDW (▲), EPS
(□), ammonia (◊), phosphorus (●) and glycerol (×) are represented throughout the cultivations run.
16 FCT/UNL Figure 2.1 shows the cultivation profiles of Enterobacter A47 when different phosphorus concentrations were present in the cultivation medium. Besides the standard phosphorus concentration, 2.6 g.L-1 (P1 – Fig. 2.1 a.), three other conditions phosphorus concentrations were studied: 2.0 g.L-1 (P2 – Fig. 2.1 b.), 1.3 g.L-1 (P3 – Fig. 2.1 c.) and 0.8 g.L-1 (P4 – Fig. 2.1 d.). The lowest phosphorus concentration studied (0.8 g.L-1) corresponded to the medium’s content in (NH4)2HPO4 that was used as both phosphorus and nitrogen source.
Standard cultivation assay
Fig. 2.1 a. presents the concentration profiles of biomass, EPS, ammonia, phosphorus and glycerol, for the cultivation of Enterobacter A47 with the standard phosphorus concentration in the medium. The exopolysaccharide-producing culture grew exponentially in the first day of the run (Fig. 2.1 a), reaching a maximum CDW of 7.59 g.L-1 (Table 2.1). This value is within the range of those reported in literature for the same cultivation conditions.
After 10 h, the bioreactor was operated in a fed-batch mode, by feeding the culture with a mineral solution supplemented with glycerol, at a constant flow rate of 5 mL.h-1. It is known that FucoPol production is partially growth associated (Torres et al., 2011) and is enhanced in the stationary phase, with low nitrogen and oxygen conditions, concomitant with carbon source, glycerol, availability (Torres et al., 2014). As so, the feeding solution was rich in glycerol (200 g.L-1) and the ammonia was in limiting concentrations (0.9 g.L-1). At this stage, the culture was in the stationary phase, where no growth was verified due to nitrogen and oxygen limitation imposed. An apparent decrease in the CDW was observed 48 h into the cultivation run, which was probably due to a dilution of the biomass content associated with the loss of cells by sampling, concomitant with the inflowing of the feeding medium and pH control solutions. Moreover, the cultivation broth became increasingly viscous throughout the run, which made the measurement of the optical density less accurate and, consequently, the CDW calculation was also less accurate.
Simultaneously with bacterial growth, glycerol concentration decreased rapidly in the first 24 hours (from 42.81 g.L-1 to 24.62 g.L-1) (Fig. 2.1 a). Afterwards, glycerol was added into the bioreactor in the feeding solution (200 g.L-1, 5 ml.h-1) but was still being consumed by the culture, even though the cells weren’t multiplying. At this stage, the cells were using the substrate mainly to synthesize EPS. From the third day on (72 h), glycerol concentration was maintained below 2 g.L-1, showing that all the substrate fed to the bioreactor was being consumed by the bacterial cells (Fig. 2.1 a).
Optimization of FucoPol bioreactor production and exopolysaccharide applications 17 Indeed, after 24 h, 0.72 g.L-1 of exopolysaccharide were already produced. At the end of the cultivation run, Enterobacter A47 had produced 6.80 g.L-1 of biopolymer. Concomitant with EPS production, there was a gradual increase of the apparent viscosity of the broth from 0.02 to 0.91 Pa/s (measured at 0.82 s-1) throughout the cultivation run. It is noted that the apparent viscosity of the broth increased two orders of magnitude (10-2 to 100), resembling the results reported in previous studies (Alves et al., 2010b; Torres et al., 2011). This alteration in the rheology of the culture broth is probably due to the accumulation of the EPS in the cultivation medium (Alves et al., 2010b). However, the increase in viscosity compromised the optical density measurement, which could also explain the apparent reduction of the CDW.
Table 2.1 –Parameters of exopolysaccharide production by Enterobacter A47 with different
phosphorus concentrations in the cultivation medium.
literature 2 P1 P2 P3 P4
P(g.L-1) 2.6 2.6 2.0 1.3 0.8
CDWmax. (g.L-1) 5.70 – 7.68 7.59 7.64 5.89 7.01
EPS produced. (g.L-1) 7.23 – 7.97 6.80 5.12 5.20 3.84
P consumed (g.L-1) - 0.98 0.65 0.41 0.33
P biomass (%) - 1.4 1.4 1.4 1.3
𝑟𝑃 (g.L-1.d-1) 1.89 – 2.04 1.72 1.28 1.30 0.96
YP/S (g.g-1) 0.10 – 0.17 0.10 0.10 0.10 0.07
As can be seen in table 2.1, the amount of EPS produced was slightly lower than the obtained in previous studies, which could be due to differences in the quantification methods. In this work a higher dilution (1:10 instead of 1:2) was used in the extraction of the EPS from the broth, which could have increased the error in the quantification.
Considering 95 h the time frame of the cultivation assay, a volumetric productivity of 1.72 gEPS.L-1.d-1 was achieved (table 2.1). These values, although slightly lower, are close to the ones reported in the literature, 1.89-2.04 gEPS.L-1.d-1 (Freitas et al., 2014; Torres et al., 2011, 2012 and 2014). The yield of EPS on glycerol in this cultivation run was 0.10 gEPS.gglycerol, which is in the range of the values reported in literature for the same cultivation conditions (table 2.1).
2 The values shown in table 2.1 from literature were obtain from Freitas et al. (2014), Torres et al. (2011),
18 FCT/UNL During the batch phase, the phosphorus concentration in the cultivation broth decreased, concomitant with cell growth, but it remained practically constant (~2.5 g.L-1) during the fed-batch phase (Fig. 2.1 a). This result shows that practically all the phosphorus provided by the feeding was consumed by the culture. There was an overall phosphorus consumption of 0.98 g.L-1 (Table 2.g.L-1). Hereupon, it is apparent that this nutrient was required not only for the metabolism involved in cell growth, as expected, but also for EPS synthesis, since it continued to be consumed during the fed-batch phase when cell growth was restricted. For many gram-negative bacteria (e.g. Azotobacter vinelandii, Pseudomonas NCIB 11264, Klebsiella aerogenes), studies proved that the enzymes responsible for the synthesis of the precursors involved in EPS formation are constitutive (Horan et al., 1981). Moreover, Sutherland (1982) proposed that maybe some precursors and enzymes required for EPS synthesis are also used during growth for the synthesis of other compounds (e.g. UDP-galactose), such as wall polymers, teichoic acids or lipopolysaccharides. The author also refers the anabolism of glucose as an example, where glucose-1-phosphate is synthesized and can be converted to UDP-glucose, a precursor used in the EPS biosynthesis.
Different phosphorus concentration assays
In this set of experiments, different phosphorus concentrations were tested for Enterobacter A47 cultivation and EPS production.
In all assays, the culture reached maximal biomass concentration around the first day of cultivation (Fig. 2.1 b, c and d), with CDW values between 5.89 and 7.59 g.L-1 (table 2.1). Hereupon, it is possible to presume that the phosphorus concentration in the cultivation medium had no significant effect on the cell growth of Enterobacter A47 in the range of concentrations tested. The fed-batch phase was in all experiments initiated within 10 hours of cultivation. The ammonia present in the medium was completely consumed in all assays and kept bellow the detection limit until the end of the cultivation runs (Fig. 2.1 b, c and d).
In terms of exopolysaccharide production and glycerol consumption, major changes in the cultivation profile occurred when different phosphorus concentrations were present in the medium. In contrast with run P1, glycerol concentration was kept high (above 15 g.L-1) during the fed-batch phase of runs P2, P3 and P4 (Fig. 2.1). In fact, when compared with the results obtained from the standard assay (run P1), in which 67.50 g.L-1 of glycerol were consumed, less glycerol (51.3-56.7 g.L-1) was consumed in all of the other conditions tested (runs P2, P3 and P4).
-Optimization of FucoPol bioreactor production and exopolysaccharide applications 19 1 (runs P2 and P3, respectively) resulted in an EPS production of only 5.12 and 5.20 g.L-1 (i.e.,
there was a reduction of approximately 24% compared to the production of run P1). Reducing the phosphorus concentration in the medium to 0.8 g.L-1 in run P4, led to a further reduction of EPS production to only 3.84 g.L-1 (Table 2.1), which represents a reduction of around 44% compared to the standard conditions of run P1.
Correspondingly, the overall volumetric productivity of runs P2 and P3 were similar (1.28 gEPS.L-1.d-1 and 1.30 gEPS.L-1.d-1, respectively), while that of run P4 was considerably lower (0.96 gEPS.L-1.d-1) (table 2.1). Runs P2 and P3 also presented the same product-substrate yield, 0.10 gEPS.gglycerol-1, similarly to run P1. On the contrary, for run P4, a lower yield of 0.07 gEPS.L-1.d-1 was obtained.
The results achieved in this study seem to indicate that the phosphorus concentration in the cultivation medium of Enterobacter A47, although not having an impact on cell growth, significantly affected the production of exopolysaccharide. This impact was more pronounced for the lowest P concentration tested, for which polymer production, overall volumetric productivity and product-substrate yield were lower than the values obtained under the high phosphorus concentration conditions of run P1.
As can be seen in figure 2.1, independently of the initial phosphorus concentration in the medium, in all assays, it tended to decrease during the batch phase, remaining practically constant during the fed-batch phase. However, the overall phosphorus consumption was reduced (table 2.1). In fact, the highest consumption value (0.98 g.L-1) was achieved for the phosphorus rich medium of run P1, being gradually reduced for runs P2, P3 and P4 (table 2.1). This result might be related to the lower EPS synthesis observed as the P concentration was decreased. Polysaccharide synthesis in bacteria requires the biosynthesis of activated precursors, nucleoside diphosphate sugars (NDP-sugars), which are derived from phosphorylated sugars (Freitas et al., 2011a). Therefore, the decreasing phosphorus consumption observed in runs P2, P3 and P4 suggests the lower requirement of this nutrient for the biosynthesis of the EPS building blocks.
20 FCT/UNL Rosenberg et al. (1977). A correlation between the assimilation of Pi and the presence of K+ has been proposed since potassium is required in the transport of this nutrient (Rosenberg, 1987). In fact, K+ not only stimulates de assimilation of Pi but also the production of EPS (Sutherland, 1982). In this set of experiments, the reduction of P concentration in the medium was accompanied by a simultaneous reduction of K+, since K
2HPO4 and KH2PO4 were also the source of potassium. Hence, reducing the concentration of K+ in the medium could have also contributed for the reduction in the Pi uptake, thus impairing EPS synthesis.
Despite the differences in the overall consumption of this nutrient, the amount of P in the cells was identical (1.3-1.4%) in all conditions tested. As so, Enterobacter A47 must have been using this nutrient in its metabolism. Besides, the inorganic phosphate transporter (Pit) is not only responsible for the uptake of P, but also for the release of this nutrient from the cell when the intracellular phosphorus concentration is high, maintaining a stable pool of phosphorus in the cell (Jansson, 1988). This internal Pi-pool then supplies this nutrient to be used by bacteria in its metabolism. Phosphorus is an important metabolic intermediate in several important reactions. For example, it is involved in nucleophilic substitution reactions (Pi), and acts as an electrophile atom in the ATP molecule (Nelson and Cox, 2004). Moreover, the hydrolysis of the ATP molecule provides chemical energy so that many thermodynamic unfavorable reactions can occur, these reactions include the synthesis of precursors and biomolecules, the transport across membranes against the concentration gradient, or mechanical motion (Nelson and Cox, 2004). Also, many pathways are regulated by the phosphorylation of certain enzymes, such as glycolysis, gluconeogenesis, mitochondrial and nucleic acid metabolism (Bergwitz and Jüppner, 2011). Some bacteria are also capable of storing phosphorus in the form of polyphosphate (poly-P) in intracellular vacuoles. Poly P can be used as a supply of P in phosphorus-starvation conditions, or as an energy source, since it can substitute ATP in certain biological reactions. The synthesis of poly-P is related to the rate of phosphorus uptake, since is under control of the same signaling system as the pho regulon (Bergwitz and Jüppner, 2011).
Hereupon, the results seem to indicate that reducing the phosphorus concentration in the cultivation medium had a negative impact on EPS production by Enterobacter A47, suggesting that P rich medium favors EPS synthesis.
However, a different trend was documented for other bacteria. Increasing the phosphate in the cultivation medium until a certain value enhanced EPS synthesis, but a further augmentation of this nutrient led to a decrease in the EPS production. Examples include xanthan production by
Optimization of FucoPol bioreactor production and exopolysaccharide applications 21 concentration had an impact in cellular growth and the optimal concentration for EPS production did not maximize the growth. As for pullulan synthesis by the fungus Aureobasidium pullullans, Yu et al. (2012) concluded that an increase in the phosphorus concentration until 0.53 g.L-1 led to an higher EPS production. Higher concentrations of phosphorus did not seem to affect the production of pullulan, which remained maximal in the range tested (0.53 g.L-1 to 1.60 g.L-1). Moreover, the phosphorus concentration did not affect the growth of A. pullullans.
2.3.2.
Effect of phosphorus in exopolysaccharide composition and
molecular mass distribution
As previously referred, the polymer’s chemical composition can change depending on the nutrients present in the cultivation medium. Hence, the EPS obtained in the different experiments of this study were characterized in terms of sugar and acyl groups composition (Table 2.1). Moreover, their average molecular weight (Mw) and polydispersity index (PDI) were also determined (Table 2.1).
Table 2.1 – Physical-chemical characterization of the biopolymers produced by Enterobacter
A47 with different phosphorus concentrations in the cultivation medium.
Sugar content (%mol) Total
acyl
Groups
(%wt)
Mw
(x106 Da) PDI
fucose galactose glucose glucuronic
acid
(Freitas et al., 2011; 2014; Torres et al.,
2011, 2012)
30 – 36 22 – 29 25 – 34 9 – 10 12 – 22 4.19 – 5.80 1.30 – 1.44
P1 35 23 31 10 8 4.43 1.91
P2 34 25 30 10 9 3.93 1.58
P3 28 24 39 9 9 8.05 2.78
22 FCT/UNL The glycosyl composition analysis of the exopolysaccharides revealed some differences when
Enterobacter A47 was grown in media with different phosphorus concentrations. Concerning the standard assay, run P1, the EPS obtained presented the typical FucoPol sugar composition: 35 %mol fucose, 23 %mol galactose, 31 %mol glucose and 10 %mol glucuronic acid (table 2.2). Reducing the P concentration to 2.0 g.L-1(run P2) did not affect the polymer’s composition as it had also the expected composition of FucoPol: fucose (34 %mol), galactose (25 %mol), glucose (30 %mol) and glucuronic acid (10 %mol). However, further reducing the P concentration to 1.3 and 0.8 g.L-1 (runs P3 and P4, respectively) affected the composition of the polysaccharides synthesized. In fact, the polymers produced in runs P3 and P4 had a higher content of glucose (39-41 %mol) and lower content of fucose (26-28 %mol) than the typical FucoPol (table 2.2).
Regarding the acyl groups’ analysis, the results indicated that all the biopolymers had similar acyl groups content (8-11 %wt) (table 2.2). Although slightly lower, these values were closer to the one previously reported for FucoPol (Freitas et al., 2011, 2014; Torres et al., 2011, 2012).
The results shown in table 2.2 also revealed that the polymers produced in run P1 and P2 had an average molecular weight (~4 x 10⁶ Da) similar to the values reported in previous studies for FucoPol (4.19×10⁶ – 5.8×10⁶). However, when the phosphorus concentration in the medium was reduced in runs P3 and P4, the Mw of the EPS produced by Enterobacter A47 increased (~8 x 10⁶ Da). The results from the SEC analysis also revealed that the biopolymers were homogeneous, since they all had low polydispersity index values (1.58-2.78).
In terms of the differences in molecular weight, this study is in agreement to what Yu et al. (2012) reported for pullulan production by the fungus A. pullullans: an increase in the Mw of the EPS when the phosphorus was reduced. No studies concerning the impact of the phosphorus concentration in the polymer’s composition and molecular weight were found in literature.
According to the results, phosphorus seemed not only to have an impact in EPS production and productivity, but also in the physicochemical properties of the final polymer. However, a slight reduction in the phosphorus content from 2.6 to 2.0 g.L-1 did not affect the composition and molecular weight of the biopolymer, although a lower production was observed. When the phosphorus concentration was further reduced (runs P3 and P4), the polymer showed a higher glucose and lower fucose contents, and a higher molecular mass value. It is also verified that these different polymers were produced in the assays where a reduction in the phosphorus consumption was noticed, confirming the impact of this nutrient.
Optimization of FucoPol bioreactor production and exopolysaccharide applications 23 the metabolism of the cell, such as for the synthesis of cellular components (e.g. UDP-glucose), and others are only involved in the EPS biosynthetic process (Sutherland, 1982).
Furthermore, according to figure 1.1 (section 1.3), GDP-fucose and UDP-glucose share the same common precursor, glucose-6-P. Torres et al. (2011) suggested that the decrease in the glucose content is related to the conversion of this sugar into galactose and fucose, possibly due to the fact that the enzymatic machinery required in this metabolic pathway was only available later in the cultivation run. Therefore, maybe the phosphorus concentration has an impact in the pathway that leads to the conversion of glucose into fucose. Maybe the synthesis of a key enzyme of this pathway is under control of a regulation system that uses phosphorus concentration as a signal to the activation/repression of transcription.
2.4.
Conclusions
This study showed that the phosphorus content does not have an impact in the growth of
Optimization of FucoPol bioreactor production and exopolysaccharide applications 25
3.
Evaluation of the flocculating
properties of FucoPol
3.1.
Introduction
Nowadays, flocculants are widely used in wastewater and drinking-water treatment, food and fermentation downstream processing, as well as in textile, pharmacology and cosmetology industries. They can be classified as inorganic flocculants (e.g. aluminum sulfate and polyaluminium chloride), organic synthetic flocculants (e.g. polyacrylamide derivatives and polyethylene imine) and bioflocculants (e.g. chitosan, sodium alginate and microbial flocculants) (Salehizadeh and Yan, 2014). Synthetic and inorganic flocculants are the most commonly used, due to their lower costs and high efficiency (Giri et al., 2015). However, it was recently discovered that their use raises several health and environmental problems, since they are non-biodegradable and some of their monomers, such as acrylamide, are known to be highly toxic and carcinogenic (Rudén, 2004). Moreover, it was proven that aluminum salts can cause Alzheimer´s disease (Campbell, 2002).
Bioflocculants are macromolecules obtained from natural sources which have the ability to flocculate particles (suspended solids, cells, colloidal solids) out of solution. These flocculants are emerging as an attractive alternative to the traditional flocculants, since they don´t represent a risk to human health, are biodegradable and harmless to the environment.
26 FCT/UNL Over the past few decades, many microorganisms, such as bacteria, algae and fungi, have been reported to produce polymers presenting flocculating capacity. These macromolecules include proteins, glycoproteins and polysaccharides. Microbial biopolymer flocculants have the advantage of being produced economically at large scale, under controlled environmental conditions, and being usually easily recovered from the fermentation broth (Karthiga devi and Natarajan, 2015). Hence, these bio-friendly compounds are attracting great research interest.
Microorganisms, such Rhodococcus erythropolis (Peng et al., 2014) and Bacillus subtilis (Sathiyanarayanan et al., 2013), produce protein flocculants, whereas bioflocculants produced by
Bacillus licheniformis (Zhao et al., 2013) and Halobacillus sp. (Cosa et al., 2012) are composed of glycoproteins. However, the majority of bioflocculant-producing organisms, such as Bacillus sp., Aeromonas sp., Klebsiella sp. and Enterobacter sp., are known to produce polysaccharide flocculants (More et al., 2014; Salehizadeh and Yan, 2014).
Several microorganisms are able to produce carbohydrate polymers with an interesting flocculating activity, and there are few studies where Enterobacter sp. is the source of the bioflocculant. Yokoi et al. (1997) reported the potential of a biopolymer produced by
Enterobacter sp. BY-29 to flocculate not only inorganic suspensions, such as kaolin and active carbon, but also organic suspensions of cellulose and yeast; Lu et al. (2005) proved that the polysaccharide produced by Enterobacter aerogenes W-23 could be used to flocculate a trona suspension with higher efficiency than the chemical flocculants usually used. Prasertsan et al. (2006) studied the flocculation rate of the bioflocculants produced by several bacterial strains and concluded that Enterobacter cloacae WD7 was the most promising strain. The flocculation activity and mechanism of an EPS produced by Enterobacter sp. was also studied by Tang et al. (2014).
Furthermore, the bacterium Enterobacter A47 (DSMZ 23139)was previously reported to produce a fucose-containing exopolysaccharide, FucoPol, when using glycerol as a carbon source (Alves et al., 2010b). FucoPol is a high molecular weight (4.19 – 5.80 x 10⁶ Da) heteropolysaccharide composed of sugar residues (fucose, galactose, glucose and glucuronic acid) and acyl groups (succinyl, pyruvyl and acetyl) (Torres et al., 2015). These non-carbon substituents grant an anionic character to these macromolecules, creating adsorption sites that allow interactions with ions and other molecules.
Optimization of FucoPol bioreactor production and exopolysaccharide applications 27
3.2.
Materials and Methods
The FucoPol used in this study was produced by Enterobacter A47 in cultivation run P1 (standard phosphorus concentration), presented in section 2.
3.2.1.
Exopolysaccharide extraction and purification
The culture broth recovered at the end of run P1 was diluted with deionized water (1:10, v/v), in order to reduce the viscosity, and the bacterial cells were removed by centrifugation (10375 x g, 45 min, 4 oC). The cell-free supernatant was then submitted to a thermal treatment (70 oC, 1 h) to inactivate the bacterial enzymes, preventing a possible degradation of the biopolymer in the subsequent extraction steps. Afterwards, the treated supernatant was centrifuged (10375 x g, 45 min, 4 oC) to remove precipitated proteins and any remaining cell debris.
In order to reduce the concentration of unwanted components (salts, glycerol, proteins), the treated supernatant was submitted to a continuous diafiltration (constant volume diafiltration) process, using a cross-flow module (Sartocon Slide Holder), equipped with a 100 000 Da nominal molecular weight cut-off (NMWCO) ultrafiltration membrane (Hydrosart® Ultrafiltration Cassette, Sartorius), with a surface area of 100 cm2, operated at a transmembrane pressure below 1.5 bar. When the EPS solution’s conductivity reached values bellow 150 µS cm-1, the membrane module was switched to an ultrafiltration mode (volume reduction) to concentrate the treated supernatant (3:1, v/v). Finally, the solution was freeze dried and the purified biopolymer was stored at room temperature.
3.2.2.
Bioflocculant characterization
The sugar and acyl composition, as well as the molecular mass distribution were determined according to the protocol described in section 2.2.4.
3.2.2.1.
Inorganic content
In order to quantify the ash content of the polymers, they were subjected to pyrolysis at a temperature of 550 ºC, for 24 hours. The total inorganic content was determined by weighting the