Printed version ISSN 0001-3765 / Online version ISSN 1678-2690 http://dx.doi.org/10.1590/0001-3765201720150786
www.scielo.br/aabc | www.fb.com/aabcjournal
Effect of carbon source on production, characterization and bioactivity
of exopolysaccharide produced by
Phellinus vaninii
Ljup
CHUNPING XU1, 2, JINWEI YU1,
SHANSHAN ZHAO1,
SHUNGSHUNG WU1, PEIXIN HE1,
XUEWEI JIA1,
YANQI LIU1 and
DUOBIN MAO1
1
College of Food and Biological Engineering, Zhengzhou University of Light Industry, Zhengzhou, 450002 Henan, P.R. China
2
Collaborative Innovation Center of Food Production and Safety, Zhengzhou, 450002 Henan, P.R. China
Manuscript received on October 27, 2015; accepted for publication on March 18, 2016
ABSTRACT
The effect on different three carbon source (i.e. glucose, fructose and sucrose) on production, chemical characterization and antioxidant activity of exopolysaccharide (EPS) produced by Phellinus vaninii Ljup was investigated in this study. Amongst carbon sources examined, glucose and sucrose were favorable for the mycelia growth, while the maximum EPS yield was achieved when sucrose was employed. The predominant carbohydrate compositions in EPSs identified were gluconic acid, glucose, mannose and galactose acid. Then, FT-IR spectral analysis revealed prominent characteristic groups in EPSs. EPSs molecule exist as nearly globular shape form in aqueous solution. The variation also affects antioxidant activities by investigated by using hydroxyl and DPPH radical scavenging assay. Sucrose was best carbon source from the viewpoint of antioxidant activity due to the relatively high contents of galactose in the EPS with moderate molecular weight and polydispersity.
Key words: Phellinus vaninii Ljup, exopolysaccharide, carbon source, antioxidant activity, composition.
Correspondence to: Yanqi Liu E-mail: liuyanqi@zzuli.edu.cn
INTRODUCTION
Phellinus vaninii Ljup (also called Yanghuang in
Chinese) is a famous Chinese medicinal fungus belonging to Basidiomycetes, Aphyllophorales, Hymenochaetacae, Phellinus (Dai 2010). Bioactive metabolites from P. vaninii Ljup can be isolated from fruiting bodies and cultured mycelia, including
phenolic compounds, flavonoids, polysaccharides,
triterpenoids, terpenes, alkaloid, etc (Cheng et al. 2011, Hu et al. 2014). The ethyl acetate extract of mycelial fermentation by P. vaninii Ljup showed
strong antiproliferative activity in vitro (Hu et al. 2014).
The submerged culture for exopolysaccharide (EPS) production by medicinal fungi are proved to have many properties, such as immunomodulation, anticancer, antioxidant, hypolipidemic and hyperglycemic activities (Mahapatra and Banerjee 2013, Wasser 2002).Many investigators have attempted to obtain the optimal submerged culture for EPS from several fungi (Tang et al. 2008, Xiong et al. 2012). It is demonstrated that the
yields and compositions of the EPS were affected
by culturing conditions, especially when using
the antioxidant property (Fan et al. 2009, Xiong et al. 2012). However, no data are currently available concerning the effect of carbon sources on the change in chemical characterization and bioactivity of exopolysaccharide of fungal polysaccharides. Therefore, the aim of the study was evaluation of
effect of three carbon sources (glucose, fructose
and sucrose) on features and antioxidant potential
of P. vaninii Ljup EPS produced during submerged
cultivation.
MATERIALS AND METHODS
CHEMICALS
The carbon sources (glucose, fructose and sucrose) and chemicals for medium culture were of reagent grade, while other chemicals were of analytical grade.
FUNGI AND MEDIUM CULTURE
Phellinus vaninii Ljup was isolated from Wanda
mountains of Heilongjiang province and kept in the Forest Microbiological Research Center of Northeast Forestry University (deposit no. 199537). Stock cultures were maintained on potato dextrose agar (PDA) slants. Before the seed culture, P.
vaninii Ljup was transferred onto another petri dish
with the media of 40 g/L glucose, 4 g/L malt extract and 20 g/L agar by punching out 5 mm of the agar plate culture with a cutter and cultivated for 8 d at 26
oC. Seed cultures on the flask were obtained 250 ml
Erlenmeyer flasks filled with 50 mL of media (40 g/L
glucose, 4 g/L malt extract and 4 mmol/L KH2PO4, pH 7). The fermentation media were inoculated with 4% (v/v) of liquid four-day old seed culture, and incubated at 28 oC in a 5-L stirred-tank (Infors, Switzerland). Fermentations were conducted in the same medium as seed culture under the conditions of temperature 28 oC, aeration rate 2 vvm, agitation speed 160 rpm, pH 7, working volume 3 L and
cultivation time 8 d. To study the effect of different
carbon sources on EPS production, the glucose in
the agar plate and submerged culture medium was replaced by fructose or sucrose. All experiments were performed in triplicate to ensure the trends observed were reproducible.
EPS QUANTIFICATION AND MYCELIAL DRY WEIGHT
The culture broth was centrifuged at 9000 rpm for 15 min, and the resulting supernatant was mixed with four vols. of pure ethanol. The precipitated EPS was collected by centrifugation at 9000 rpm for 15 min and then deproteinized using Sevag reagent (1:4 n-butanol/chloroform, v/v). After removing the proteins and Sevag reagent by centrifugation, the aqueous phase was dialyzed against deionized water and lyophilized to yield the crude polysaccharide. The total EPS in the culture medium was determined by the phenol–sulphuric acid method, using glucose as the standard (Dubois et al. 1956). The dry weight of mycelium was measured after washing the mycelial pellet with distilled water three times and drying at 70 oC to a
constant weight (Hwang et al. 2003).
PURIFICATION OF EPS
The polysaccharide was re-dissolved in 0.2 M NaCl solution, and applied to a Sepharose CL-6B column (2.4 cm×100 cm, Sigma Chemical Co., St Louis, MO) and eluted with the same solution at
a flow rate of 0.6 ml/min. Fractions (5.0 ml/ tube)
were collected by a fraction collector (Hwang et al. 2003). The total carbohydrate content in the EPS was also determined by the phenol-sulfuric acid method (Hu et al. 2014).
SEC/MALLS ANALYSIS
The molecular weights of the EPS were estimated by SEC coupled with multi-angle static laser light scattering detection (MALLS; DWAN
EOS equipped with a GaAs laser at 690 nm (λ),
Refractive Index (RI) detector (Optilab rEX, Wyatt Technology, Santa Barbara, CA). The EPS
samples were dissolved in a 0.1M PBS buffer (pH
6.8) containing 0.04% diaminotetraacetic acid– disodium salt (Na2EDTA) and 0.01% sodium azide
and filtered through 0.025 µm filter membranes
(Millex HV type, Millipore Co., Bedford, MA) prior to injection into the SEC/MALLS system. The chromatographic system consisted of a degasser
(Degasys, DG-1200, uniflow, HPLC Technology, Macclesfield, UK), a SSI 222D pump (Scientific
Systems, State College, PA, USA) single-piston isocratic, pulse-dampened HPLC pump (Model 590 Programmable Solvent Delivery Module, Waters Co., Milford, MA), an injection valve (Rheodyne,
Inc., Cotati, CA) fitted with a 500 µl loop, and two
SEC columns (Shodex OH Pack SB-803 and 805
HQ, JM Science Inc., Buffalo, NY) connected in
series. The flow rate was 0.75 mL/min and the injection volume and concentration was 100 mL and 2 mg/mL, respectively. During the calculation of molecular weights of each EPS, the value of dn/dc
(specific refractive index increment) was used from
the data in literature (Jumel et al. 1996), in which the estimated dn/dc was 0.14 mL/g. Calculations of molecular weight and root mean square (RMS) radius of gyration for each EPS were performed by the Astra 4.72 software (Wyatt Technology). The RMS radii of each polysaccharide were determined
from the slope by extrapolation of the first-order
Debye plot (Astafieva et al. 1996). The gross conformation of EPS in aqueous solution could be
identified from the double logarithmic plot of RMS
radius vs. molecular mass of EPS according to the following equations:
Spheres:
r
i3∝
M
i→
log
r
i=
k
+
1 / 3log
M
iRandom coils:
r
i3∝
M
i→
log
r
i=
k
+
1 / 2 log
M
iRigid rods: ri3∝Mi→logri =k+logMi
where ri is the RMS radius of an EPS molecule, Mi
is the molar mass of EPS, k is the intercept at the
Y-axis (RMS radius), and 1/3, 1/2, and 1 are the critical slope values for determining the molecular conformation of each EPS (Hwang et al. 2003, Lim et al. 2005).
MONOSACCHARIDE COMPOSITION ANALYSIS For the identification and quantification of monosaccharide, EPS fraction (5 mg) was
hydrolyzed with 2 mL of 2 M trifluoroacetic acid
(TFA) at 110 oC for 2 h. The hydrolyzate was repeatedly co-concentrated with methanol, reduced with NaBH4 for 30 min at 20 oC and acetylated with acetic anhydride and pyridine at 100 oC for 20 min. The internal standard sugars were prepared and subjected to GC-MS analysis separately in the same way. The alditol acetates of EPS fraction were analyzed by GC-MS (Varian Co., Model: Star 3600
CX, Lexington, MA, USA) fitted with a fused silica
capillary column (Na form, 300mm × 0.25 mm,
Supelco Inc., Bellefonte, PA, USA) and a flame
ionization detector.
FT-IR SPECTROSCOPY
FT-IR Spectroscopy (Bruker Tensor 27) was analyzed using the KBr disc for detecting functional
groups. The purified EPS fractions (1 mg) were
ground with 300 mg KBr powder and then pressed into pellets for transform IR spectral measurement on a Mattson Instrument from 550 to 4,000 cm-1. Spectra were corrected for wave number dependent
signal-detection efficiency of the setup using the
white light spectrum of a temperature-calibrated tungsten band lamp.
ANTIOXIDANT ACTIVITY ASSAYS
scavenging activity were determined according to
the methods of Wang et al. (2010) and Eloff et al.
(2008), respectively.
STATISTICAL ANALYSIS
Data were expressed as mean ± S.D. (n = 3). The
statistical significance was determined by Student’s
t-test. Experimental data were statistically subjected to analysis of variance (ANOVA) using SPSS
(version 11.0, Chicago, IL) to evaluate significant differences at probability level of p < 0.05.
RESULTS AND DISCUSSION
EFFECTS OF CARBON SOURCES IN MEDIUM ON BIOMASS AND EPS PRODUCTION
The results of the biomass and EPS of P. vaninii Ljup from the submerged culture in a 5-L stirred-tank with various carbon sources are shown in Figure 1. After a fermentation period of 8 days, glucose and sucrose were the most suitable carbon source for biomass production. However, the highest EPS yield of 1.96 g/L achieved when sucrose was employed. The result indicates that P. vaninii Ljup
has the ability to use different carbon sources, all of which have varied degree of stimulatory effect
on biomass and EPS production. Both glucose and fructose are hexoses, which can participate in glycolytic and pentose phosphate pathways. According to biomass and EPS yield in Figure 1, sucrose was shown to sustain high growth rates
in cell cultures and carbon conversion efficiency
is also high. It has been reported that different
carbon sources had different influences of catabolic
repression on the secondary metabolism (Tang et al. 2008, Khondkar et al. 2002). Though it is well known that sucrose is a disaccharide combination of the monosaccharides glucose and fructose, the information concerning the metabolic utilisation of sucrose for EPS production is extremely limited.
PURIFICATION AND ANALYSIS OF CARBOHYDRATES
The EPS was obtained from the fermentation broth from submerged culture of P. vaninii Ljup by the
method of ethanol precipitation. In gel filtration chromatography of the culture filtrate on Sepharose
CL-6B, the main fraction of each EPS produced
from three different carbon sources was coeluted.
The detailed monosaccharide compositions from the carbohydrate composition in the EPS fraction could be worked out from trifluoroacetic acid hydrolysis and GC-MS analysis as illustrated in Table I. As expected, the carbohydrates composition within the EPS varies with the different carbon sources. Nevertheless, the predominant sugars in
EPS, identified in this study, were gluconic acid,
glucose, mannose and galactose acid. Negligible amounts of rhamnose, ribose and xylose were also detected. This indicates that interconversion among glucose, fructose and sucrose in the microorganism give polysaccharides with the similar composition. It is very interesting to note that the highest content of galactose unit was observed in carbohydrate composition when the sucrose was employed as carbon source (Table I). Kai et al. (2003)found that different carbon sources in the media can influence the hetero-polysaccharides synthesis
by Pestalotiopsis microspora. When glucose was
possess similar functional groups. There is a broad stretching intense characteristic peak at ca. 3279-3285 cm-1 typical of -OH groups as well as a weak C–H band at ca. 2922-2928 cm-1. The characteristic band at ca. 1641-1643 cm-1 could be correlated to the stretching vibration of the carbonyl group (C=O) of the polysaccharide. Bands at ca. 1024-1030 cm-1 suggested the presences of C-O type
of linkages (Xie et al. 2010). Each particular polysaccharide possessed the specific bands at 807-810 cm-1 and 916-921 cm-1, indicating both α-
and β-configurations of the sugar units (Lim et al.
2005).
MOLECULAR AND STRUCTURAL PROPERTIES The molecular mass values for two eluted fractions were calculated for the portions of peaks, which lie within the peak ranges. The relevant molecular parameters of each EPS are summarized in Table II. In Table II, the molecular weights of EPSs from glucose, fructose and sucrose as carbon source in the medium were estimated to be 6.255 ×10⁵, 3.132 ×10⁵ and 2.469 ×10⁵ respectively. Zhang et al. (2004) suggested that moderate molecular weight on the improvement of the bioactivities of the polysaccharides is important. The high values of polydispersity ratio for all EPSs (4.72-8.95) TABLE I
Carbohydrate composition in exopolysaccharides produced during submerged cultivation of P. vaninii Ljup
in the media with selected three different carbon sources. Carbo
-hydrate
(%)
Carbon sources in the medium
Glucose Fructose Sucrose
Rhamnose nd 1.42±0.08a nd
Ribose nd 1.22±0.13a 0.92±0.04b
Xylose 1.52±0.04a 2.05±0.07b 1.84±0.11c Gluconic
acid 19.53±1.23a 35.87±3.45b 20.89±1.98c Galactose 2.39±0.16a 2.77±0.08b 10.09±0.86c Glucose 24.28±2.13a 7.77±0.36b 14.79±0.94c Mannose 30.68±1.87a 42.27±3.94b 36.15±2.17c Galactose
acid 21.60±1.06a 6.63±0.85b 15.32±0.77c
nd refers to not detected. Identical letters indicate no significant differences (p < 0.05).
concerning the influence on cellular enzymatic system by different carbon source, detailed discussion on the metabolic process for the EPS
formation is difficult currently.
FT-IR SPECTROSCOPY
FT-IR spectroscopy was used as an effective analytical tool to characterize functional groups. Typical IR spectra for the EPS fractions with
three different carbon sources have been compiled
in Figure 2. All samples exhibited similar characteristic peaks, which indicate that they
Figure 1 - Effect of three different carbon sources on biomass (a) and EPS production (b) by P. vaninii Ljup in a 5-L stirred-tank.
mean that these EPS molecules exist much more dispersed in aqueous solution and could form large aggregates (Hwang et al. 2003). This information is important because the functional properties of
polysaccharides can be greatly influenced by the
molecular weight distribution. For each of these moments of the distribution, the root mean square (RMS) radii of the EPSs were calculated (Table II). These data provide a measure of the EPS molecular size in terms of the RMS distance from the molecular center of gravity to its edge (Hwang et al. 2003). Compared with the peaks of glucose and sucrose, the RMS radii for the peak of sucrose ranged from 27.8-51.5 nm was moderate (Table II). The slope for EPS in the double logarithmic plots of RMS radius versus molecular mass was shown in Figure 3. The values of slope of EPS indicated 0.16-0.25, which implies that the EPS molecule exists as a nearly globular shape in aqueous solution (see SEC/MALLS ANALYSIS). The results indicates
that carbon source has more influence on molecular
weight of EPS than their conformation.
ANTIOXIDANT PROPERTIES ANALYSIS
In vitro antioxidant capacities of all EPS fractions
produced by submerged cultivation of P. vaninii
Ljup in the media with selected carbon sources were
subsequently evaluated using different biochemical
methods including DPPH and hydroxyl radical scavenging assays.
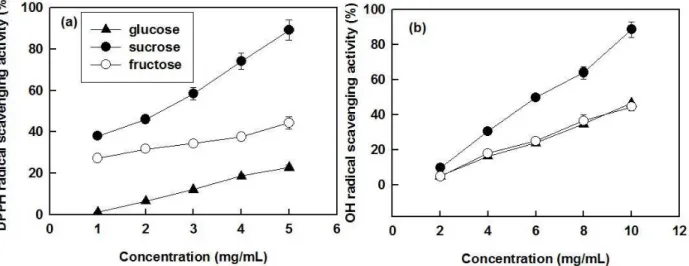
DPPH radical method is widely used as an index to evaluate the antioxidant potential of natural compounds (Cheng et al. 2011). In this experiment, scavenging rates of EPS fractions with various carbon sources depicted in Figure 4a. proved that radical scavenging activity was also concentration dependent. The scavenging activities of EPS with sucrose as carbon source were superior to those observed for other two EPSs irrespective of the
concentration of the fraction (p <0.05), reaching
a maximum of 89.2% at 5 mg/mL. Hydroxyl TABLE II
Relevant molecular parameters of exopolysaccharides of produced by submerged cultivation of P. vaninii Ljup
in the media with selected carbon sources in MALLS analysis.
Parametersa
Carbon sources in the medium
Glucose Fructose Sucrose
Mna
(g/mol) 7.868×10⁴
6.002×10⁴
5.236×10⁴
Mwa
(g/mol) 6.255×10⁵
3.132×10⁵
2.469×10⁵
Mza
(g/mol) 6.878×10⁶
6.128×10⁶
4.160×10⁶
Mw/Mnb
7.950 5.217 4.715
Rnc
(nm) 34.4 22.1 31.9
Rwc
(nm) 32.8 19.6 27.8
Rzc
(nm) 54.4 41.1 51.5
a
Mn, Mw, and Mz refer number-, weight-, z-average molecular weight, respectively.
b
Mw/Mn means polydispersity ratio.
c
Rn, Rw, and Rz refer number-, weight-, z-average square mean radius of gyration, respectively.
Figure 2 - The FT-IR spectra of the EPS fractions produced by submerged cultivation of P. vaninii Ljup in the media with
radicals can react with most natural compounds functioning and induce severe damage to adjacent biomolecules.The results of hydroxyl radical scavenging activities summarized in Figure 4b showed that hydroxyl radical scavenging activities were improved at increasing concentrations of EPS, in good agreement with DPPH radical scavenging
properties. Similarly to previous findings, EPS with
sucrose as carbon source exhibited a promising
antioxidant activity (p <0.05), with a 88.6%. OH
radical scavenging rate at a concentration of 10 mg/
mL. Though the EPS was purified by Sepharose
CL-6B, some metabolites secreted by P. vaninii could
bond covalently with EPS and more purification
and structural elucidation need be carried out. One of the mechanisms involved in antioxidant activity may originate from the hydrogen atom-donating ability of a molecule to a radical, which results in terminating radical chain reactions and converting free radicals to unharmful products (Hu et al. 2000). The antioxidant activity of polysaccharides might be attributed to their hydroxyl groups and other functional groups, such as C=O, –COOH and –O–, which can donate electrons to reduce the radicals to a more stable form or react with the free radicals to terminate the radical chain reaction (Leung et al. 2009). The superior antioxidant activities of EPS fraction with sucrose as carbon source as compared to the other two EPS fractions may be attributed to the
differing molecular properties, i.e. monosaccharide
compositions and molecular size. The larger content of galactose in EPS fraction with sucrose as carbon source could be of relevance to account for the
essentially different antioxidant properties. Chen
et al. (2006) also investigated the EPS of Tremella
mesenterica from submerged cultures with various
carbon sources and found that xylose and glucose were better carbon sources from the viewpoint of immunomodulatory activity.
Figure 3 - The double logarithmic plots of root mean square radius vs molecular mass for exopolysaccharides of produced by submerged cultivation of P. vaninii Ljup in the media with
CONCLUSIONS
The effect of three different carbon sources on EPS
production from the submerged culture of P. vaninii
Ljup was investigated and the three EPSs were
purified and characterized by FT-IR spectroscopy,
GC and SEC-MALLS analysis and their antioxidant activities subsequently compared. The results demonstrated that the molecular properties
and antioxidant activities varies with the different
carbon sources. Sucrose is better carbon source from the viewpoint of antioxidant activity due to the relatively high content of galactose in EPS and moderate molecular size. Thus, the alternate carbon-source strategy may be successfully used for regulation of biosynthesis and activity by P.
vaninii Ljup. Further works on the full structure
elucidation of EPS fractions from different carbon
source by one-dimensional and two-dimensional NMR spectroscopy are in progress in our laboratory.
ACKNOWLEDGMENTS
This work was supported by the National Science Foundation of China (Grant No B060806 and U1604176).
REFERENCES
ASTAFIEVA IV, EBERLEIN GA AND WANG YJ. 1996. Absolute on-line molecular mass analysis of basic fibroblast growth factor and its multimers by reverse-phase liquid chromatography with multi-angle laser light scattering detection. J Chromatogr A 740: 215-229. CHEN NY, HSU TH, LIN FY, LAI HH AND WU JY. 2006.
Effects on cytokine-stimulating activities of EPS from
Tremella mesenterica with various carbon sources.Food Chem 99: 92-97.
CHENG XY, BAO HY, DING Y AND KIM YH. 2011. Free radical scavenging activities of phenolic and flavonoid compounds from fruiting body of Phellinus vaninii. Mycosystema 30: 281-287.
DAI YC. 2010. Hymenochaetaceae (Basidiomycota) in China. Fungal Divers 45: 131-343.
DUBOIS M, GILLES KA, HAMILTON JK, REBERS PA AND SMITH F. 1956. Colorimetric method for determination of sugars and related substances. Anal Chem 28: 350-356. ELOFF JN, KATERERE DR AND MCGAW LJ. 2008. The
biological activity and chemistry of the southern African Combretaceae. J Ethnopharmacol 119: 686-699.
FAN Y, HE X, ZHOU S, LUO A, HE T AND CHUN Z. 2009. Composition analysis and antioxidant activity of polysaccharide from Dendrobium denneanum. Int J Biol Macromol 45: 169-173.
HU C, ZHANG Y AND KITTS DD. 2000. Evaluation of antioxidant and prooxidant activities of bamboo Phyllostachys nigra var. henonis leaf extract in vitro. J Agric Food Chem 48: 3170-3176.
Figure 4 - Antioxidant activity of EPS fractions produced by submerged cultivation of P. vaninii Ljup in the media with selected
HU W, LIU S, ZHANG Y, XUN D AND XU C. 2014. Mycelial fermentation characteristics and antiproliferative activity of Phellinus vaninii Ljup. Phcog Mag 10: 430-434. HWANG HJ, KIM SW, XU CP, CHOI JW AND YUN JW.
2003. Production and molecular characteristics of four groups of exopolysaccharides from submerged culture of
Phellinus gilvus. J Appl Microbiol 94: 708-719.
JUMEL K, FIEBRIG I AND HARDING SE. 1996. Rapid size distribution and purity analysis of gastric mucus glycoproteins by size exclusion chromatography/multi angle laserlight scattering. Int J Biol Macromol 18: 133-139.
KAI A, KIKAWA M, HATANAKA K, KEI MATSUZAKI, MIMURA T AND KANEKO Y. 2003. Biosynthesis of hetero-polysaccharides by Pestalotiopsis microspore from various monosaccharides as carbon source. Carbohydr Polym 54: 381-383.
KHONDKAR P, AIDOO KE AND TESTER RF. 2002. Sugar profile of extracellular polysaccharides from different Tremella species. Int J Food Microbiol 79: 121-129. LEUNG PH, ZHAO S, HO KP AND WU JY. 2009. Chemical
properties and antioxidant activity of exopolysaccharides from mycelia culture of Cordyceps sinensis fungus Cs-HK1. Food Chem 114: 1251-1256.
LIM JM, JOO JH, KIM HO, KIM HM, KIM SW, HWANG HJ AND YUN JW. 2005. Structural analysis and molecular characterization of exopolysaccharides produced by submerged mycelial culture of Collybia maculate TG-1. Carbohydr Polym 26: 296-303.
MAHAPATRA S AND BANERJEE D. 2013. Fungal exopolysaccharide: production, composition and applications. Microbiol Insights 6: 1-16.
SMIDERLE FR, OLSEN LM, RUTHES AC, CZELUSNIAK PA, SANTANA-FILHO AP, SASSAKI GL, GORIN PAJ AND IACOMINI M. 2012. Exopolysaccharides, proteins and lipids in Pleurotus pulmonarius submerged culture using different carbon sources. Carbohydr Polym 87: 368-376.
TANG YJ, ZHU LL, LI DS, MI ZY AND LI HM. 2008. Significance of inoculation density and carbon source on the mycelial growth and Tuber polysaccharides production by submerged fermentation of Chinese truffle Tuber sinense. Process Biochem 43: 576-586.
WANG JL, ZHANG J, ZHAO BT, WANG XF, WU YQ AND YAO J. 2010. A comparison study on microwave-assisted extraction of Potentilla anserine L. Polysaccharides with conventional method: Molecule weight and antioxidant-activities evaluation. Carbohydr Polym 80: 84-93. WASSER SP. 2002. Medicinal mushrooms as a source of
antitumor and immunomodulating polysaccharides. Appl Microbiol Biotechnol 60: 258-274
XIE JH, XIE MY, NIE SP, SHEN MY, WANG YX AND LI C. 2010. Isolation, chemical composition and antioxidant activities of a water-soluble polysaccharide from
Cyclocarya paliurus (Batal.) Iljinskaja. Food Chem 119: 1626-1632.
XIONG YL, XU XQ AND LI J. 2012. Chemical properties and antioxidant activity of exopolysaccharides fractions from mycelia culture of Inonotus obliquus in a ground corn stover medium. Food Chem 134: 1899-1905.
ZHANG M, ZHANG L, CHEUNG PCK AND OOI VEC. 2004. Molecular weight and anti-tumor activity of the water-soluble polysaccharides isolated by hot water and ultrasonic treatment from the sclerotia and mycelia of