Inês Filipa de Oliveira Almeida
Licenciada em Bioquímica
Fighting breast cancer using
membrane-active peptides
Dissertação para obtenção do Grau de Mestre em Mestrado em Bioquímica
Orientador: Professor Doutor Miguel Castanho IMM/FM/UL
Co-orientadora: Doutora Diana Gaspar IMM/FM/UL
Presidente: Prof. Doutor Pedro Tavares Arguente: Doutora Ana Magalhães Vogal: Prof. Doutor Miguel Castanho
Folha de Rosto
Inês Filipa de Oliveira Almeida
Licenciada em Bioquímica
Fighting breast cancer using
membrane-active peptides
Dissertação para obtenção do Grau de Mestre em Mestrado em Bioquímica
Orientador: Professor Doutor Miguel Castanho IMM/FM/UL
Co-orientadora: Doutora Diana Gaspar IMM/FM/UL
Presidente: Prof. Doutor Pedro Tavares Arguente: Doutora Ana Magalhães Vogal: Prof. Doutor Miguel Castanho
III
Copyright
Fighting breast cancer using membrane-active peptides
Copyright © 2015 – Inês Filipa de Oliveira Almeida, Faculdade de Ciências e Tecnologia
e Universidade Nova de Lisboa.
A Faculdade de Ciências e Tecnologia e a Universidade Nova de Lisboa têm o direito,
perpétuo e sem limites geográficos, de arquivar e publicar esta dissertação através de
exemplares impressos reproduzidos em papel ou de forma digital, ou por qualquer outro meio
conhecido ou que venha a ser inventado, e de a divulgar através de repositórios científicos e de
admitir a sua cópia e distribuição com objetivos educacionais ou de investigação, não comerciais,
V
Agradecimentos
Em primeiro lugar gostaria de agradecer ao professor Miguel Castanho, pela
oportunidade de fazer parte de uma equipa de excelência como a sua e pela forma como sempre
me acolheu no seu laboratório.
À Diana Gaspar um enorme obrigada por todo o tempo dedicado e por tudo aquilo que
me ensinou, tanto a nível científico como pessoal. Obrigada por me ter ajudado a crescer a todos
os níveis neste último ano.
A todos os elementos da unidade MCastanho, de um modo especial à Susana pela
grande amiga, companheira, ouvinte e conselheira que se revelou, tenho consciência que sem a
sua presença tinha sido mais difícil. Ao Tiago, por ter sempre uma palavra de incentivo, um
conselho ou um simples sorriso logo pela manhã. À Liliana por estar sempre presente, pela sua
prontidão em ajudar, por tudo aquilo que me ensinou e pela amizade.
Um enorme obrigado a todos os amigos FCTenses que mesmo longe estiveram sempre
presentes com uma palavra de incentivo ou com um simples abraço (muitas vezes virtual), de
um modo especial à Inês, ao João, à Ana, à Mariana e à Aline. À “família” com quem tive a honra
de viver durante os tempos de faculdade e que, apesar da minha ausência neste último ano,
nunca permitiram que deixasse de partilhar das vossas aventuras; obrigada pela vossa amizade
sem fim.
Aos meus amigos de sempre que são essenciais no que toca a “recarregar baterias”, em
especial à Rita por estar sempre presente.
Por último, obrigada à minha família por estar sempre lá quando mais preciso… Ao meu
irmão que tem sido muito mais que um braço direito, a todos os níveis, no meu percurso
académico. Aos meus pais, pelo apoio incondicional, pelo esforço que fazem diariamente para
que tudo isto seja possível e pela força e coragem que sempre me transmitiram.
VII
Resumo
O cancro continua a ser uma das principais causas de mortalidade. As terapias
existentes apresentam limitações que contribuem para uma reduzida taxa de sucesso no
tratamento. Uma alternativa promissora a este problema consiste na possibilidade de utilizar
péptidos antimicrobianos (AMPs) no combate ao cancro.
Este trabalho teve como objetivos avaliar a capacidade citotóxica de três AMPs contra
células de cancro de mama, a seletividade relativamente a células saudáveis e ainda
compreender o mecanismo de ação.
Por determinação da citotoxicidade dos péptidos (pepR, HNP-1 e PvD1), recorrendo à
redução do sal de tetrazólio MTT, na presença de cada linha celular (MDA-MB-231 e MCF 10A)
verificou-se que tanto o pepR como o PvD1 são seletivos a células cancerígenas, requerem
menor concentração para inibir 50% da população (IC50), comparativamente às saudáveis.
Contrariamente, o HNP-1 não mostrou ser um péptido anticancerígeno (ACP) promissor dado
que induz a morte celular de igual forma para ambas as linhas celulares.
Realizaram-se estudos de potencial-zeta para avaliar alterações à superfície das células
induzidas por interações péptido-célula. Contrariamente ao descrito quando atuam como AMPs,
pepR e HNP-1 não requerem neutralização da superfície celular.
Com base nos resultados anteriores, o PvD1 revelou-se o mais promissor dos péptidos
e consequentemente estudou-se a sua ação por microscopia de força atómica (AFM). Esta
técnica permitiu avaliar os perfis de altura bem como a rugosidade da superfície celular quando
submetida a diferentes concentrações de PvD1. Observou-se que não ocorrem alterações
significativas da altura das células associadas ao aumento da concentração de péptido. Por outro
lado, ao avaliar a rugosidade nas diferentes regiões celulares verifica-se que em algumas delas
surgem alterações associadas ao aumento de PvD1.
Embora não seja possível propor o mecanismo de ação para estes ACPs pode
concluir-se que tanto o PvD1 como o pepR são promissores no combate do cancro de mama.
Palavras-chave: péptidos anticancerígenos; cancro de mama; carga superficial da membrana;
IX
Abstract
Cancer is still one of the major death causes worldwide demanding an urgent search for
new therapies that combine selectivity, efficacy and ability to avoid resistance by cancer cells.
One of the biggest advances in anticancer therapy is the use of antimicrobial peptides’ (AMPs)
as chemotherapy drugs since some of them showed both antimicrobial activity and selective
anticancer activity.
In this work, the anticancer activity of three different AMPs, pepR, HNP-1 and PvD1, was
tested against cancer and non-tumorigenic breast cell lines (MDA-MB-231 and MCF 10A).
The cytotoxic activity of each peptide was evaluated by MTT tetrazolium assay and the
determination of the half maximal inhibitory concentration (IC50), and showed that pepR and PvD1
act as anticancer peptides (ACPs), able to select between cancer and non-tumorigenic cells,
whereas HNP-1 is not a promising ACP once it is not selective, killing both cell lines at the same
concentration. Then, zeta-potential was used to evaluate the peptide-cell interaction and its effect
in cells’ surface charge. In this case, surface neutralization is not required before cell death,
contrary to what happens when these peptides act like AMPs.
Finally, according with previous results, PvD1 was chosen as the most promising peptide
and, as such, used for imaging assays with atomic force microscopy (AFM). With this technique
height profiles and surface roughness were evaluated for both cell lines in absence and presence
of three different PvD1 concentrations. It was concluded that, with the increase of peptide
concentration there are no significant changes in cell’s height profiles. On the other hand, when
analysed separately, nucleus and cytoplasm present surface roughness changes associated to
the increasing of PvD1 concentration.
Although it is not yet possible to propose a mechanism of action, both pepR and PvD1
are efficient against MDA-MB-231 cells and selective to MCF 10A cells.
Keywords: Anticancer peptide; breast cancer; membrane surface charge; atomic force
XI
1. Index
Agradecimentos ... V
Resumo ... VII
Abstract ... IX
1. Index ... XI
2. List of Figures ... XIII
3. List of Tables ... XVII
4. Abbreviations and Symbols ... XIX
1. Introduction ... 1
1.1. Antimicrobial peptides ... 1
1.2. Anticancer peptides ... 3
1.3. pepR – a peptide from dengue virus ... 4
1.4. HNP-1 – a human defensin ... 4
1.5. PvD1 – a plant defensin ... 5
1.6. From healthy to cancer cells ... 6
1.7. Cell viability ... 7
1.8. Zeta-Potential ... 8
1.9. Atomic Force Microscopy ... 10
1.10. Objectives ... 12
2. Materials and Methods ... 13
2.1. Reagents ... 13
2.2. Peptides ... 13
2.3. Biological material ... 14
2.4. Cell Culture ... 14
XII
2.6. Zeta Potential measurements ... 16
2.7. Atomic Force Microscopy ... 16
2.8. Statistical analysis ... 17
3. Results and Discussion ... 19
3.1. Peptides’ Cytotoxic Activity ... 19
3.2. Characterization of cells’ membrane surface charge ... 22
3.3. AFM imaging of human breast cells ... 26
3.4. PvD1 effects on cell’s height ... 29
3.5. Surface roughness as indicator of cell’s homeostasis ... 31
4. Conclusions and Perspectives ... 37
XIII
2. List of Figures
Figure 1.1 – Proposed mechanisms of membrane disruption by antimicrobial peptides (AMPs). a.
Barrel-stave mechanism in which peptides enter perpendicularly to the membrane. b. Carpet
mechanism, where the AMPs adsorb parallel to the outer leaflet which leads to membrane’s loss
of integrity. c. Toroidal pore mechanism is described initially as a carpet model but, after reaching
the threshold concentration, AMPs change their orientation relative to the membrane establishing
the continuity between inner and outer leaflets. Finally, the d. disordered toroidal mechanism is
also described by the formation of a pore but in this case AMPs adopt different orientations that
could contribute to a not well structured pore (From reference [21]). ... 3
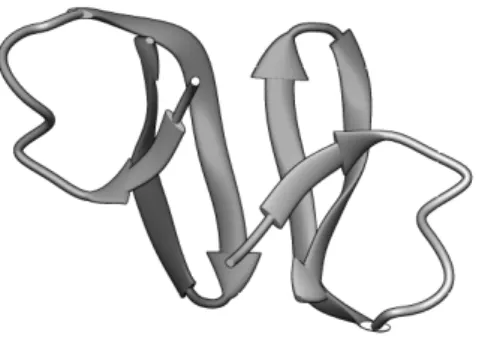
Figure 1.2 – 3D representation of pepR structure obtained from DENV C protein monomer (PDB
code: 1R6R). The conformational representation was done with Chimera software. ... 4
Figure 1.3 – 3D representation of HNP-1 monomer structure. The representation was done with
Chimera software using the PDB code 3GNY. ... 5
Figure 1.4 – Reduction of MTT tetrazolium into formazan crystals by NADH. Structures were
obtained using ChemBioDraw software. ... 8
Figure 1.5 – Schematic representation of different layers surrounding a charged particle and the
region where zeta-potential can be calculated (Adapted from [66]). ... 9
Figure 1.6 – Schematic representation of atomic force microscope (AFM) (From reference [75]).
... 10
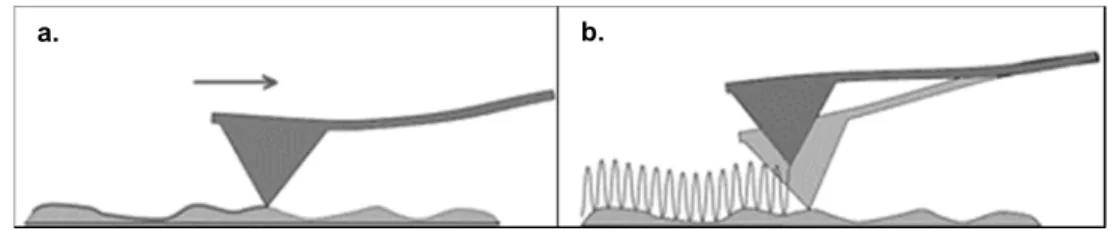
Figure 1.7 – Representation of the most currently used AFM imaging modes. a. Contact mode
and b. tapping mode (Adapted from reference [77]). ... 11
Figure 1.8 – Examples of AFM tip or cantilever functionalization to improve sensitivity and
specificity. a. The biological modification is described by a tip functionalization with a biological
molecule using a linker such as an antibody or a ligand. b. For chemical modification the AFM tip
is directly functionalized with chemical groups. c. In the single-cell force spectroscopy the tip is
replaced by a living cell which is attached to the AFM cantilever (Adapted from references [72],
[80]). ... 11
Figure 3.1 – Cytotoxic activity assays of pepR (a.), HNP-1 (b.) and PvD1 (c.) against breast cancer
cells (MDA-MB-231). The cytotoxicity of each peptide was assessed 24 hours after peptide’s
addition using a MTT assay. Error bars represent the standard deviation of at least three
independent experiments. ... 20
Figure 3.2 - Cytotoxic activity assays of pepR (a.), HNP-1 (b.) and PvD1 (c.) against
XIV
peptide’s addition using a MTT assay. Error bars represent the standard deviation of at least three
independent experiments. ... 21
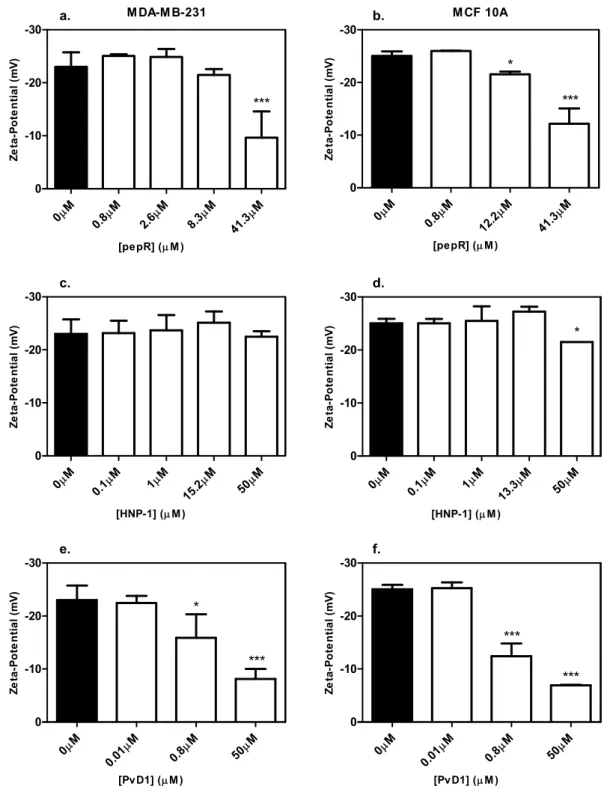
Figure 3.3 – Zeta-potential of MDA-MB-231 (left column a., c. and e.) and MCF 10A (right column
b., d. and f.) in the presence of pepR (a. and b.), HNP-1 (c. and d.) and PvD1 (e. and f.). Cell
suspension of 1x10⁵cells/ml was stabilized for 30 minutes with different concentrations of peptide
and the zeta-potential was measured at 37oC. Error bars represent the standard deviation of at
least two independent experiments. As statistical analysis a one-way ANOVA followed by a Tukey
post-test was used. * 0.01 < p-value < 0.05; *** p-value < 0.0001. ... 24
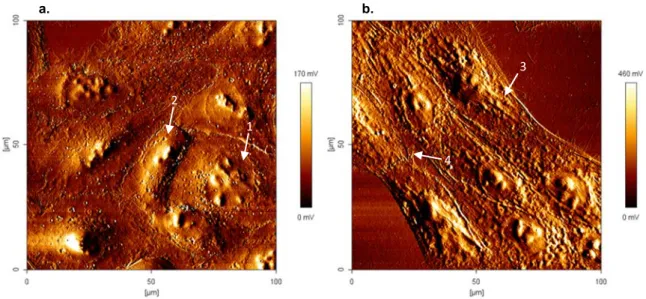
Figure 3.4 – Atomic force microscopy error images (100 x 100 µm) of MDA-MB-231 (a.)
(1x10⁴cells/ml) and MCF 10A cells (b.) (1x10⁵cells/ml) (100 x 100 µm), and respective colour
scales at right, in absence of PvD1. 1 and 2 indicate a round and pointy shape nucleus of cancer
cells, respectively. 3 indicate some structures present in cytoplasm through the membrane and 4
the formation of pseudopodia. ... 26
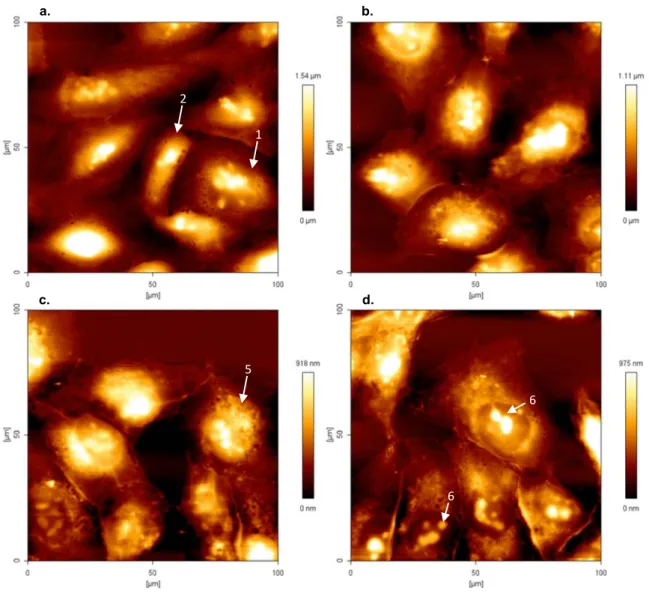
Figure 3.5 – Atomic force microscopy height images of MDA-MB-231 cells (1x10⁴cells/ml) (100 x
100 µm), and respective colour scales at right, in absence (a.) and presence of different
concentrations of PvD1, (b.) 0.01 µM, (c.) 0.8 µM and (d.) 50 µM after 24 hours of incubation. 1
and 2 indicate a round and pointy shape nucleus of cancer cells, respectively. 5 indicate the
increasing of roughness in the perinuclear region and 6 the nucleoli inside the nucleus. ... 27
Figure 3.6 - Atomic force microscopy height images of MCF 10A cells (1x10⁵cells/ml) (100 x 100
µm), and respective colour scales at right, in absence (a.) and presence of different
concentrations of PvD1, (b.) 0.01 µM, (c.) 0.8 µM and (d.) 50 µM after 24 hours of incubation. 3
indicate some structures present in cytoplasm through the membrane and 4 the formation of
pseudopodia. ... 28
Figure 3.7 – Representative cell’s cross sections and height profiles. MDA-MB-231 in absence
(a.) and presence (b.) of 0.8 µM of PvD1 with the respective acquired height profile for both cells
(c.) in absence (white) and presence (grey) of PvD1. MCF 10A in absence (d.) and presence (e.)
of 0.8 µM of PvD1 and respective height profile for both cells (f.) represented with the same
colours. ... 30
Figure 3.8 – MDA-MB-231 (a.) and MCF 10A (b.) cell’s height in absence and presence of
different concentrations of PvD1. Error bars represent the standard deviation of at least two
independent experiments. As statistical analysis a one-way ANOVA followed by a Tukey
post-test was used. ** 0.0001 < p-value < 0.01. ... 31
Figure 3.9 - Surface root-mean-square roughness (Rms) average of MDA-MB-231 (left column a.,
c. and e.) and MCF 10A cells (right column b., d. and f.) in different cell regions: nucleus (a. and
b.), cytoplasm (c. and d.) and perinuclear region (e. and f.), respectively. The average roughness
XV
bars represent the standard deviation of at least two independent experiments. As statistical
analysis a one-way ANOVA followed by a Tukey post-test was used. ** 0.0001 < p-value < 0.01;
*** p-value < 0.0001. ... 33
Figure 3.10 - Surface root-mean-square roughness (Rms) average of MDA-MB-231 (left) and MCF
10A (right) as a whole cells. The Rms value was obtained as the average of all 2.5 x 2.5 µm2
squares analysed (from nucleus, cytoplasm and perinuclear region). Error bars represent the
standard deviation of at least two independent experiments. As statistical analysis a one-way
ANOVA followed by a Tukey post-test was used. * 0.01 < p-value < 0.05. ... 34
XVI
XVII
3. List of Tables
Table 3.1 - IC50 values and respective standard deviation of each peptide in the presence of breast
cancer cells and non-tumorigenic breast cells which are determined from the cytotoxic assays.
NA, “not applicable”. ... 21
Table 3.2 – Zeta-potential or electrophoretic mobility values of different healthy and cancer cells
according to several authors. ... 23
Table 3.3 – Average of cells height and respective standard deviation after incubation with PvD1
peptide. ... 31
Table 3.4 – Average of surface root-mean-square roughness (Rms) of MDA-MB-231 and MCF
10A cells in absence and presence of different PvD1 concentrations. ... 32
Table 3.5 - Average of surface root-mean-square roughness (Rms) of MDA-MB-231 and MCF 10A
XIX
4. Abbreviations and Symbols
ε Dielectric constant
Ζ Zeta-potential
η Viscosity
ACP Anticancer peptide
AFM Atomic Force Microscopy
AMP Antimicrobial peptide
ATCC American Type Culture Collection
ATP Adenosine triphosphate
BCEC Brain Capillary Endothelial Cells
BPE Bovine Pituitary Extract
DMEM Dulbecco's Modified Eagle Medium
DMSO Dimethyl sulfoxide
f (κа) Henry’s function
FBS Fetal Bovine Serum
HUVEC Human Umbilical Vein Endothelial Cells
IC50 Half maximal inhibitory concentration
MCF7 Human breast cancer cells
MCF 10A Non-tumorigenic breast cells
MDA-MB-231 Human breast cancer cells
MEBM Mammary Epithelial Basal Medium
MOLT-4 Human acute lymphoblastic leukaemia
MTS
3-(4,5-dimethylthiazol-2-yl)-5-(3-carboxymethoxyphenyl)-2-(4-sulfophenyl)-2H-tetrazolium
XX MW Molecular weight
NADH Nicotinamide adenine dinucleotide
NADPH Nicotinamide adenine dinucleotide phosphate
OSCC Oral squamous cell carcinoma
PBS Phosphate Buffered Saline
PC Phosphatidylcholine
PC-3 Human prostate adenocarcinoma
PE Phosphatidylethanolamine
PI Phosphatidylinositol
PS Phosphatidylserine
RBC Red blood cells
RCC Renal cell carcinomas
rhEGF Epidermal Growth Factor human recombined
Rms Root-mean-square roughness
SM Sphingomyelin
TFA Trifluoroacetic acid
UE Electrophoretic mobility
UV Ultraviolet
XTT 2,3-Bis-(2-Methoxy-4-Nitro-5-Sulfophenyl)-2H-Tetrazolium-5-Carboxanilide
1
1. Introduction
Cancer is still among the leading causes of mortality and morbidity around the world [1].
Despite numerous recent advances in treatment alternatives, the number of cancer cases is
increasing as a result of aging, population growth and the increasing of some lifestyle choices
such as smoking and physical inactivity. Breast and lung cancers are the most common diagnosis
in females and males, respectively [2]–[4]. Although, “cancer” refers, in fact, to over 100 different
diseases, all of their forms are commonly described as an abnormal cell growth which is able to
invade other tissues and form a tumour mass, new vessels and spread through the body as
metastasis [5], [6]. Surgery, chemotherapy and radiotherapy are the most used treatments
against cancer, however, all of them present a low success rate and, reoccurrence risk [6], [7].
Chemotherapeutic agents are the most used treatment, especially, in case of advanced or
metastatic disease [7]. However, there are many problems associated with this therapy as well
as the inability to deliver the correct amount of drug directly to cancer cells (without affecting
healthy cells and tissues) and, chemical resistance [4]–[6], [8]. Furthermore, chemotherapy is also
responsible for some side-effects mainly induced in healthy cells which also divide rapidly, such
as, decrease in production of blood cells (myelosuppression), inflammation of the digestive tract
lining (mucositis) and hair loss (alopecia) [9]. In order to avoid drug resistance and all side effects
associated to the currently used therapies many efforts have been made towards the
development of a new class of anticancer drugs [2], [7], [9].
1.1. Antimicrobial peptides
Since the discovery of antiobiotics in 1930s that its inappropriate, excessive and irrational
use has reduced their efficiency, induced increasing rates of antibiotics resistance and
consequently became a public health problem worldwide [4], [10]–[12]. With the growing problem
of resistance to conventional antibiotics, arises an urgent demand for novel antimicrobials and
consequently the increasing interest in pharmacological applications of antimicrobial peptides
(AMPs) as human therapeutics [6], [11], [13].
AMPs are produced by many organisms and are described as important components of
innate host defence to prevent the infection by microbial pathogens [4], [14], [15]. In addition,
more recently, these peptides have also been synthesized or produced by genetically engineered
microorganisms in order to improve their bioavailability and stability, as well as reduce their amino
acid sequences [13], [16]. AMPs are defined as being generally small and amphipathic molecules.
Their sequence length ranges from 12 to 100 amino acid and is composed, in elevated proportion,
by cationic and hydrophobic residues. The net charge of these peptides may vary from +2 to +9
2
According to their structure, AMPs can be classified into four groups: α-helical, β-sheet,
extended and looped peptides [18]–[21]. The α-helical AMPs are usually unstructured in aqueous
solution and, in membranes, form amphipathic helices. The β-sheet peptides are stabilized by
two to four disulfide bonds, which form relatively rigid structures [20]. The extended AMPs have
no regular secondary structure but are rich in specific amino acids such as proline, tryptophan
arginine and/or histidine [19]. Finally, the loop peptides, as the name suggests, adopt a loop
formation with only one disulfide bond [19], [20], [22].
The AMPs’ ability to rapid and strongly interact with lipidic membranes through
non-specific interactions, namely with microbial membranes, makes them promising candidates for a
new generation of antibiotics free of microbial resistance. However, the capacity of disrupting and
permeate cell’s membrane is dependent on the biophysical properties, such as, amphipathicity,
size, net charge and secondary structure [4], [14].
There are several mechanisms of action proposed to explain the AMPs’ mode of action,
but the first steps are common to all of them. Cationic AMPs starts to target the negatively charged
microbe’s membrane by an electrostatic interaction [6], [22]. This interaction has to continuously
occur until it reaches the minimum concentration to be effective, named as threshold
concentration, as shown in Figure 1.1 [21]. Once the threshold concentration is reached, one of
the proposed mechanisms of action occurs. Some of these mechanisms are describe below [6],
[21], [22].
The barrel-stave mechanism (Figure 1.1 a.) can be simply described as a transmembrane
pore hydrophilic formation by AMPs. This mode of action involves four major steps. Peptides bind
to the membrane’s surface as monomers and changes its conformation to a transition phase,
which the polar-phospholipid head groups induce localized membrane thinning. After that, the
peptide’s hydrophobic part is inserted into the membrane and the pore formation starts. Finally,
the last step of this process consists in a continued recruitment of peptides to increase the pore
size [22], [23].
In carpet mechanism (Figure 1.1 b.), as previously described, peptides adsorb to the
membrane surface through electrostatic interactions, bind to the phospholipid head groups and
start covering it in a carpet-like manner. After reaching the threshold concentration, AMPs insert
and permeate the cell membranes inducing the loss of integrity or, in the case of continuous
permeation, can leading to micellization [22]–[24].
As the carpet mechanism, the toroidal pore mechanism starts with peptides oriented
parallel to the membrane (Figure 1.1 c.). The hydrophobic region of peptides start their entry in
the hydrophobic core of the membrane leading to a local membrane curvature. At the threshold
concentration the peptides change their orientation relative to the membrane becoming
perpendicular and the continuity between inner and outer leaflets is established [6], [14], [21],
3
Finally, the disordered toroidal pore mechanism is a recent modification of the previously
presented toroidal pore mechanism (Figure 1.1 d.). As the name suggests, the pores formed are
significantly more irregular than the previous model, the peptides are largely disordered and adopt
different orientations. These features could contribute to a not well structured pore [21], [25], [26].
Besides their natural functions as part of the innate immune defence mechanism and their
main application as a new generation of antibiotics, AMPs are also attracting attention as
alternatives to food additives or anticancer drugs [13].
Figure 1.1 – Proposed mechanisms of membrane disruption by antimicrobial peptides (AMPs). a. Barrel-stave mechanism in which peptides enter perpendicularly to the membrane. b. Carpet mechanism, where the AMPs adsorb parallel to the outer leaflet which leads to membrane’s loss of integrity. c. Toroidal pore mechanism is described initially as a carpet model but, after reaching the threshold concentration, AMPs change their orientation relative to the membrane establishing the continuity between inner and outer leaflets. Finally, the d. disordered toroidal mechanism is also described by the formation of a pore but in this case AMPs adopt different orientations that could contribute to a not well structured pore (From reference [21]).
1.2. Anticancer peptides
The increasing interest in AMPs as a new generation of antibiotics, arose. However,
recent studies showed that a significant number of these peptides also exhibit cytotoxic activity
against cancer cells [4], [6], [7]. This class of antimicrobial peptides is described as small
molecules with an efficient tissue penetration and uptake by cancer cells [4], [7], [8]. As in AMPs,
there are some proposed mechanisms of action that can be also applied to ACPs, namely carpet
4
Anticancer peptides can be classified into two major groups, peptides which are highly
potent against bacteria and cancer cells but not to healthy mammalian cells, and peptides that
are cytotoxic for bacteria, cancer and normal cells [4], [6], [24]. ACPs’ ability to differentiate
between cancer and healthy cells is still unknown but some authors propose that this selectivity
is associated with both peptide characteristics and target membrane features [4], [27], [28].
1.3. pepR – a peptide from dengue virus
pepR (LKRWGTIKKSKAINVLRGFRKEIGRMLNILNRRRR – residues 67–100 of
DENV-2 C protein) is a novel peptide with 35 amino acids, derived from the putative RNA-binding domain
of the dengue virus’ capsid protein [29], [30]. This peptide has a molecular weight of 4278.2 Da
[30] and a positive charge of +12 (at pH 7.4) [29]. In water, pepR acquires a random coil
conformation, whereas in membranes tend to form a single long α-helix [31] (Three dimensional
(3D) structure represented in Figure 1.2).
This peptide was classified as an effective antimicrobial agent since it was able to inhibit
E. coli growth even at micromolar concentrations [29]. Furthermore, the weak interaction of this peptide with zwitterionic lipids [32] could be a promising feature of peptide’s selective ability
between different cells.
Figure 1.2 – 3D representation of pepR structure obtained from DENV C protein monomer (PDB code: 1R6R). The conformational representation was done with Chimera software.
1.4. HNP-1 – a human defensin
Defensins are one of the most characterized families of antimicrobial peptides found in
different living organisms [33]. These peptides are an important component of innate immune
system and are able to kill or eliminate a wide variety of fungi, enveloped virus, protozoans,
Gram-negative and Gram-positive bacteria [33]–[35]. Furthermore, this family of AMPs also present
different functions in numerous cellular processes such as cell division, wound healing, attraction
and maturation of immune cells and differentiation and reorganization of epithelial tissues [34],
5
Defensins are small peptides, positively charged at physiological pH with 29 to 45 amino
acid residues. These AMPs have six conserved cystein residues (cys) which form three
intramolecular dissulfide bridges and their molecular weight ranges from 3.5 to 6.5 kDa [6], [34].
The defensin family further comprises three sub-families, namely, α-, β- and θ-defensins [35],
[37].
The Human Neutrophil Peptides (HNP 1-4) [34] are produced in azurophil granules of
neutrophils and belong to the α-defensins sub-family [38], [39]. The HNP-1
(ACYCRIPACIAGERRYGTCIYQGRLWAFCC) [17], with 30 amino acid residues and a molecular
weight of 3442 Da, is one of the most abundant and studied α-defensin. In solution, this peptide
is arranged as a dimer and each monomer present a positive charge of +3 conferred by 4 arginine
residues and a negative glutamic acid (3D structure represented in Figure 1.3) [17], [40]. With the
increasing interest in these defensins some authors have concluded that HNP-1 may be
expressed in order to modulate tumour progression, such as described by Müller et al [41] in renal
cell carcinomas (RCC). Others authors confirm the cytotoxic effect against cancer cells [42], [43]
whereas McKeown et al [39] already confirmed this effect in both oral squamous cell carcinoma
(OSCC) and normal oral keratinocytes, showing that HNP-1 has no selectivity between cancer
and healthy cells.
Figure 1.3 – 3D representation of HNP-1 monomer structure. The representation was done with Chimera software using the PDB code 3GNY.
1.5. PvD1 – a plant defensin
Like animals, plants also have AMPs as part of its innate immune system, defensins being
the major constituent [44], [45]. Plant defensins have 45 to 54 amino acid residues, a positive
charge, a molecular weight between 5 and 7 kDa [46] and commonly four disulfide bonds which
are responsible for the stabilization of the 3D structure (three anti-parallel β-strands and one α
-helix) [44], [47].
6
confirmed [48]. According to Games et al [44] the molecular mass of PvD1 is approximately 6
kDa and was obtained by an SDS-Tricine gel electrophoresis.
1.6. From healthy to cancer cells
Although the human body is made of so many different organs, cell tissues can be divided
in four main different categories according to their morphology: epithelial, connective, muscular
or nervous tissues [49]. Cells of the epithelial tissue are characterized by being contiguous, joined
by cell-to-cell junctions and organized as layers that cover the entire body and lining cavities, tubs
and ducts. The cells that make up the muscular tissue are described by a large amount of
contractile proteins in their cytoplasm, such as actin and myosin and are responsible for the
movement of the whole body [49]. The nervous tissue is made up of neurons which are
specialized in transmit and integrate electrical impulses to receive and process information, both
from the inside and outside the body. The connective tissue is characterized by its extracellular
matrix and underlies or supports the other three tissues previously described [49]. Epithelial tissue
is the most important in this work once it is responsible for the most common human cancers,
carcinoma [50].
The transformation process of healthy cells in cancer can be described as a multi-step
process [50]. In the first step, an abnormal growth starts with only a minimal deviation from healthy
cells, which is termed hyperplasia, when is induced by only one type of cells, or metaplasia, if the
deviation is induced by cells of another type. The second step, named dysplasia, is when
individual cells lose their normal appearance and cytological changes arise, such as variability in
nucleus size and shape. The dysplastic tissue is described as a transition state between a benign
and premalignant growth [50]. The third step is described by the formation of new types of tissue,
both benign and malignant, and is termed neoplasia. In the last step of this transformation
process, cancer cells acquire the ability of invade other tissues through the process of metastasis
[50]. The metastases use the blood and lymph vessels to travel through the body and colonize
new organs at distant sites [51].
Besides all transformation processes previously described, the most important difference
between healthy and cancer cells focuses in plasma membranes. Healthy mammalian cells are
mainly composed of zwitterionic phospholipids such as phosphatidylethanolamine (PE),
phosphatidylcholine (PC) and sphingomyelin (SM). Additionally, these cells have high contents of
cholesterol which acts as a protective molecule by altering the membrane fluidity, reducing
membrane elasticity, blocking the entry of peptides and increasing their mechanical strength as
well as their lipid packing [4], [6], [28], [52].
On the other hand, cancer cells’ membrane, like in bacteria, are characterized by a slightly
more negative charge than normal cells [4], [22], [53], [54] which is induced by the presence of
7
(PG) or cardiolipin (CL). Furthermore, the abundant microvilli and the low contents of cholesterol
in cells’ surface tends to increase the fluidity which, together with the cationicity of peptides,
facilitate the electrostatic interactions between ACPs and cells membrane [4], [9], [28], [53].
There are different types of cell death which play an important role in several biological
processes, among them stands out apoptosis and necrosis. Apoptosis is described as a
programmed cell death that affects individual cells and is characterized by a decreasing in its
volume, chromatin condensation, membrane blebbing and the formation of apoptotic bodies [55].
On the other hand, necrosis is an unprogrammed cell death that occurs due to extreme
physiological conditions [55], [56]. It can be described by an increasing in cell volume,
fragmentation of the chromatin and appearance of mitochondria with an aberrant morphology
[55], [57], [58].
1.7. Cell viability
There are a variety of assay methods that can be used to estimate the metabolic activity
of cells such as tetrazolium reduction, resazurin reduction and ATP detection [59]. Different
tetrazolium compounds as (4,5-dimethylthiazol-2-yl)-2,5-diphenyltetrazolium bromide (MTT),
3-(4,5-dimethylthiazol-2-yl)-5-(3-carboxymethoxyphenyl)-2-(4-sulfophenyl)-2H-tetrazolium (MTS),
2,3-Bis-(2-Methoxy-4-Nitro-5-Sulfophenyl)-2H-Tetrazolium-5-Carboxanilide (XTT) and
2-(4-Iodophenyl)-3-(4-nitrophenyl)-5-(2,4-disulfophenyl)-2H-tetrazolium (WST-1) have been
commonly used [60]. In this case, a MTT tetrazolium reduction assay was used to evaluate the
cytotoxicity of each peptide against human breast cells. Despite the variety of tetrazolium
compounds, MTT was chosen since it can rapidly penetrate viable cells as well as can be
metabolized by most cell types [59].
When metabolic active cells are in contact with MTT solution a reduction of a soluble
tetrazolium into insoluble formazan crystals, by NADH or NADPH, occurs (Figure 1.4). The
amount of formazan product formed (which is directly proportional to the number of viable cells)
is quantified by absorbance reading. Nikkhah [61] concluded that the optimal wavelength for the
formazan solution, in DMSO, is at 550 nm.
Initially, it was proposed that MTT is reduced only by active mitochondria in viable cells.
However, later it was found that other cellular organelles were also able to reduced MTT [62].
Additionally, according to Liu [63], the subcellular fractions as nuclear, mitochondrial, microsomal
and cytosolic can reduce MTT to formazan crystals in presence of NADH or NADPH. First the
formazan product was deposited predominantly in a perinuclear region of the cytoplasm and then,
with a longer incubation time, the insoluble product of MTT reduction also appears at the cell
8
Figure 1.4 – Reduction of MTT tetrazolium into formazan crystals by NADH. Structures were obtained using ChemBioDraw software.
1.8. Zeta-Potential
Light-scattering techniques, such as static light scattering (SLS), dynamic light scattering
(DLS) or zeta-potential, are non-invasive methods which enables studying the mechanisms of
action of membrane active peptides at the molecular level. These techniques are useful as tools
to determine size, average molecular weight (Mw), aggregation behaviour of peptides in solution
(alone or with lipid membranes) and surface charge of particles in suspension in an aqueous
environment [64].
Zeta-potential, the most recent light-scattering technique, could be described as a
physical property exhibited by any particle in suspension [65]. As can be seen in Figure 1.5, a
charged particle in suspension uses an electrostatic potential to attract ions with opposite charge
to its surface producing a rearrangement of local free ions in solution and a strong bound ion layer
which covers the particle’s surface. This is commonly described as inner region or Stern layer. A
second layer, outside the Stern layer, is also formed, which is given the name of outer region or
diffuse layer and is described as a region where the ions are less firmly associated [64]. When an
electric field is applied to the solution, charged particles are attracted to the electrode of the
opposite charge inducing their movement. Consequently, ions strongly bound from Stern layer
will move with it, whereas the ions present in the diffuse layer are not able to move with the
particles and stay with the bulk dispersant. The zeta-potential corresponds to the potential formed
9
Figure 1.5 – Schematic representation of different layers surrounding a charged particle and the region where zeta-potential can be calculated (Adapted from [66]).
The zeta-potential of particles and their electrophoretic mobility are related by the Henry equation
[64], [67]:
2 а
3 ( 1 )
where UE is the electrophoretic mobility, z the zeta-potential, ε the dielectric constant, η
the viscosity and f(κа) the Henry’s function. Henry’s function value varies according to the media
in which the particles lie. When the particles are suspended in aqueous solutions, according to
Smoluchowski approximation, the f(κа) value is 1.5, whereas, if the particles are in a nonaqueous media (Huckel approximation) the value of this function is 1.
Despite the use of zeta-potential in so many applications already described as science
and engineering, it is also a useful tool that could be applied in different industries like
pharmaceutical or food, in order to for example, characterize particles’ physical properties or
10
1.9. Atomic Force Microscopy
In 1986 Binnig and Quate proposed a new method based on a different type of
microscope able to investigate surfaces at the atomic scale which was named atomic force
microscope (AFM) [69]. The atomic force microscope is very different from the other microscopies
once the image is not obtained by focusing light or electrons on a surface as seen in optical or
electron microscopy [70]. According to the Figure 1.6, a sensitive and flexible cantilever, with a
sharp tip at the end, scans the surface of the sample and measures its interactions with the tip,
in particular, measures the force between atoms from the sample and those of the tip [71]–[73].
On the opposite face of cantilever (relative to the tip) there is an incident laser which is reflected
in a photodiode. A piezoelectric support is responsible for the movement of the cantilever on xy
plane and, at the same time, allows z-axis movements by feedback. All the interactions between
the tip and the samples will induce bending or twisting of the cantilever, proportional to the
interaction force, which will vary the laser reflection point and hence the point of incidence in the
photodiode. All the deflections are monitored during the scan and will be translated into a
three-dimensional image of the height of the sample’s surface [71]–[74].
Figure 1.6 – Schematic representation of atomic force microscope (AFM) (From reference [75]).
The AFM has different imaging modes which are chosen depending on the application or
the sample’s nature. The most currently used are contact and tapping modes (Figure 1.7 a. and
b. respectively). Contact mode, the older but frequently used, is described by a tip scanning the
sample with a constant force usually between 10-7 and 10-12 N [71]. The biggest advantage of this
11
limitations such as sample deformation during the scanning, sample damage caused by dragging
of part of the sample or tip damage/change by scanning process [71], [73], [76].
The tapping (or intermittent) mode (Figure 1.7 b.) is more recent and also able to deliver
high resolution images reducing the damages caused by the tip. The tapping mode imaging
consists in oscillating the cantilever with a predefine frequency (typically at its resonant
frequency), amplitude and height baseline. When the cantilever approaches to the surface
sample, an interaction between them occurs and changes the oscillation parameters. This
mechanism reduces the effects of friction or drag forces but have also limitations since it has
proved more challenging when used in liquids and, comparing with contact mode, the scan’s
speed is slower [71], [76].
Figure 1.7 – Representation of the most currently used AFM imaging modes. a. Contact mode and b. tapping mode (Adapted from reference [77]).
As an improvement of sensitivity and specificity of molecular interaction, the tips can be
modified (Figure 1.8 a. and b.). The tips that are functionalized with a specific chemical functional
group, molecule or macromolecules enables measuring probe-sample forces as well as allows
distinguish between sample’s regions with different chemical structures and functionalities [78].
More recently, rather than tip, a living cell can be attached to the AFM cantilever (Figure 1.8 c.),
allowing the study of cell-cell or cell-substrate interactions [79].
Figure 1.8 – Examples of AFM tip or cantilever functionalization to improve sensitivity and specificity. a. The biological modification is described by a tip functionalization with a biological molecule using a linker such as an antibody or a ligand. b. For chemical modification the AFM tip is directly functionalized with chemical groups. c. In the single-cell force spectroscopy the tip is replaced by a living cell which is attached to the AFM cantilever (Adapted from references [72], [80]).
a. b.
12
About 90% of the AFM applications belong to different areas such as physics,
nanotechnology, life sciences and industry, however, art conservation, food science or geology
have also used AFM, although with less impact [81].
1.10. Objectives
The main goal of this work consists in evaluating the cytotoxic activity of three different
AMPs against human breast cancer cells as well as their selectivity towards healthy and cancer
cells. In addition, after proving their anticancer activity, the mechanism of action of these peptides
when act as ACPs were evaluate.
In the first step of this work, the cytotoxic activity of each peptide against cancer and
healthy cells was evaluated with a MTT tetrazolium assay. Then, the effect of each peptide in the
surface charge membrane of both cell types was evaluated using zeta-potential techniques. The
best among the three different anticancer peptides will be chosen and used for AFM imaging
studies against both cell lines. The goal of these studies is to evaluate the effect induced by ACP
13
2. Materials and Methods
2.1. Reagents
NaCl, KCl, Na2HPO4 and KH2PO4 were used for phosphate buffered saline (PBS 1X)
preparation and obtained from Merck. Fetal Bovine Serum (FBS), Dulbecco's Modified Eagle
Medium (DMEM), TrypLE express enzyme (1X) with phenol red and 10.0 U/ml penicillin and 10.0 μg/ml streptomycin were purchased by Gibco (Life Technologies). Mammary Epithelial Basal Medium (MEBM) and SingleQuots (hydrocortisone, bovine pituitary extract (BPE), epidermal
growth factor human recombined (rhEGF) and recombinant human insulin) were purchased as a
MEGM BulletKit™ from Lonza.
Cholera toxin from Vibrio cholera, trypsin inhibitor from Glycine max (soybean) and glutaraldehyde solution (50% in water) were from Sigma-Aldrich.
Two different solutions of dimethyl sulfoxide (DMSO) were used: a DMSO from
Sigma-Aldrich and a DMSO for UV spectroscopy (≥99.8%) from Merck. The MTT (3-(4,5-dimethylthiazol-2-yl)-2,5-diphenyltetrazolium bromide) tetrazolium solution was prepared using MTT powder from
Invitrogen.
2.2. Peptides
pepR was synthesized as C-terminal carboxamides on Rink amide MBHA resin
(Novabiochem, Läufelfingen, Switzerland) using standard 9-fluorenylmethyloxycarbonyl (Fmoc)
solid-phase synthesis methods in a model 433 automated synthesizer (Applied Biosystems,
Foster City, CA) running standard FastMoc protocols at 0.1 mmol scale. Eightfold excess of
Fmoc-L-amino acids and HBTU/HOBt, in the presence of double that molar amount of DIEA, was
used for the coupling steps, with DMF as solvent. All side-chain functions were protected with
TFA labile groups (as described in [29], [30]).
The extraction and purification of PvD1 was carried out in Brazil, as described by O Mello
[46], according to the existing collaboration with Universidade Estadual do Norte Fluminense
Darcy Ribeiro, Laboratório de Fisiologia e Bioquímica de Microrganismos.
Lyophilized HNP-1 (Bachem) was firstly dissolved in filtered milli-Q water to the final
concentration of 1mM and two different pepR solutions were prepared in filtered milli-Q water to
the final concentrations of 825.5 and 826.9 µM, respectively. Both peptides, for cell-related
studies, were then diluted in sterile PBS buffer (1X, pH 7.4). Two solutions of PvD1 were also
prepared in sterile PBS buffer (1X, pH 7.4) to the final concentrations of 400 and 550 µM. Then,
for complete dissolution of PvD1, the solution was sonicated for 3 minutes on a transsonic 460/H
14
2.3. Biological material
Human breast cell line (MCF 10A) was purchased from ATCC (American Type Culture
Collection ATCC® CRL-10317™). These non-tumorigenic cells were obtained from an epithelial
tissue derived from a mammary gland of a female patient (36 years old) with fibrocystic disease
[82].
Human breast cancer cell line (MDA-MB-231) was also purchased from ATCC and was
obtained from an epithelial tissue derived from a metastatic site of mammary gland of a female
patient (51 years old) with adenocarcinoma [83].This cell line is described as highly malignant,
resistant to chemotherapy drugs and, unlike MCF 10A, grow independently of anchorage or
growth factors [84].
2.4. Cell Culture
All this procedure was carried out under aseptic conditions in a laminar flow hood Faster
VS-4 (Interlab, Rome, Italy) and cells were maintained in a humidified environment at 37oC and
5% CO2 in a CO2 incubator MCO-18AIC (Sanyo, Japan).
Human breast cancer cell line (MDA-MB-231) was cultured as a monolayer in DMEM
medium supplemented with 10% FBS, 10.0 U/ml penicillin and 10.0 μg/ml streptomycin at 37oC
and 5% CO2. For subculturing, the medium was removed and cells were washed with sterile PBS
buffer (1X, pH 7.4). Trypsin was added to the cells and incubated for 3 minutes. When the majority
of the cells were detached, supplemented medium was added in order to inhibit trypsin action.
The cell suspension was transferred to a sterile tube and centrifuged at 1250rpm and 21oC for 5
minutes in a centrifuge 5810 R (Eppendorf, Hamburg, Germany). The supernatant was removed
and the pellet ressuspended in supplemented medium. The subculturing ratios used for this cell
line were 1:5 to 1:50 in new culture vessels, T-25 and T-75 from Thermo Fisher (Roskilde,
Denmark). All reagents were preheated to 37oC in a water bath from Memmert (Schwabach,
Germany).
Human breast cell line (MCF 10A) was cultured as a monolayer in MEBM medium
supplemented with SingleQuots provided with the Bulletkit, except the GA-1000
(gentamycin-amphotericin B solution). Instead, a 10.0 U/ml penicillin and 10.0 μg/ml streptomycin solution was
used. Additionally, to make the complete growth medium, 100ng/ml cholera toxin was added. For
subculturing procedure, the medium was removed and cells washed with sterile PBS buffer (1X,
pH 7.4). Trypsin was added to cells and incubated for 15 minutes. When the majority of cells were
rounded up, trypsin inhibitor from Glycine max (soybean) (Sigma) was added in order to inhibit
trypsin action. Cell suspension was transferred to a sterile tube and centrifuged at 1000rpm and
21oC for 5 minutes. The supernatant was removed and the pellet ressuspended in MEBM
medium. The subculturing ratios used for this cell line were 1:3 and 1:4 in new culture vessels,
15
Both cell lines were observed with an optical microscope, Primovert (Zeiss Germany) and
counted with a cell counter (Scepter 2.0 from Milipore).
2.5. Cell viability assay
Human breast cancer cells (MDA-MB-231) and human breast cells (MCF 10A) were
counted, diluted to the final concentrations of 3x10⁴ cells/ml and 5x10⁵ cells/ml, respectively,
seeded in a 96-well plate and incubated for 24 hours. Thereafter the medium was removed, the
peptides solutions were prepared in serum-free medium and added to the wells. For both cell
lines, pepR was tested between 0.1 μM and 100 μM and PvD1 was from 0.01 μM to 100 μM,
whereas HNP-1’s concentrations range from 0.1 μM to 100 μM for MDA-MB-231 and 0.1 μM to
110 μM for MCF 10A. Each concentration was tested at least in triplicate for MDA-MB-231 and in duplicate for MCF 10A, in three different days. All assays had a negative control (100% cell
death), 20% DMSO-containing medium for MDA-MB-231 and 30% DMSO-containing medium for
MCF 10A, and a positive control (100% viability) with serum-free medium for both cell lines
(untreated cells). After 24 hours of incubation 10 μl of 5 mg/ml MTT in PBS buffer (1X, pH 7.4)
was added to each well and incubated for 2 hours. Next, the medium with peptide and MTT
solution was removed and 150 μl/well of DMSO for UV spectroscopy was added. The absorbance
of each well was measured at 540 nm using a microplate reader TECAN infinity F500.
The percentage of viability was calculated as:
% 100 ( 2 )
And the percentage of cell death was calculated as:
% 100 % ( 3 )
The half maximal inhibitory concentration (IC50) values were obtained by fitting the cell
death percentage as a function of the logarithm of the inhibitor concentration and are shown as
an average of at least three independent experiments. This parameter allows to know the required
concentration of an inhibitor which reduces by half the metabolically active cells, is fundamental in pharmacology for comparison of drugs under the same experiment conditions and is describe
16
2.6. Zeta Potential measurements
Each cell line was detached using trypsin (as described in section 2.4) and then was
centrifuged, MDA-MB-231 at 1300rpm and MCF 10A at 1000rpm, both for 5 minutes on a
MiniSpin centrifuge (Eppendorf, Hamburg, Germany). The supernatant was removed and the
pellet ressuspended in sterile PBS (1X) buffer (pH 7.4).
Human breast cell lines (MDA-MB-231 and MCF 10A) were diluted in sterile PBS buffer
(1X) to the final concentration of 1x10⁵ cells/ml and then, different peptide concentrations were
added. The cell suspension was transferred to a disposable zeta cell with platinum-gold coated
electrodes (DTS1070 from Malvern Instruments, Worcestershire, UK) to the final volume of 800µl
and allowed to equilibrate for 30 minutes at 37⁰C. A set of 15 measurements (~70 runs each) was
performed with a constant voltage of 40 V. The complete experiment was carried out at least 2
times using independent preparations and peptide solutions on a Zetasizer Nano ZS (Malvern
Instruments, Worcestershire, UK).
2.7. Atomic Force Microscopy
Human breast cancer cell line (MDA-MB-231) and human breast cell line (MCF 10A) were
diluted to the final concentration of 1x10⁴ cells/ml and 1x10⁵ cells/ml, respectively, seeded in a
tissue culture dish with 40mm of diameter from TPP (Switzerland) and incubated for 24 hours.
After 24 hours the medium was removed and the cell monolayer was washed three times with
1ml of sterile PBS buffer (1X, pH 7.4). For the control images, the culture medium was replaced
by free medium and for the assays with PvD1 the culture medium was replaced by
serum-free medium with 0.01µM, 0.8µM and 50µM of PvD1.
After 24 hours of incubation, for both cell lines, the medium was removed and the cell
monolayer was washed three times with 1ml of sterile PBS buffer (1X, pH 7.4) and three times
with 1ml of sterile distilled water. Cell fixation was carried out by adding 1ml of 1% glutaraldehyde
in sterile PBS buffer (1X, pH 7.4) for 10 minutes at room temperature. The glutaraldehyde solution
was removed and the cell monolayer was washed again three times with 1ml of sterile PBS buffer
(1X pH 7.4) and three times with 1ml of sterile distilled water. The dishes were allowed to dry
inside the laminar flow hood.
AFM images were acquired using a JPK Nano Wizard II (Berlin, Germany) mounted on a
Zeiss Axiovert 200 inverted microscope (Göttingen, Germany). The AFM head is equipped with
a 15-μm z-range linearized piezoelectric scanner and an infrared laser. Measurements were
carried out in air and in contact mode using uncoated silicon ACL cantilevers from Applied
NanoStructure (Santa Clara, CA, USA). ACL cantilevers had typical resonance frequencies
between 160 and 225 kHz and an average spring constant of 36-90 N/m. Cells were first
17
with 100 × 100 μm were imaged with a resolution of 512 × 512 pixels and scan speeds of 0.2 Hz
for MDA-MB-231 and between 0.2 and 0.4Hz for MCF 10A.
The height profiles of cells were acquired drawing a line over each cell with the section
tool which opens a cross-section of that region using the JPK SPM Data Processing version
4.2.61. The root-mean-square roughness, Rms, was determined in three different regions
(nucleus, cytoplasm and perinuclear area) in five different squared areas (2.5 x 2.5 µm2) from
AFM height images and using Gwyddion 2.24 version software. The AFM image was leveled with
a three point level tool and then each square was fitted by a polynomial background tool which
stretches the image allowing the entire surface of the cells to become visible. The final Rms value
was calculated as the average of all squares analyzed.
2.8. Statistical analysis
The viability and cell death percentages were calculated using Microsoft Office Excel
2010 and the IC50 values were computed by GraphPad Prism 5 software.
Zeta-potential, Rms, height profiles and respective standard deviations were processed
with GraphPad Prism 5 software. Pairwise significances were calculated using one-way ANOVA
19
3. Results and Discussion
3.1. Peptides’ Cytotoxic Activity
In the last decades, the interest in AMPs has been increased associated with the antibiotic
resistance problem. In order to find an alternative to conventional antibiotics, a large number of
studies have been carried out using peptides from different sources such as mammalians, insects,
plants or even synthesis. With the growing number of studies in the antimicrobial peptides field it
was found that some of these AMPs have also a broad spectrum of cytotoxic activity against
cancer cells. In this work, three different peptides, known as AMPs, were tested as potential
anticancer peptides against human breast cells.
pepR and PvD1 have only proven to be antimicrobial [29] and antifungal peptides [48],
respectively, however, some authors have been pointing out to a possible activity as an anticancer
peptides [30], [44], [85]. On the other hand, studies with the α-defensin, HNP-1, have shown that,
in addition to the innate antimicrobial activity, this peptide also acts as ACP in many different
cancer cells [6], [42][42]. However, according with literature, this family of defensins is not tumour
selective, causing lysis of healthy cells [6], [35], [86].
In order to evaluate the anticancer activity of each peptide an MTT assay was carried out,
where the breast cancer cell line, MDA-MB-231, was exposed to increasing concentrations of
each peptide for 24 hours and the IC50 value was calculated. Figure 3.1 represents the percentage
of cell death resulting from exposure to different peptide concentrations. All three peptides
showed cytotoxic activity against cancer cells, as previously proposed, and HNP-1 was once
again able to kill cancer cells. It can be concluded that PvD1 is the most efficient ACP at low
concentrations, presenting an IC50 value of 0.8 ± 1.2 µM, followed by pepR with 2.6 ± 1.1 µM and
20
Figure 3.1 – Cytotoxic activity assays of pepR (a.), HNP-1 (b.) and PvD1 (c.) against breast cancer cells (MDA-MB-231). The cytotoxicity of each peptide was assessed 24 hours after peptide’s addition using a MTT assay. Error bars represent the standard deviation of at least three independent experiments.
One of the major advantages of AMPs is their ability to be selective. After the anticancer
activity of these peptides was confirmed, the same assays were carried out but at this time with
a non-tumorigenic breast cell line, MCF 10A, in order to investigate the selectivity of each peptide.
As shown in Figure 3.2, all of them also kill non-tumorigenic cells, however, only HNP-1 kills
healthy cells with a lower concentration than cancer cells. pepRrequires approximately 5 times
more concentration to reach the half maximal inhibitory concentration (IC50) and, in case of PvD1,
although it was not possible to calculate the IC50 value, the reduction by half of the metabolically
active cells was reached approximately at 10 µM.
a. b.
21
Figure 3.2 - Cytotoxic activity assays of pepR (a.), HNP-1 (b.) and PvD1 (c.) against non-tumorigenic breast cells (MCF 10A). The cytotoxicity of each peptide was assessed 24 hours after peptide’s addition using a MTT assay. Error bars represent the standard deviation of at least three independent experiments.
The results obtained for each peptide against both cancer and non-tumorigenic cell lines
were then compared in Table 3.1. According with presented IC50 values it can be concluded that
both pepR and PvD1 are potential ACPs thanks to the low concentration required to kill cancer
cells, when compared with the higher concentration required to kill non-tumorigenic ones, being
PvD1 the most promising from both. HNP-1, on the other hand, is not able to select between
cancer and normal cells, killing both cell lines at the same concentration. Similar results were
previously described [35], [42], [86].
Table 3.1 - IC50 values and respective standard deviation of each peptide in the presence of breast cancer
cells and non-tumorigenic breast cells which are determined from the cytotoxic assays. NA, “not applicable”.
pepR HNP-1 PvD1
MDA-MB-231 2.6 ± 1.1 µM 15.2 ± 1.1 µM 0.8 ± 1.2 µM
MCF 10A 12.6 ± 1.1 µM 13.3 ± 1.2 µM NA
a. b.
22
3.2. Characterization of cells’ membrane surface charge
Zeta-potential is a light-scattering technique commonly used to study the alterations on
membrane surface charge of any particle in solution. This technique was used to study the
electrostatic properties of the cell's surface as well as the peptide-cell interactions.
At the first step of zeta-potential analysis, the membrane’s surface charge of both cell
lines without peptides was measured. For MDA-MB-231, a zeta-potential of -22.99 ± 2.75 mV and
the respective electrophoretic mobility of -2.20 ± 0.26 µmcm/Vs was obtained, whereas for MCF
10A, a zeta-potential of -25.0 ± 0.87 mV and a electrophoretic mobility of -2.40 ± 0.09 µmcm/Vs
was obtained. Contrary to what would be expected, both cell lines presented a similar negative
membrane surface charge.
Zhang et al [87] have already studied the surface charge of MCF7 (breast cancer cells)
and MCF 10A which presented a zeta-potential value of -20.32 ± 2.43 mV and -31.16 ± 1.12 mV,
respectively. These authors also presented a more negative surface charge value for
non-tumorigenic cells and attributes this to the presence of sialic acid anions at the membrane’s
surface, as well as described by Cook and Jacobson [88].
As previously described, the cancer cells’ membrane is constituted by different negative
phospholipids which should give a negative charge to the outer leaflet of the membrane. However,
according to Papo and Shai [24], these phospholipids correspond to 3-9% of the total membrane
phospholipids, giving only a slight negative charge to the cancer cells when compared with the
non-tumorigenic ones. Besides phospholipids, the surface of many cells is also composed by
glycoconjugates which have ionogenic groups, such as sialic acid (a wide family of related
nine-carbon sugar acids), at their terminal position [89]. On the other hand, Cook and Jacobson [88]
refer that the presence of these ionogenic groups, mostly sialic acid, at the cells’ peripheries are
the main responsible for the cells’ membranes electrophoretic properties. Thus, it can be
speculated that, although the plasma membrane of cancer cells is actually negative compared to
healthy cells, due to their phospholipids constitution, there are other components, such as sialic
acid, at their surface that confers similar negative charge to both cells when measured by
zeta-potential [88].
Some authors have already presented zeta-potential or electrophoretic mobility values
from different cells which are in agreement with the negative ones obtained from healthy cells in
23
Table 3.2 – Zeta-potential or electrophoretic mobility values of different healthy and cancer cells according to several authors.
Cells zeta-potential (mV) Electrophoretic
Mobility (µ/sec./V/cm) Authors
Normal lymph nodes
Leukaemic cells
-1.27 ± 0.03
-1.04 ± 0.04
Cook and
Jacobson (1967)
[88]
Heathly platelets
Leukaemia
-14.2 ± 1.64
-12.81 ± 2.05
Tatsumi et al
(1992) [90]
MCF 10A
MCF7
-31.16 ± 1.12
-20.32 ± 2.43
Zhang et al (2008)
[87]
BCEC
HUVEC
-15.28 ± 0.58
-12.89 ± 0.56
Ribeiro et al (2011)
[91]
Lung carcinoma -14.76 ± 1.49 Gaspar et al (2012) [92]
Platelets
RBC
-10.75 ± 1.17
-10.80 ± 1.63
Ribeiro et al (2012)
[30]
PC-3
MOLT-4
-19.6 ± 1.9
17.8 ± 1.5
Gaspar et al (2014)
[42]
According with the results of cytotoxic activity assays it was possible to choose different
peptides’ concentrations corresponding to below IC50, IC50 and above IC50. For pepR two
concentrations above the IC50 was used whereas for HNP-1 two concentrations below the IC50
value were used.
The zeta-potential of breast cancer cells when exposed to each peptide was analysed.
As can be seen in Figure 3.3 a., the addition of pepR to the MDA-MB-231 did not induce any
significant difference in membrane’s surface charge, except far above the IC50. Alves et al [29]
has carried out a similar assay with bacteria (E. coli) and concluded that cell death is preceded by the complete membrane surface charge neutralization which could indicate that pepR has
24 M
0 M
0.8 M 2.6 M 8.3 M 41.3 -30 -20 -10 0 ***
[pepR] (M )
Z e ta -P ote n ti a l (m V ) M
0 M
0.8 M 12.2 M 41.3 -30 -20 -10 0 * ***
[pepR] (M )
Z e ta -P o te n ti a l ( m V ) M
0 M
0.1
M
1 M
15.2 M 50 -30 -20 -10 0
[HNP-1] (M )
Z e ta-P o te n ti al (m V ) M
0 M
0.1
M
1 M
13.3 M 50 -30 -20 -10 0 *
[HNP-1] (M )
Z e ta -P ote n ti a l (m V ) M
0 M
0.01 M 0.8 M 50 -30 -20 -10 0 * ***
[PvD1] (M )
Z e ta-P o te n ti al (m V ) M
0 M
0.01 M 0.8 M 50 -30 -20 -10 0 *** ***
[PvD1] (M )
Z e ta-P o te n ti al (m V )
M DA-M B-231 M CF 10A
Figure 3.3 – Zeta-potential of MDA-MB-231 (left column a., c. and e.) and MCF 10A (right column b., d. and
f.) in the presence of pepR (a. and b.), HNP-1 (c. and d.) and PvD1 (e. and f.). Cell suspension of 1x10⁵cells/ml was stabilized for 30 minutes with different concentrations of peptide and the zeta-potential
was measured at 37oC. Error bars represent the standard deviation of at least two independent experiments.
As statistical analysis a one-way ANOVA followed by a Tukey post-test was used. * 0.01 < p-value < 0.05; *** p-value < 0.0001.
a. b.
c. d.

![Figure 1.5 – Schematic representation of different layers surrounding a charged particle and the region where zeta-potential can be calculated (Adapted from [66])](https://thumb-eu.123doks.com/thumbv2/123dok_br/16494828.733515/31.892.305.605.116.487/schematic-representation-different-surrounding-particle-potential-calculated-adapted.webp)
![Figure 1.6 – Schematic representation of atomic force microscope (AFM) (From reference [75]).](https://thumb-eu.123doks.com/thumbv2/123dok_br/16494828.733515/32.892.293.639.535.883/figure-schematic-representation-atomic-force-microscope-afm-reference.webp)