2018 | Lavras | Editora UFLA | www.editora.ufla.br | www.scielo.br/cagro
Mapping land use capability in tropical conditions adapting
criteria to different levels of agricultural management
Mapeamento da capacidade de uso da terra em condições tropicaisadaptando critérios a diferentes níveis de manejo agrícola
Luís Renato Silva Taveira¹, Michele Duarte de Menezes², Anita Fernanda dos Santos Teixeira2, Nilton Curi2*
¹Instituto Nacional de Colonização e Reforma Agrária, Belo Horizonte, MG, Brasil
²Universidade Federal de Lavras/UFLA, Departamento de Ciência do Solo/DCS, Lavras, MG, Brasil
*Corresponding author: niltcuri@dcs.ufla.br
Received in October 4, 2018 and approved in November 23, 2018
ABSTRACT
Land use capability is one of the most widespread technical-interpretative classification systems, however, regional adaptations may be necessary because different attributes may affect it. For these adaptations, the Minas Gerais soil map was used as the starting point for this study. The criteria to define the land use capability were adapted to management levels with small (level A) and medium (level B) application of capital and modern technology (level C). The aim of the present study was to map land use capability for Minas Gerais state, Brazil, following the criteria adapted to different levels of management and measure the accuracy of the resulting maps. The system of land use capability is widely used by INCRA in evaluations of rural properties. Erosion criterion was replaced by erodibility. The information was handled in a geographic information system. For validation, soil profiles from regional pedological surveys were sampled, classified, and its land use capability was compared to the land use capability shown on the map according to the different management levels. In spite of the small scale of the soil map, the maps of land use capability exhibited adequate accuracy: 73% (management level A), 71% (B), and 50% (C). Therefore, it can be applied in initial phases of regional planning studies, in which the level of details required is reduced (for example, in ecological-economic zoning). More detailed analyses still depend on detailed field surveys, as advocated by the system of land use capability. Index terms: Soil map; land use intensity; mapping accuracy; geographic information system.
RESUMO
A capacidade de uso da terra é um dos sistemas de classificação técnico-interpretativa mais difundidos, no entanto, adaptações regionais podem ser necessárias porque diferentes atributos podem afetá-la. Para essas adaptações, o mapa de solos de Minas Gerais foi usado como ponto de partida para este estudo. Os critérios para definição da capacidade de uso do solo foram adaptados aos níveis de manejo com pequena (nível A) e média (nível B) aplicação de capital e tecnologia moderna (nível C). O objetivo do presente estudo foi mapear a capacidade de uso das terras do estado de Minas Gerais, Brasil, segundo os critérios adaptados a diferentes níveis de manejo e medir a acurácia dos mapas resultantes. O sistema de capacidade de uso é amplamente usado pelo INCRA em avaliações de imóveis rurais. O critério de erosão foi substituído pelo critério de erodibilidade. O tratamento das informações foi feito num sistema de informações geográficas. Para a validação, perfis de solos de levantamentos pedológicos regionais foram amostrados, classificados, e sua capacidade de uso da terra foi comparada com a capacidade de uso da terra mostrada no mapa de acordo com os diferentes níveis de manejo. Apesar da escala menos detalhada do mapa de solos, os mapas de capacidade de uso das terras apresentaram acurácia adequada: 73% (nível de manejo A), 71% (B) e 50% (C). Portanto, sua aplicação é possível em fases iniciais de estudos de planejamento regional, nas quais o nível de detalhes requerido é menor (por exemplo, em zoneamentos ecológico-econômicos). Análises mais detalhadas ainda dependem de levantamentos a campo, conforme preconizado pelo sistema de capacidade de uso das terras.
Termos para indexação: Mapa de solos; intensidade de uso da terra; acurácia de mapeamento; sistema de informações geográficas.
INTRODUCTION
Soil classification is indispensable for the development of agriculture. Expansion of agricultural frontiers has also required technical-interpretative
classification of pedological restrictions to production
(Carneiro et al., 2017). This depends on detailed soil maps which can support decision-making that would avoid
phenomenon cannot be represented in a detailed way. The scale of this soil map only allowed delimitation of mapping units that generally include two or more soil classes.
Obtaining pedological maps on large scales, even in extensive areas already mapped on smaller scales, is a great challenge in Soil Science. The more detailed the pedological information is, the more detailed any thematic map derived from it will be (Silva et al., 2016). Considering current limitations in investment for producing detailed pedological maps, two research lines may contribute more effectively to this effort: the techniques of digital soil mapping (Arrouays et al., 2017; Hengl et al., 2014; Machado et al., 2018; Menezes et al., 2014; Silva et al., 2016; Souza et al., 2016;) and the incorporation of the empirical knowledge of the farmer, speeding up the soil surveys and making them less expensive (Fernandes et al., 2008; Schenatto et al., 2017).
One of the most widespread technical-interpretative
classification systems is the land use capability system
(Klingebiel; Montgomery, 1961; Lepsch et al., 2015). It was originated in the United States of America and it groups lands with similar restrictions to agricultural use to prevent erosion. Regional adaptations may be needed, especially in many developing countries, where there is a
need to perform field surveys to acquire more data related
to attributes that may affect land use capability.
A common conviction is that regardless of the type of land, more intensive uses require more advanced technology. However, three considerations arise herein. First, not all farmers use modern agricultural technology, due to socioeconomic or cultural realities. Second, there are situations in which traditional farming systems are better equipped to deal with the restrictions imposed by the environment (Pandey; Sirothia; Singh, 2006). For example, mechanization of agricultural operations is not recommended on hilly terrain. However, the use of manual or animal-drawn implements allows cultivation without necessarily leading
to erosion. Third, the concept of production intensification
should not be understood in the same way for every farmer: each one is able to intensify his/her farming system in different ways that are culturally, environmentally, and economically determined (Pretty; Bharucha, 2014). Nevertheless, the land use capability system was elaborated with a focus on modern farming systems (Klingebiel; Montgomery, 1961; Lepsch et al., 2015). This limits its capacity of meeting the demands of all farmers.
Various authors have questioned this and other limitations of the land capability system, such as its inherent subjectivity (Giboshi; Rodrigues; Lombardi Neto, 1999). Some researchers have developed systems
for classification of land use capability differently from
the original (Pandey; Sirothia; Singh, 2006; Sheng, 1989). Extensive disseminations of these systems, however, tends to impede knowledge from being transferred because they include regional features with their own criteria and
codification. Thus, preserving the structure of the original
system, widely used by INCRA in evaluations of rural properties, was proposed an adaptation. It consists of
adjusting classification of land use capability to farming
systems with lower technological levels of management, consisting of an adaptation inspired by the agricultural suitability system (Ramalho Filho; Beek, 1995). The criteria originally proposed for farming systems with a high level of management were preserved. In that way, the capability of transferring knowledge has been maintained.
Studies such as mapping the land use capability in the state of São Paulo, Brazil (São Paulo, 1973), show that it is possible to obtain thematic maps even on generalized scales. However, the limitations of pedological data challenge such initiatives. In addition, the occurrence of
erosion, which is essential to classification of land use
capability, is another attribute that is not available on the soil map and that needs to be obtained by other means, such as RUSLE combined with remote sensing (Makinde; Oyebanji, 2018). The time and cost required to obtain this information in large territories are considerable obstacles. Therefore, it is relevant to analyze if the thematic maps obtained on different scales, even on smaller ones, are appropriate. Their ability to represent the reality can be measured through statistical tools. Thus, the aim of the present study was to map the land use capability for Minas Gerais state, Brazil, and measure the accuracy of the resulting maps for different management levels. The knowledge of characteristics of farming systems with different levels of management and the information contained on the pedological map of the Minas Gerais State served as references.
MATERIAL AND METHODS
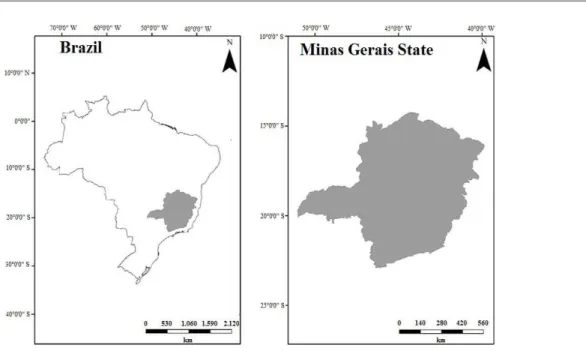
Study area
System adaptations
The classification elaborated in the present study
used an adaptation and the management levels A, B, and C considered by Ramalho Filho and Beek (1995); these levels correspond to agricultural systems with small (level A), medium (level B), and large (level C) application of
capital and technology. Classification criteria for C level
correspond to those applied to farming systems with a high level of management (Lepsch et al., 2015). Due to the scale of the soil map and the impossibility of mapping the
erosion features in the field, codification of the attributes
was adapted as detailed below.
Many soil mapping units (UFV, CETEC, UFLA, FEAM, 2010) refer to combinations of more than one soil class, and these units have a limited level of detailed information. In these cases, only the dominant soil attributes in each combination of soil classes, which is the
first soil class described in the legend, were considered for classification of erodibility.
It is not yet possible to map erosion by remote sensing through methods that join reasonable cost, spatial resolution, and the size of the area in large territorial extensions. However, advances have occurred in recent years (Assefa et al., 2015; Karami et al., 2015; Mararakanie; Nethengwe, 2012; Saadat et al., 2014). It
would not be feasible to map erosion in the field in a
territory as extensive as Minas Gerais (586 thousand km²), due to limitations of time and resources. For that reason,
the criteria of sheet erosion, surface rills, shallow rills, deep rills and very deep rills (Klingebiel; Montgomery, 1961; Lepsch et al., 2015) were replaced by the erodibility criterion (intrinsic to each soil class), categorized as follows (soil classes according to US Soil Taxonomy (Soil Survey Staff, 2014)): a) very low – Oxisols with clayey texture, Entisols with redoximorphic properties, Inceptisols and Entisolswith fluvic properties, and Alfisols with a higher organic matter content; b) low – Oxisols
with medium texture, Ultisols with clayey texture, Alfisols with drainage restrictions, and Alfisols with medium
organic matter content; c) medium – Ultisols with medium
texture, Alfisols with plinthic properties and Alfisols with
high-activity clays; d) high – Inceptisols in general and Spodosols; e) very high – Inceptisols with silty texture, Entisols with sandy texture and Entisols with shallow depth.
The soil class also served as a basis for codification
of the soil effective depth criterion, unless there was mention of the depth of the soil in the legend: a) very deep –Spodosols, Entisols with sandy texture and Oxisols;
b) deep – Ultisols, Alfisols, Entisols with redoximorphic
properties, Alfisols with plinthic properties, Alfisols with drainage restrictions, Mollisols with moderate clay
increase in depth, Inceptisols and Entisols with fluvic properties; c) moderately deep – Alfisols with high-activity
clays, Histosols, Vertisols, Entisols with low depth, other Inceptisols, and other Mollisols; d) shallow – Entisols with shallow depth.
The textural gradient criterion worsens the placement of surface texture in regard to land use capability, and without mention of it in the legend, its presence was
considered in the following classes: Ultisols, Alfisols with drainage restrictions, Alfisols with high-activity clays, Alfisols with plinthic properties and moderate clay increase
in depth, and Mollisols with moderate clay increase in
depth. The drainage criterion was codified as follows: a)
accentuated or greater –Entisols with sandy texture and
Oxisols; b) good – Ultisols, Alfisols, Mollisols, Alfisols
with high-activity clays, Inceptisols in general, Entisols with shallow depth, and Entisols with low depth; c)
moderate – Inceptisols and Entisols with fluvic properties; d) imperfect – Alfisols with drainage restrictions, Alfisols
with plinthic properties, Vertisols, and Entisols with sandy texture and redoximorphic properties; e) poor – Spodosols and Entisols with redoximorphic properties; and f) very poor – Histosols.
In the legend of the soil map, stoniness is mentioned without detail. For this reason, the number of categories was reduced from ten to three. Information regarding cation exchange capacity and content of aluminum,
sodium, salts, carbonates, or sulfide materials do not exist
or are incomplete. For this reason, the only information available regarding soil fertility was converted into one criterion.
Although the hydromorphic character can be inferred from the soil class, the depth at which it occurs is not available in the legend, making it impossible to be used. There is also no way to extract information from the
legend regarding the risk of flooding or frosts. Therefore,
these criteria were not considered in the present study. The water regime criterion was inferred from the vegetation phase: a) small valleys with distinctive hydrophytic vegetation, hygrophilous and hydrophilous grasslands – aquic water regime; b) perennial tropical forest – perudic water regime; c) semiperennial tropical forest and dystrophic facies cerradão (Portuguese augmentative of Cerrado) – udic water regime; d) semideciduous tropical forest, cerrado (neotropical savanna) and open cerrado – ustic water regime; e) deciduous tropical forest and grasslands – perustic water regime; f) hypo-xerophytic and hyper-xerophytic deciduous
vegetation – aridic water regime. The shapefile of the soil map codified for the vegetation phase (Silva et al., 2013)
was used as a reference in those soil mapping units without mention of this criterion. In some soil mapping units with simultaneous occurrence in both the north and the south of Minas Gerais, the legend indicates the existence of hypo-xerophytic deciduous vegetation. This vegetation, however, is restricted to the northern part of the state; it does not occur
in the southern part. In the north, it commonly occurs mixed with deciduous tropical forest (which also occurs in the south). For that reason, all the polygons whose vegetation phase (according to the legend) is hypo-xerophytic deciduous
vegetation were codified as deciduous tropical forest. The
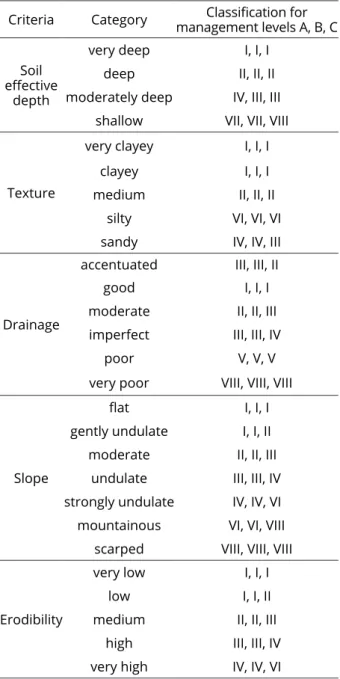
criteria, categories, and respective placements in the classes of land use capability applied in the present study are found in Table 1.
Criteria Category management levels A, B, CClassification for
Soil
effective
depth
very deep I, I, I deep II, II, II
moderately deep IV, III, III
shallow VII, VII, VIII
Texture
very clayey I, I, I
clayey I, I, I medium II, II, II
silty VI, VI, VI
sandy IV, IV, III
Drainage
accentuated III, III, II
good I, I, I
moderate II, II, III
imperfect III, III, IV
poor V, V, V
very poor VIII, VIII, VIII
Slope
flat I, I, I
gently undulate I, I, II moderate II, II, III
undulate III, III, IV
strongly undulate IV, IV, VI mountainous VI, VI, VIII
scarped VIII, VIII, VIII
Erodibility
very low I, I, I
low I, I, II
medium II, II, III high III, III, IV
very high IV, IV, VI
Table 1: Criteria, categories, and respective placements
in the classes of land use capability.
Acquisition and elaboration of maps
In the present study, we used: the soil map of Minas Gerais (UFV, CETEC, UFLA, FEAM, 2010) and a digital elevation model (DEM) of 90 m of spatial resolution extracted from the SRTM (Shuttle Radar Topographic Mission – NASA). They are the same that Silva et al. (2013) used to map the agricultural suitability of the Minas Gerais state. First, the “slope” tool of ArcMap® 10.3 was used to create the slope map from the DEM. It was categorized (“reclassify”tool) using the intervals 0% to 2% (flat), 2% to 5% (gently undulate), 5% to 10% (moderate), 10% to 15% (undulate), 15% to 45% (strongly undulate), 45% to 70% (mountainous), and > 70% (scarped), according to Lepsch et al. (2015). These intervals are more appropriate for studies on agricultural management by dividing the range of slopes between 0% and 20% (those most intensely
cropped) into five categories. The “majority filter” tool
was then applied to soften the features obtained, and the
“extract by mask” tool was applied, using the shapefile
with the soil map as a mask.
Numerical codification was created for the other classification criteria. After the codes were assigned, 8 raster files were obtained relative to the criteria derived
from the soil map. They and the slope map were then combined. In the resulting file, the 564 features of different code sequences were converted into a binary
codification to identify fulfillment or lack of fulfillment
of the placement rules. Code 1 was applied to the lines
that fulfilled the rules. In each line (polygons of the same
mapping unit), different criteria determined simultaneous Criteria Category Classification for
management levels A, B, C
Base saturation
eutrophic
character II, I, I
dystrophic
character III, II, II
Stoniness non-existent I, I, I
stony and rocky VI, VII, VIII
Water regime
aquic V, V, VII perudic I, I, I
udic II, I, I ustic III, II, II
perustic IV, IV, III
aridic VII, VII, VI
Table 1: Continued. placement in different classes of land use capability. The
final classification was determined by the most restrictive criterion, identified by the highest code (Roman numeral).
It was then synthesized in the other columns, one for each level of management.
Map validation
To validate the land use capability map of Minas Gerais, the Brazilian Soil Information System (https:// www.bdsolos.cnptia.embrapa.br) and the Free Brazilian Repository for Open Soil Data (http://www.ufsm.br/febr)
were consulted. Soil profiles described and analysed in
the state of Minas Gerais were organized on a Microsoft
Office Excel® spreadsheet. Only those with geographic
coordinates, consistent location data, and a sufficiently
complete morphological description were initially
utilized. Then, these profiles were overlaid on the soil
map (UFV, CETEC, UFLA, FEAM, 2010). Various soil
profiles differed from the corresponding map polygon in regard to pedological classification. For that reason, only
those with soil class identical to the dominant class (on the second categorical level) in the polygon were used.
A total of 118 profiles originated from regional and local
soil surveys remained (Brasil, 1979; Brasil, 1982; Brasil, 1983a; Brasil, 1983b; Brasil, 1987; Brasil, 1998; Brasil, 2002; Brasil, 2004a; Brasil, 2004b; Brasil, 2006; Brasil; Companhia Vale do Rio Doce, 1970; Brasil; Minas Gerais, 1982; Brasil; Sociedade Brasileira de Ciência do Solo, 1983; Brasil; Sociedade Brasileira de Ciência do Solo, 1988). The cluster sampling scheme was a consequence of
the existence, or lack thereof, of soil surveys. Finally, a file with correspondence to the codification of the criteria used in classification was elaborated with the same procedure
described above for mapping land use capability.
Classification of the sample profiles confronted
two issues. First, the geographic coordinates in only four of the fourteen soil surveys consulted (Brasil, 2004b; Brasil, 2006; Brasil; Sociedade Brasileira de Ciência do Solo, 1983; Brasil; Sociedade Brasileira de Ciência do Solo, 1988) have precision of one second (30.8 m). In the others, it is only one minute (1.85 km), which leads to
uncertainty in regard to the location of the profiles. Second,
in the soil surveys, local topographical slope is described in percentage. However, one of the surveys (Brasil, 1979) refers only to the slope class, whose categorization
differs from that used in this study: 0 – 3% (flat), 3 – 8%
(gently undulate), 8 – 20% (undulate), 20 – 45% (strongly undulate), 45 – 75% (mountainous), and > 75% (scarped).
After classification of the sample profiles, an
intersection of the soil profiles and land use capability map
was created. Thus, the map was related to the attributes,
codes, and classifications in the sample points. Then, three
confusion matrixes, one for each land use capability map, in relation to management levels A, B, and C were created. These data were used to calculations related to mapping accuracy measurement: overall accuracy, kappa index, and commission and omission errors. Overall accuracy is the simplest of these calculations, consisting of dividing the sum of the elements of the main diagonal of the confusion matrix by the total number of elements of the sample, and then multiplying by 100 (Equation 1):
The values in the cells of the marginal column allow calculation of commission errors, or the quantity of sample points of other categories that were overlaid on the polygons of a determined category (Equation 4):
i
Σx
Oa x100 N
where:
Oa = overall accuracy; xi = number of elements in the main diagonal of the matrix; N = number of sample elements.
The kappa index represents a coefficient for nominal
scales that measures the proportion of agreement after the agreement attributed to chance is eliminated (Equation 2).
Mapping performance was then evaluated through classification
of the kappa index proposed by Landis and Kock (1977): < 0.20 (poor); 0.20 – 0.40 (reasonable); 0.40 – 0.60 (good); 0.60 –
0.80 (very good); ≥ 0.80 (excellent).
o e
e
P P
k
1 P
where:
k = kappa index; Po = overall accuracy; Pe = sum of the products between the totals of the marginal lines and columns, divided by the square of the number of elements of the sample.
The values in the cells of the marginal line allow calculation of the number of sample points that, belonging to a determined category, were overlaid on other categories on the map. They are the omission errors (Equation 3):
i ii
i
x x
OE
x
where:
OE = omission errors; xi+ = sum of the elements in the marginal line; xii = elements of the sum of the marginal line that belong to the main diagonal of the matrix.
i ii
i
x x CE
x
where:
CE = commission errors; x+i = sum of elements in the marginal column; xii = elements of the sum of the marginal column that belong to the main diagonal of the matrix.
RESULTS AND DISCUSSION
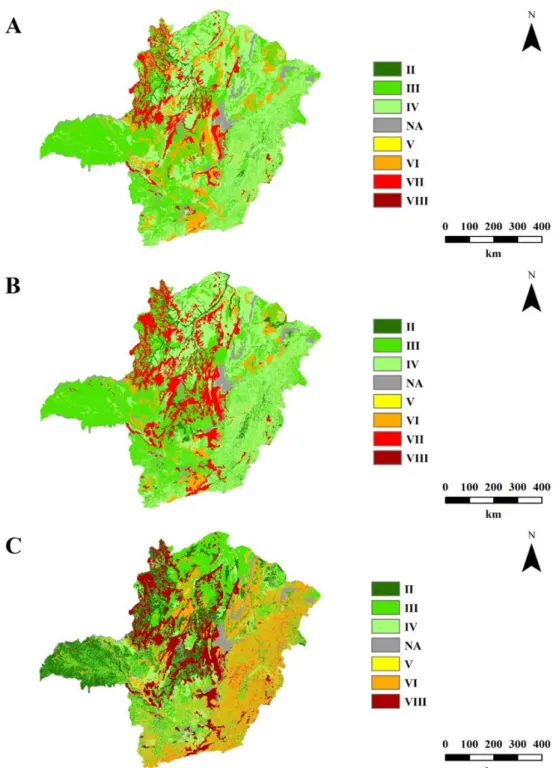
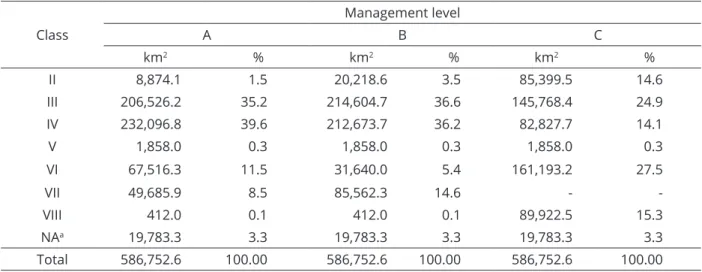
Figure 2 exhibits the maps of land use capability for Minas Gerais state (management levels A, B, and C). In Table 2 a synthesis of the surface area and of the distribution percentage of each class at each level of management is presented.
First, 76.3% of the lands of the Minas Gerais state support annual and perennial crops (classes II to IV) when farming systems under management levels A and B are used. The percentage declines to 53.6% when farming systems under level C are used. Nevertheless, the class II lands, of greater land use capability, are few under levels A (1.5%) and B (3.5%), but they make up a total of 14.6% under level C. The lands that support only planted or native pastures and forests (classes VI and VII) are 20.0% under levels A and B, increasing to 27.5% under level C. In addition, the lands that do not support any crop and livestock use (class VIII) are rare under levels A and B (0.1%), but represent 15.3% of the state territory under level C. Of the 586 thousand km² of the territory of Minas Gerais state in 2016, 5.2 million hectares were planted with grains, coffee and sugarcane, and it is estimated that this area will increase up to 0.5 million hectares by 2026 (Minas Gerais, 2017). The present study can aid in the planning of land use, avoiding possible soil degradation.
The percentage distribution of the classes is relatively similar between management levels A and B, but different between these and level C. Among the reasons
for this finding is the hilly topography, which increases
the areas of classes VI, VII and VIII when considering the high level of management, especially in the eastern part of the state. To the west and the northwest, the existence
of flatter areas increases the percentage of lands in class
II under level C, which is less limited than the other levels of management by other pedological attributes common
(1)
(4)
in this portion of the state: their dystrophic nature of such soils and ustic water regime. In the southern, central, and also northwestern parts of the state, large areas in classes
VI and VII (levels A and B) and VIII (level C) are observed, whose land use capability is mainly limited by the sandy texture, shallow soil depth, or stoniness.
Considering the limitations of scale of the soil map (UFV, CETEC, UFLA, FEAM, 2010), each polygon
classified effectively has lands of lower or even higher
land use capability. This is inherent to mapping made at similar scales. In Table 3 the distribution percentage of the
classes of land use capability related to the soil profiles
used in the validation procedure is presented. Considering the manner of obtaining the sample, it maintains similarity to the distribution percentage of the classes in the mapped territory (Table 2) greater than expected, even though there are some discrepancies (class II, level C; and classes III and IV, levels A and B).
Analysis shows that 80.5% of the sample profiles
belong to classes II to IV when farming systems under
management levels A and B are considered. This percentage decreases to 72.9% when farming systems under level C are considered. Nevertheless, the sample
profiles of class II, with greater land use capability, do not
occur under level A and are few under level B (0.8%), but
they totalize 37.3% under level C. Sample profiles fitting
in classes VI and VII are 18.7% under levels A and B and
15.3% under level C. And the sample profiles fitting in
class VIII, which do not occur under management levels A and B, represent 11.0% under level C.
To analyze the results of validation, some aspects must be considered. First, the generalized information of the soil map (UFV, CETEC, UFLA, FEAM, 2010) naturally eliminated many details from the representation.
Class
Management level
A B C
profiles % profiles % profiles %
II 0 0.0 1 0.8 44 37.3
III 73 61.9 75 63.6 19 16.1
IV 22 18.6 19 16.1 23 19.5
V 1 0.8 1 0.8 1 0.8
VI 14 11.9 8 6.8 18 15.3
VII 8 6.8 14 11.9 -
-VIII 0 0.0 0 0.0 13 11.0
Total 118 100.0 118 100.0 118 100.0
Table 3: Classes of land use capability, by management level, among the soil profiles used in the validation
procedure.
a Corresponding to intensely urbanized areas, water bodies, and rock outcroppings. Class
Management level
A B C
km2 % km2 % km2 %
II 8,874.1 1.5 20,218.6 3.5 85,399.5 14.6
III 206,526.2 35.2 214,604.7 36.6 145,768.4 24.9
IV 232,096.8 39.6 212,673.7 36.2 82,827.7 14.1
V 1,858.0 0.3 1,858.0 0.3 1,858.0 0.3
VI 67,516.3 11.5 31,640.0 5.4 161,193.2 27.5
VII 49,685.9 8.5 85,562.3 14.6 -
-VIII 412.0 0.1 412.0 0.1 89,922.5 15.3
NAa 19,783.3 3.3 19,783.3 3.3 19,783.3 3.3
Total 586,752.6 100.00 586,752.6 100.00 586,752.6 100.00
Second, for classification of land use capability, only the
attributes of the soil class predominant in each mapping unit were extracted and then attributed to the entire polygon. The other soils of the polygon may exhibit attributes different from those used to evaluate land use
capability, and exhibit better or worse classification than the classification assigned on the map. Third, given the
multi-criterial nature of the land use capability system (Klingebiel; Montgomery, 1961; Lepsch et al., 2015), a single change of category in a single criterion is able to
change the classification. Fourth, the low accuracy of the geographic coordinates of the sample profiles in various
soil surveys (Brasil, 1979; Brasil, 1982; Brasil, 1983a; Brasil, 1983b; Brasil, 1987; Brasil, 1998; Brasil, 2002; Brasil, 2004a; Brasil; Companhia Vale do Rio Doce, 1970; Brasil; Minas Gerais, 1982) can hurt correspondence between the slopes, mapped and sampled, and the overlaying of the points on the mapping units. Finally, the differences in categorization of attributes such as slope and the vegetation phase between the map and the sample (Brasil, 1979; Minas Gerais, 2010) may lead to divergent
classifications. Despite these constraints, this work used
the best available information nowadays and the results here obtained can be used to help decision makings and using the lands of Minas Gerais state in a more sustainable way. Table 4 shows a comparison among overall accuracies and kappa indexes of the maps of land use capability for Minas Gerais considering management levels A, B, and C.
substantially larger than the scale used in the present study, overall accuracy ranged from 39% to 80% (Machado et al., 2018). This indicates the pertinence of the map elaborated here.
Table 5 exhibits omission errors (delimitation of the mapping units), and the commission errors, corresponding
to erroneous classification of polygons, indicated by the
sample. This allows a better explanation of overall accuracy and the kappa index. The magnitude of the errors, even of the lower ones, is compatible with the generalization of pedological information (UFV, CETEC, UFLA, FEAM, 2010) and with the uncertainty associated with mapping and with its validation. In the classes of land use capability without sample elements – II at management level A and VIII at management levels A and B, analysis of omission errors was impaired. In the classes with few sample points – II at level B and V at the three levels, the omission errors of 0% are due to the fact that a single sample element can indicate only error (100%) or only correctness (0%).
There are more failures of delimitation of the polygons (omission) in classes IV (level C), VI (levels A and B), and VII (level B). In these cases, the criteria
most important for classification include slope, stoniness,
and the water regime. The accuracy of the geographic
coordinates of the profiles (one minute, or 30.8 m, for most
of them) tends to increase these errors because by assuming
their classification is correct, uncertainty in regard to their
location on the map leads to the supposition that there will be cases of overlapping at locations whose attributes are different from those sampled. This is even more relevant in the case of slope: the codes of the other criteria are unique within a soil mapping unit, but there are diverse codes of slope within the same unit. Adjustment in interpretation of the vegetation phase (from hypo-xerophytic deciduous vegetation to deciduous tropical forest) from the legend of the soil map likewise appears to limit the correspondence between the mapped water regime and the sampled water regime. Stoniness is an attribute restricted to some soils and, therefore, more subject to the uncertainties of the mapping and validation processes.
Commission errors (classification) were more expressive in classes III (level C), IV (levels A, B, and C), and VI (level B). They indicate that these classes were mapped in diverse locations where there are effectively other classes. In this respect, the degree of generalization of the soil map suppressed classes with lower territorial expression from representation. The classification methodology considered only the attributes of the soil class predominant in each mapping unit. These two aspects
contributed to an increase in classification errors.
Table 4: Overall accuracy and kappa index of land use capability maps for Minas Gerais, considering
management levels A, B, and C.
Management level
A B C
Overall accuracy (%) 73 71 50
Kappa index 0.54 0.48 0.37
Results indicate that maps relative to management levels A and B are good, and the map relative to level C is
reasonable, according to the classification of Landis and
Koch (1977). Given the limitations imposed on mapping by the scale of the soil map, by the characteristics of the
classification method, and by the manner of obtaining
capability. It is more compact in the maps of management levels A and B, and less compact in the map of level C. This occurs because the criteria that determine the placement in each class vary according to the level of management.
Thus, the number of sample profiles situated near the edges
of the polygons increased and the occurrence of errors in the map of level C increased.
The above elements allow us to understand why the accuracy of the maps of levels A and B is better. The two most expressive classes (III and IV) of the sample in these management levels indicate less errors than in the
map of level C. There are more sample profiles situated
at the edges of polygons of different classes in level C, increasing the probability of the occurrence of errors.
The scale of the soil map (UFV, CETEC, UFLA, FEAM, 2010) conditions its power to represent the reality, as well as of any thematic map resulting from it. In the future, elaboration of more detailed pedological surveys
encompassing the state will allow classification of land use
capability to be obtained with greater accuracy. In this task, new approaches tend to speed up and reduce the costs of the surveys (Fernandes et al., 2008; Machado et al., 2018; Menezes et al., 2014; Silva et al., 2016).
In the years to come, the technology of mapping erosion by remote sensing (Assefa et al., 2015; Karami et al., 2015; Mararakanie, Nethengwe, 2012; Saadat et al., 2014) is expected to evolve. Thus, the use of this criterion, and not erodibility, in mapping made on small scales will be possible in the future and will be more faithful to the original methodology.
No pedological map with a scale similar to that of the soil map of Minas Gerais replaces local surveys when a high level of detail is required in the work. The map of land use capability elaborated in the present study also does
not substitute the field surveys recommended by Klingebiel
and Montgomery (1961) and Lepsch et al. (2015) if a high level of detail is required. Its utility is therefore to equip regional studies of land use planning which, in initial phases, allow a greater degree of generalization
of information. This classification methodology could
be applied in smaller studies with the available physical information, as a more detailed pedological map, improving the details in the obtained map.
CONCLUSIONS
Maps of land use capability indicate that 76.3% of the lands of Minas Gerais support annual and perennial crops (classes II, III, and IV) when management levels A and B are used. When level C is used, the percentage falls
Error land use Class of
capability
Management level
A B C
Omission (%)
II - 0 48
III 16 16 37
IV 32 37 65
V 0 0 0
VI 71 75 50
VII 38 64
-VIII - - 54
Commission
(%)
II 100 50 12
III 8 14 73
IV 59 60 60
V 0 0 0
VI 43 60 50
VII 0 29
-VIII - - 25
Table 5: Omission and commission errors (%) of the land use capability map for Minas Gerais, considering
three levels of management.
On the map related to management level A, the fewest omission errors were committed in classes III, IV, V, and VII, and the fewest commission errors, in classes III, V, VI, and VII. On the map of level B, the fewest omission errors were committed in classes II, III, IV, and V, and the fewest commission errors, in classes III, V, and VII. On the map of level C, classes II, III, and V exhibited the fewest omission errors, and classes II, V, and VIII, the fewest commission errors.
to 53.6%. The class with the greatest land use capability (II), however, represents only 1.5% of the lands in level A and 3.5% in level B, but 14.6% in level C. The lands that support only planted or managed pastures and forests (classes VI and VII) represent 20.0% in levels A and B and 27.5% in level C. The lands without possibility of agronomic utilization (class VIII) are rare in levels A and B (0.1%), but total 15.3% in level C. These differences are due to the characteristics of the land and to the technical resources of each farming system to be dealt with. In each class indicated in the maps, there are lands with greater or lesser land use capability, but the limitation of scale imposed by the soil map impedes a greater level of detail. The accuracy of the maps was considered good in management levels A and B, and reasonable in level C. The maps elaborated in the present study are directed to assisting regional studies of land use planning in initial phases, in which the level of detail required is lower. Subsequent phases, in which the demands for detail of analyses increases, continue to depend on local surveys of attributes until detailed pedological surveys are available. The present study can aid in the planning of soil management, avoiding possible soil degradation in the 0.5 million hectares expected to increase for coffee, grains and sugar-cane production by 2026 in Minas Gerais state.
ACKNOWLEDGMENTS
Our thanks to the Instituto Nacional de Colonização e Reforma Agrária (INCRA) for the leave period granted
to the first author to deepen studies. To the Soil Science
Department (DCS) of Universidade Federal de Lavras (UFLA) for an environment appropriate for elaborating this study. To the Conselho Nacional de Desenvolvimento Científico e Tecnológico (CNPq), Coordenação de Aperfeiçoamento de Pessoal de Nível Superior (CAPES), and Fundação de Amparo à Pesquisa de Minas Gerais
(FAPEMIG) for financial support.
REFERENCES
ARROUAYS D.; LAGACHERIE P.; HARTEMINK A. E. Digital soil mapping across the globe. Geoderma Regional, 9:1-4, 2017
ASSEFA, T. T. et al. Identification of erosion hotspot area using GIS and MCE technique for Koga Watershed in the Upper Blue Nile Basin, Ethiopia. American Journal of Environmental Sciences, 11(4):245-255, 2015.
BRASIL. Levantamento de Reconhecimento de Média
Intensidade dos Solos da Região do Alto Paranaíba,
Minas Gerais. Rio de Janeiro: EMBRAPA, 2004(a). 414p.
BRASIL. Levantamento de Reconhecimento de Média
Intensidade dos Solos da Zona Campo das Vertentes –
MG. Rio de Janeiro: EMBRAPA, 2006. 326p.
BRASIL. Levantamento de Reconhecimento de Média
Intensidade dos Solos e Avaliação da Aptidão Agrícola da Região Geoeconômica de Brasília –
Minas Gerais. Brasília: EMBRAPA, 1998. Available in:
<https://www.bdsolos.cnptia.embrapa.br>. Access in: May, 18, 2018.
BRASIL. Levantamento Exploratório – Reconhecimento
de Solos do Norte de Minas Gerais (Área de Atuação da
SUDENE). Recife: EMBRAPA: SUDENE, 1979. 426p.
BRASIL. Levantamento Semidetalhado dos Solos da
Microbacia do Ribeirão São Domingos, Estado de Minas Gerais. Rio de Janeiro: EMBRAPA, 2004(b). 86p.
BRASIL. Projeto RADAMBRASIL: Levantamento de Recursos Naturais – Volume 29. Rio de Janeiro: Ministério das Minas e Energia, 1982. 659p.
BRASIL. Projeto RADAMBRASIL: Levantamento de Recursos Naturais – Volume 31. Rio de Janeiro: Ministério das Minas e Energia, 1983(a). 768p.
BRASIL. Projeto RADAMBRASIL: Levantamento de Recursos Naturais – Volume 32. Rio de Janeiro: Ministério das Minas e Energia, 1983(b). 779p.
BRASIL. Projeto RADAMBRASIL: Levantamento de Recursos Naturais – Volume 34. Rio de Janeiro: IBGE, 1987. 550p.
BRASIL. Solos do Campo Experimental da EMBRAPA Milho e
Sorgo: suas características e classificação no novo sistema
brasileiro. Rio de Janeiro: EMBRAPA 2002. 92p.
BRASIL. COMPANHIA VALE DO RIO DOCE. Levantamento exploratório dos solos da região sob influência da Cia. Vale do Rio Doce. Rio de Janeiro: Ministério da Agricultura: CVRD, 1970. 147p.
BRASIL; MINAS GERAIS. Levantamento de Reconhecimento de Média Intensidade dos Solos e Avaliação da Aptidão Agrícola das Terras do Triângulo Mineiro. Rio de Janeiro: EMBRAPA: EPAMIG, 1982. 549p.
BRASIL. SOCIEDADE BRASILEIRA DE CIÊNCIA DO SOLO. II
Reunião de Classificação, Correlação e Interpretação de Aptidão Agrícola. Rio de Janeiro: SLNCS; SBCS, 1983. 138p.
BRASIL. SOCIEDADE BRASILEIRA DE CIÊNCIA DO SOLO. III
CARNEIRO J. S. S. et al. Agricultural potential of areas under pasture in southern Tocantins. Journal of Bioenergy and
Food Science, 4(1):50-60, 2017.
FERNANDES, L. A. et al. Relação entre o conhecimento local, atributos químicos e físicos do solo e uso das terras. Revista Brasileira de Ciência do Solo, 32(3):1355-1365, 2008. GIBOSHI, M. L.; RODRIGUES, L. H. A.; LOMBARDI NETO, F.
CAP_USO: Um sistema especialista para determinação da capacidade de uso da terra. Acta Scientiarum, 21(4):909-914, 1999.
HENGL T. et al. SoilGrids1km — Global Soil Information Based on Automated Mapping. PLoS ONE, 9(8): e105992, 2014.
KARAMI, A. et al. Gully erosion mapping using object-based and pixel-based image classification methods. Environmental
and Engineering Geoscience, 21(2):101-110, 2015.
KASSAI, P.; SISÁK, I. The role of geology in the spatial prediction of soil properties in the watershed of Lake Balaton, Hungary. Geologia Croatica, 71(1):29-39, 2018.
KLINGEBIEL, A. A.; MONTGOMERY, P. H. Land capability
classification. USDA USA, 1961. 21p.
LANDIS, J. R.; KOCH, G. G. The measurement of observer agreement for categorical data. Biometrics, 33(1):159-174, 1977.
LEPSCH, I. F. et al. Manual para levantamento utilitário e classificação de terras no sistema de capacidade de
uso. Viçosa: SBCS, 2015. 170p.
MACHADO, I. R. et al. Spatial disaggregation of multi-component soil map units using legacy data and a tree-based algorithm in Southern Brazil. Revista Brasileira de Ciência do Solo, 42:e0170193, 2018.
MAKINDE, E. O.; OYEBANJI, E. I. The application of remote sensing and GIS technology to erosion risk mapping. Proceedings, 2(22):1398, 2018.
MANCINI, M. et al. Tracing tropical soil parent material analysis via portable X-ray fluorescence (pXRF) spectrometry in Brazilian Cerrado. Geoderma, 337:718-728, 2019.
MARARAKANIE, N.; NETHENGWE, N. S. Gully features extraction using remote sensing techniques. South African Journal of Geomatics, 1(2):109-118, 2012.
MENEZES, M. D. et al. Knowledge-based digital soil mapping for predicting soil properties in two representative watersheds.
Scientia Agricola, 75(2):144–153, 2018.
MENEZES, M. D. et al. Solum depth spatial prediction comparing conventional with knowledge-based digital mapping approaches. Scientia Agricola, 71(4):316-323, 2014.
MINAS GERAIS. Projeções do agronegócio - Minas Gerais - 2016 a 2026. 2nd ed. Belo Horizonte: Secretaria de Agricultura Pecuária e Abastecimento, 2017. 84p.
PANDEY, A. C.; SIROTHIA, N. N.; SINGH, R. S. A proposed land use capability classification system for Indian Sub-continent. Journal of Agricultural Engineering, 43(4):1-8, 2006. PRETTY, J.; BHARUCHA, Z. P. Sustainable intensification in
agricultural systems. Annals of Botany, 114(8):1571-1596, 2014.
RAMALHO FILHO, A.; BEEK, K. J. Sistema de avaliação da aptidão agrícola das terras. 3rd ed. Rio de Janeiro: MAARA, EMBRAPA, CNPS, 1995. 65p.
SAADAT, H. et al. A new approach for regional scale interrill and rill erosion intensity mapping using brightness index assessments from medium resolution satellite images.
Catena, 113:306-313, 2014.
SÃO PAULO. Levantamento por fotointerpretação das
classes de capacidade de uso das terras do estado de
São Paulo. Campinas: IAC, 1973. 20p.
SCHENATTO, K. et al. Use of the farmer’s experience variable in the generation of management zones. Semina: Ciências
Agrárias 38(4): 2305-20322, 2017.
SHENG, T. C. Soil conservation for small farmers in the humid tropics. Rome: FAO, 1989. 104p.
SILVA, S. H. G. et al. A technique for low cost soil mapping and validation using expert knowledge on a watershed in Minas Gerais, Brazil. Soil Science Society of America Journal 78(4):1310-1319, 2014.
SILVA, S. H. G. et al. Retrieving pedologist’s mental model from existing soil map and comparing data mining tools for refining a larger area map under similar environmental conditions in Southeastern Brazil. Geoderma, 267:65-77, 2016.
SILVA, V. A. et al. Soil maps, field knowledge, forest inventory and ecological-economic zoning as a basis for agricultural suitability of lands in Minas Gerais elaborated in GIS. Ciência e Agrotecnologia, 37(6):538-549, 2013.
SOIL SURVEY STAFF. Keys to soil taxonomy. 12th ed. United States Department of Agriculture Natural Resources Conservation Service, 2014. 410p.
SOUZA, E. et al. Pedotransfer functions to estimate bulk density from soil properties and environmental covariates: Rio Doce basin. Scientia Agricola,73(6): 525–534, 2016.