Hypertension Prevalence, Treatment and Control in Older Adults in a
Brazilian Capital City
Ana Luiza Lima Sousa,
1Sandro Rodrigues Batista,
2Andrea Cristina Sousa,
2Jade Alves S. Pacheco,
1Priscila Valverde
de Oliveira Vitorino,
3Valéria Pagotto
1Faculdade de Enfermagem, Universidade Federal de Goiás (UFG),1 Goiânia, GO – Brazil Faculdade de Medicina, Universidade Federal de Goiás (UFG),2 Goiânia, GO – Brazil
Escola de Ciências Sociais e da Saúde - Pontifícia Universidade Católica de Goiás,3 Goiânia, GO – Brazil
Mailing Address: Priscila Valverde de Oliveira Vitorino • Av. Carlos Elias, Qd. 21, Lt. 3. Postal Code 75084-100, São Carlos, Anápolis, GO – Brazil
E-mail: pvalverde@pucgoias.edu.br, fisioprivitorino@hotmail.com Manuscript received April 13, 2018, revised manuscript July 18, 2018, accepted August 02, 2018
DOI: 10.5935/abc.20180274
Abstract
Background: The diagnosis, treatment and control of arterial hypertension are fundamental for a reduction in cardiovascular outcomes, especially in the elderly. In Brazil, there are few studies that specifically identified these rates in the elderly population.
Objective: To verify rates of prevalence, treatment and control of hypertension in elderly people living in the urban area of a Brazilian capital city.
Methods: A cross-sectional, population-based, randomized, cluster-based study with 912 non-institutionalized elderly
individuals (≥ 60 years), living in urban areas in the city of Goiania, Midwest Brazil. Predictor variables were: age,
gender, socioeconomic and lifestyle aspects. Blood pressure measurements were performed at home; patients were
considered as having arterial hypertension when SBP and/or DBP ≥ 140/90 mmHg or when using antihypertensive drugs (dependent variable). Rates of hypertension treatment and control were evaluated. Variable association analyses
were performed by multivariate logistic regression and level of significance was set at 5%.
Results: The prevalence of arterial hypertension was 74.9%, being higher (78.6%) in men (OR 1.4, 95% CI: 1.04-1.92); the treatment rate was 72.6%, with higher rates being observed in smokers (OR 2.06, 95% CI: 1.28-3.33). The rate of hypertension control was 50.8%,being higher in women (OR 1.57, 95% CI: 1.19-2.08).
Conclusion: The prevalence rates were high. Treatment and control rates were low and associated with gender, age and
lifestyle, indicating the need for early and individual interventions. (Arq Bras Cardiol. 2018; [online].ahead print, PP.0-0)
Keywords: Hypertension/epidemiology; Hypertension/prevention and control; Prevalence; Aging; Blood Pressure; Cross-Sectional Studies.
Introduction
Despite the easy diagnosis and available treatments, arterial hypertension (AH) is still an underdiagnosed disease, with low control rates.1,2 Information on the prevalence,
knowledge of diagnosis, treatment and control among the elderly is scarce in developing countries, even though they are acknowledged as necessary for the monitoring and development of effective strategies for AH control.2
In Brazil, starting from the 1970s, there was a change in the population’s demographic profile, going from a mostly rural society with large families and young individuals to a mainly urban society, and with a larger proportion of elderly individuals.3
The prevalence of AH increases as the analyzed age group changes. In Brazil, the National Health Survey showed a 44.4%
prevalence of AH in individuals aged 60 to 64 years; 52.7% from 65 to 74 years and 55.5% for those aged 75 years or older.4 A study carried out in Tibet identified a progressive
increase in this rate, with a 19% variation in the 40-year age range and 78.1% in the 70-year age range.5 On the other
hand, the rates of knowledge of diagnosis, treatment and control were low.6
It can be observed that in the Brazilian elderly population, little has been analyzed beyond the prevalence data.7-10 Brazilian population surveys carried out in the
last 20 years, considering the adult population aged > 20 years, showed a prevalence of AH varying from 28.5% in the Southeast region11 to up to 53.2% in the Northern
region of the country.12 In this latter study, the rate of
knowledge of the diagnosis was 63.1% and the treatment rate was 85.4%,12 albeit not specifically among the elderly.
No population-based studies that analyzed all these rates in the elderly population in Brazil have been identified and this lack of information has been a barrier to the development of public health policies for this population.
Methods
This is a cross-sectional population-based study, carried out through a household survey and randomized cluster sampling, from the matrix project “Situação de saúde da população idosa do município de Goiânia-GO” (Health Status of the Elderly Population of the Municipality of Goiânia-GO), linked to the Rede de Vigilância à Saúde do Idoso (REVISI) (Health Surveillance Network of the Elderly) in the State of Goiás. The methodological and sample calculation details were described in previous publications.13,14
This study was developed by Universidade Federal de Goiás, the Municipal Health Secretariat of Goiânia and State Health Secretariat of the state of Goiás, through REVISI, after being approved by the Research Ethics Committee of Universidade Federal de Goiás (Protocol number 050/2009), in agreement with the Declaration of Helsinki.
An epidemiological survey was carried out, with the participation of people aged 60 and over, living in their homes and in the urban area of Goiânia. The sample was calculated considering the elderly population as 7% of the total 1,249,645 inhabitants, based on the year 2007,15 an
estimated frequency of 30% (lowest expected frequency among the variables investigated in the matrix project), a 95% confidence interval (CI), a 5% significance level, and 5% absolute precision. To the calculated sample (n = 823), 11% were added to compensate for losses, and 934 elderly were assessed. Of the total of 934 questionnaires, 22 were excluded due to data inconsistency, and the final sample consisted of 912 elderly individuals.
The study area was defined based on census sectors (CS). The sample units were the households and the elderly in elementary observation units. Firstly, the CS were identified using the Basic Urban Digital Map of Goiânia as the basic layer. The sampling process was based on the maps of blocks and allotments of the selected regions and was carried out in multiple stages starting from the identification of CS defined by the Instituto Brasileiro de Geografia e Estatística (IBGE - Brazilian Institute of Geography and Statistics).16 A total of
56 CS were selected, with an estimate of reaching, on average, 17 elderly individuals in each CS.
The data were collected from residents who were at home at the time of the interviewer’s visit and who accepted to participate in the study by signing the Free and Informed Consent Form. If, during data collection, two consecutive households with elderly residents were identified, the second house was excluded to minimize the conglomerate and neighborhood effect. The following inclusion criteria were considered in the study: age older than 60 years and being a resident of the household. Elderly individuals who were at the household at the time of the interview but were not residents or were unable to answer for any reason (dementia, unconsciousness) were excluded. In those cases, that household was disregarded, and the next house was considered.
The interviews were carried out by researchers properly trained to apply the study forms and also for the standardization of the procedures to be performed in data collection. The interviews were carried out from November 2009 to April 2010, considering the baseline for the Rede de
Vigilância à Saúde do Idoso (Health Surveillance Network of the Elderly) in the capital city. Further details on the method can be verified in a previous publication.17
At the time of data collection, information were obtained on age, gender, socioeconomic status (level of schooling, marital status and family income), modifiable risk factors (physical activity, smoking, alcohol consumption) and information on AH treatment. Blood pressure (BP) levels were also measured. BP was measured using an OMRON automatic device, model HEM-705CP, following the protocol of the Brazilian Guidelines.18 Three measurements were performed in the
same arm with the person in the sitting position, following a 3-to-5 minute interval, using the last two measurements for the calculation of the mean value, providing the difference between them was not greater than 4 mmHg. This was done to reduce data dispersion. It is worth noting that appropriate cuff sizes were used according to the arm circumference, using adequate sizes (standard, obese, pediatric) that covered two-thirds of arm extension.18
To identify AH prevalence, the elderly were considered hypertensive if they, during data collection, had systolic pressure values ≥ 140 mmHg or diastolic pressure ≥ 90 mmHg, or if they reported regular use of antihypertensive drugs, regardless of the BP value at the time of the interview.18
All patients who reported antihypertensive medication use at the time of data collection and who were able to show the prescription, or the medication boxes to be verified, were considered as undergoing treatment for AH.
The individual was considered to have controlled BP when he/she reported AH treatment and the mean BP value was lower than 140/90 mmHg.
Smoking status was classified into three groups: ex-smokers, regardless of the time since they had stopped smoking, non-smokers, for those who never smoked, and smokers. Alcohol consumption was identified according to the elderly individual’s response into two groups: those who reported consuming alcohol, even occasionally, and those who reported not consuming it at all. Individuals who reported regular physical activity (three or more times a week) were classified as non-sedentary, and those who practiced physical activity less than three times a week or did not practice any physical activity were classified as sedentary.
Statistical analysis
The quantitative variables were shown with their means and medians, standard deviations and 95%CI; the categorical variables were shown, according to their frequencies, as absolute numbers and percentages. The analysis of the normal distribution of data was performed using the Kolmogorov-Smirnov test.
Figure 1 – Flowchart of the assessed sample identifying normotensive and hypertensive participants; those undergoing treatment and the ones without treatment for hypertension; and with and without pressure control. Goiânia, Goiás, 2010.
Total sample n = 912 (100%)
Normotensive n = 229 (25.2%)
Hypertensive n = 683 (74.9%)
Undergoing treatment n = 496 (72.7%)
No treatment n = 187 (27.3%)
No pressure control n = 244 (49.2%)
With pressure control n = 252 (50.8%)
Multiple logistic regression analysis was used to estimate the independent effect of variables on outcomes such as AH prevalence, treatment and disease control. The variables that showed a p value < 0.20 in the bivariate analysis were tested in the multiple logistic regression models. All statistical tests were performed considering a level of significance of 5%.
Results
Of the 912 elderly, 683 (74.9%) were hypertensive, of which 72.6% were treated for AH and, among the treated ones, 50.8% had controlled BP (Figure 1).
Of the total sample (n = 912), 62.1% were females. The mean age was 71.5 years (SD ± 8.3), and the median age was 70 years (Table 1).
The AH prevalence was 74.9% (n = 683), of which 431 elderly individuals were identified as having BP ≥140 and/or 90 mmHg, whereas 252 elderly individuals had BP values within the normal range but used hypertensive medication. There was a difference in prevalence between genders, being 39.8% in men and 60.2% in women.
The prevalence of isolated systolic hypertension (ISH) was 29.2% in total, with no difference between genders, being significantly higher in the age group of 70 to 80 years (112; 42.1%) when compared with the age group of 60 to 70 years (94; 35.3%), with a prevalence ratio of 1.75 (95%CI: 1.38–2.20).
Lifestyle-related variables, such as smoking status, alcohol consumption, overweight/obesity, sedentary lifestyle, level of schooling, income and marital status showed no association with AH prevalence (Table 2).
Of the 431 individuals who were identified as having altered BP levels, 187 (43.4%) were unaware of the probable AH diagnosis and were not being treated for the disease. Of the 683 patients considered hypertensive, 496 (72.6%) reported regular use of antihypertensive medication, with
lower rates (67.6%) being observed in men when compared to women (75.9%) (Table 2).
Among those who received treatment for the disease, 252 (50.8%) showed BP control (SBP/DBP < 140/90mmHg), also with a difference between genders; the control rates were higher among those aged 60 to 70 years (Table 2).
As for alcohol consumption, there was an association with the control rate, with lower control rates being observed among those who consumed alcohol (Table 2).
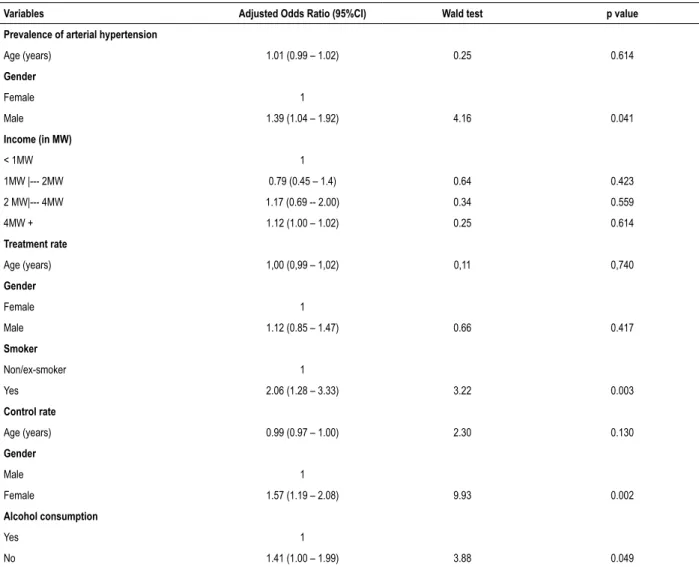
The multiple logistic regression analysis showed there was a significant association between the prevalence rate and the male gender, with a higher probability of AH (OR = 1.39, 95%CI 1.04-1.92). Current smoker was associeted with the treatment rate (OR = 2.06, 95%CI: 1.28-3.33). Female gender (OR = 1.57, 1.19-2.08) and alcohol consumption (OR = 1.41, 95%CI 1.00-1.99) were associated with the control rate (Table 3).
Discussion
The present study analyzed the prevalence, treatment and control rates of AH in a representative sample of the urban elderly population in the city of Goiânia, Brazil. The prevalence of AH was 74.9%, higher than observed in the country’s adult population shown by other studies carried out in different regions.8,11,12,19-21 The prevalence of AH in
individuals aged between 50 and 70 years is approximately 6 to 8-fold higher than that in young adults, aged between 18 and 29 years,19-22 consistent with 16 studies carried out in the
country between 1989 and 2007, which reported prevalence rates of AH higher than 60% in the elderly population.10
Table 1 – General characteristics of elderly individuals according to the arterial hypertension status. Goiânia, Goiás, Brazil, 2010
Variables
Hypertensive n = 683 Non-hypertensive n = 229
p
Total n = 912
Median (Interquartile range)
Median (Interquartile range)
Median (Interquartile range)
Age (years) 70.0 (64.0 – 77.0) 70.0 (66.0 – 77.5) 0.275** 70.0 (65.0 – 77.0)
SBP (mmHg) 144.0 (126.0 – 158.0) 124.0 (114.0 – 132.5) < 0.001** 136.5 (123.0 – 152.0)
DBP(mmHg) 81.0 (73.0 – 89.0) 73.0 (66.5 – 79.4) < 0.001** 79.4 (70.0 – 87.0)
n(%) n(%) n(%)
Gender 0,043†
Male 272 (39.8) 74 (32.3) 346 (37.9)
Female 411 (60.2) 155 (67.7) 566 (62.1)
Age range 0.906†
60 |-- 70 335 (49.0) 106 (46.3) 441 (48.4)
70 |-- 80 222 (32.5) 79 (34.5) 301 (33.0)
80 |-- 90 110 (16.1) 38 (16.6) 148 (16.2)
90 + 16 (2.3) 6 (2.6) 22 (2.4)
Marital status 0.730†
Married 330 (48.3) 118 (51.5) 448 (49.1)
Single 69 (10.1) 19 (8.3) 88 (9.6)
Widowed 220 (32.2) 73 (31.9) 293 (32.1)
Divorced 61 (8.9) 19 (8.3) 80 (8.8)
Level of schooling 0.831†
Illiterate 107 (15.7) 34 (14.8) 141 (15.5)
Never attended school/Can read 34 (5.0) 10 (4.4) 44 (4.8)
Complete/incomplete Elementary School 324 (47.4) 106 (46.3) 430 (47.1)
Complete/incomplete High School 144 (21.1) 50 (21.8) 194 (21.3)
Complete/incomplete College/University 67 (9.8) 24 (10.5) 91 (10.0)
Income (in MW*) 0.173†
< 1MW 210 (30.8) 54 (23.6) 264 (29.0)
1MW |--- 2MW 284 (41.6) 110 (48.0) 394 (43.2)
2MW|--- 4MW 118 (17.3) 43 (18.8) 161 (17.7)
4MW + 70 (10.3) 22 (9.6) 92 (10.1)
Smoker 0.240†
Yes 73 (10.7) 16 (7.0) 89 (9.8)
No 368 (54.1) 132 (57.9) 500 (55.1)
Ex-smoker 239 (35.1) 80 (35.1) 319 (35.1)
Alcoholism 0.243†
Yes 147 (21.8) 38 (16.7) 185 (20.5)
No 459 (68.0) 162 (71.4) 621 968.8)
Ex-alcoholic 69 (10.2) 27 (11.9) 96 (10.6)
Physical activity 0.374†
Yes 206 (30.2) 73 (31.9) 279 (30.6)
No 466 (68.2) 155 (67.7) 621 (68.1)
Did not answer 11 (1.6) 1 (0.4) 12 (1.3)
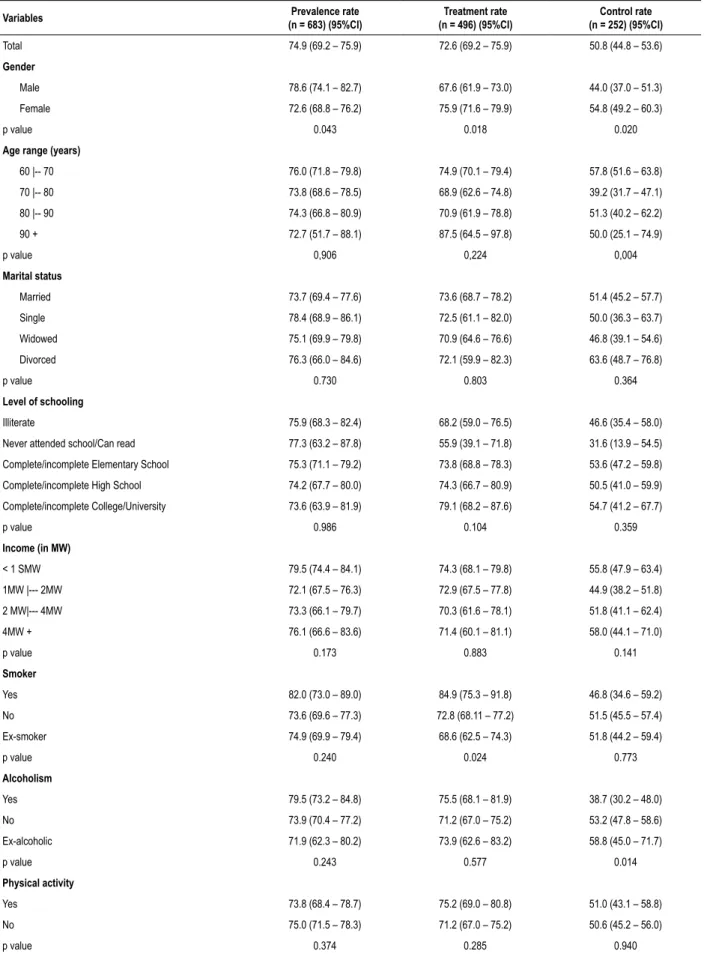
Table 2 – Hypertension prevalence, treatment and control in elderly individuals from a Brazilian capital city. Goiânia, Goiás, 2010
Variables Prevalence rate
(n = 683) (95%CI)
Treatment rate (n = 496) (95%CI)
Control rate (n = 252) (95%CI)
Total 74.9 (69.2 – 75.9) 72.6 (69.2 – 75.9) 50.8 (44.8 – 53.6)
Gender
Male 78.6 (74.1 – 82.7) 67.6 (61.9 – 73.0) 44.0 (37.0 – 51.3)
Female 72.6 (68.8 – 76.2) 75.9 (71.6 – 79.9) 54.8 (49.2 – 60.3)
p value 0.043 0.018 0.020
Age range (years)
60 |-- 70 76.0 (71.8 – 79.8) 74.9 (70.1 – 79.4) 57.8 (51.6 – 63.8)
70 |-- 80 73.8 (68.6 – 78.5) 68.9 (62.6 – 74.8) 39.2 (31.7 – 47.1)
80 |-- 90 74.3 (66.8 – 80.9) 70.9 (61.9 – 78.8) 51.3 (40.2 – 62.2)
90 + 72.7 (51.7 – 88.1) 87.5 (64.5 – 97.8) 50.0 (25.1 – 74.9)
p value 0,906 0,224 0,004
Marital status
Married 73.7 (69.4 – 77.6) 73.6 (68.7 – 78.2) 51.4 (45.2 – 57.7)
Single 78.4 (68.9 – 86.1) 72.5 (61.1 – 82.0) 50.0 (36.3 – 63.7)
Widowed 75.1 (69.9 – 79.8) 70.9 (64.6 – 76.6) 46.8 (39.1 – 54.6)
Divorced 76.3 (66.0 – 84.6) 72.1 (59.9 – 82.3) 63.6 (48.7 – 76.8)
p value 0.730 0.803 0.364
Level of schooling
Illiterate 75.9 (68.3 – 82.4) 68.2 (59.0 – 76.5) 46.6 (35.4 – 58.0)
Never attended school/Can read 77.3 (63.2 – 87.8) 55.9 (39.1 – 71.8) 31.6 (13.9 – 54.5)
Complete/incomplete Elementary School 75.3 (71.1 – 79.2) 73.8 (68.8 – 78.3) 53.6 (47.2 – 59.8)
Complete/incomplete High School 74.2 (67.7 – 80.0) 74.3 (66.7 – 80.9) 50.5 (41.0 – 59.9)
Complete/incomplete College/University 73.6 (63.9 – 81.9) 79.1 (68.2 – 87.6) 54.7 (41.2 – 67.7)
p value 0.986 0.104 0.359
Income (in MW)
< 1 SMW 79.5 (74.4 – 84.1) 74.3 (68.1 – 79.8) 55.8 (47.9 – 63.4)
1MW |--- 2MW 72.1 (67.5 – 76.3) 72.9 (67.5 – 77.8) 44.9 (38.2 – 51.8)
2 MW|--- 4MW 73.3 (66.1 – 79.7) 70.3 (61.6 – 78.1) 51.8 (41.1 – 62.4)
4MW + 76.1 (66.6 – 83.6) 71.4 (60.1 – 81.1) 58.0 (44.1 – 71.0)
p value 0.173 0.883 0.141
Smoker
Yes 82.0 (73.0 – 89.0) 84.9 (75.3 – 91.8) 46.8 (34.6 – 59.2)
No 73.6 (69.6 – 77.3) 72.8 (68.11 – 77.2) 51.5 (45.5 – 57.4)
Ex-smoker 74.9 (69.9 – 79.4) 68.6 (62.5 – 74.3) 51.8 (44.2 – 59.4)
p value 0.240 0.024 0.773
Alcoholism
Yes 79.5 (73.2 – 84.8) 75.5 (68.1 – 81.9) 38.7 (30.2 – 48.0)
No 73.9 (70.4 – 77.2) 71.2 (67.0 – 75.2) 53.2 (47.8 – 58.6)
Ex-alcoholic 71.9 (62.3 – 80.2) 73.9 (62.6 – 83.2) 58.8 (45.0 – 71.7)
p value 0.243 0.577 0.014
Physical activity
Yes 73.8 (68.4 – 78.7) 75.2 (69.0 – 80.8) 51.0 (43.1 – 58.8)
No 75.0 (71.5 – 78.3) 71.2 (67.0 – 75.2) 50.6 (45.2 – 56.0)
Table 3 – Multivariate logistic regression analysis of the factors associated with the analyzed rates
Variables Adjusted Odds Ratio (95%CI) Wald test p value
Prevalence of arterial hypertension
Age (years) 1.01 (0.99 – 1.02) 0.25 0.614
Gender
Female 1
Male 1.39 (1.04 – 1.92) 4.16 0.041
Income (in MW)
< 1MW 1
1MW |--- 2MW 0.79 (0.45 – 1.4) 0.64 0.423
2 MW|--- 4MW 1.17 (0.69 -- 2.00) 0.34 0.559
4MW + 1.12 (1.00 – 1.02) 0.25 0.614
Treatment rate
Age (years) 1,00 (0,99 – 1,02) 0,11 0,740
Gender
Female 1
Male 1.12 (0.85 – 1.47) 0.66 0.417
Smoker
Non/ex-smoker 1
Yes 2.06 (1.28 – 3.33) 3.22 0.003
Control rate
Age (years) 0.99 (0.97 – 1.00) 2.30 0.130
Gender
Male 1
Female 1.57 (1.19 – 2.08) 9.93 0.002
Alcohol consumption
Yes 1
No 1.41 (1.00 – 1.99) 3.88 0.049
Other studies carried out with the elderly found a greater proportion of women undergoing treatment.
and 70.1% (95%CI 68.2–71.8) in men,22 in opposition to our
study, where women showed lower rates. The difference in AH prevalence between genders has been previously described in several studies carried out in different countries, as well as the association with age.23-26 Until the age of 60 years, the
proportion of hypertensive women is lower because they rely on the hormonal protection of estrogens, whereas it is predicted that these rates will be equal between men and women after the latter go through menopause.24
Similarly, our study showed that ISH had higher prevalence rates among those aged 70 years and older, with no difference between genders, which contrasts with the Polish study that found higher ISH rates in men older than 85 years.22
The treatment rate found in our study was higher among women and showed no association with the different age groups. Other studies carried out with the elderly found a greater proportion of women undergoing treatment.
Treatment is related to the access to health services, as well as the level of knowledge of AH diagnosis and the prevalence.28,29
In our country, the identification of these rates, whether among the general population or in specific age groups, comes from population-based surveys or specific studies under certain conditions, such as implemented programs.30 The difficulty of
having access to and receiving care at health services do not allow the opportunity for diagnosis and treatment. This is even more serious when it is related to elderly individuals with AH who are unaware of their diagnosis.
1. Supiyev A, Nurgozhin T, Zhumadilov Z, Peasey A, Hubacek JA, Bobak M. Prevalence, awareness, treatment and control of dyslipidemia in older persons in urban and rural population in the Astana region, Kazakhstan. BMC Public Health. 2017;17(1):651.
2. Chow CK, Teo KK, Rangarajan S, Islam S, Gupta R, Avezum A, et al. Prevalence, awareness, treatment, and control of hypertension in rural and urban communities in high-, middle-, and low-income countries. JAMA. 2013;310(9):959-68.
3. Vasconcelos AM, Gomes MM. Transição demográfica: a experiência brasileira. Epidemiol Serv Saúde. 2012;21(4):539-48.
4. Instituto Brasileiro de Geografia e Estatística. IBGE. Pesquisa Nacional de Saúde 2013. Percepção do Estado de Saúde, Estilos de Vida e Doenças Crônicas. Rio de Janeiro, 2013.
5. Huang X, Zhou Z, Liu J, Song W, Chen Y, Liu Y, et al. Prevalence, awareness, treatment, and control of hypertension among China’s Sichuan Tibetan population: A cross-sectional study. Clin Exp Hypertens. 2016;38(5):457-63.
6. Huang G, Xu JB, Zhang TJ, Li Q, Nie XL, Liu Y, et al. Prevalence, awareness, treatment, and control of hypertension among very elderly Chinese: results of a community-based study. J Am Soc Hypertens. 2017;11(8):503-12 e2.
7. Tortorella C, Corso ACT, Gonzales-Chica DA, Melhen ARF. Time trends of hypertension and diabetes mellitus prevalence among adults registered in the Brazilian National Health System, in Florianopolis, Santa Catarina State, Brazil, 2004-2011. Epidemiol Serv Saude. 2017;26(3):469-80.
8. Lobo LAC, Canuto R, Dias-da-Costa JS, Pattussi MP. Time trend in the prevalence of systemic arterial hypertension in Brazil. Cad Saude Publica. 2017;33(6):e00035316.
9. Mendes TA, Goldbaum M, Segri NJ, Barros MB, Cesar CL, Carandina L. Factors associated with the prevalence of hypertension and control practices among elderly residents of Sao Paulo city, Brazil. Cad Saude Publica. 2013;29(11):2275-86.
10. Picon RV, Fuchs FD, Moreira LB, Fuchs SC. Prevalence of hypertension among elderly persons in urban Brazil: a systematic review with meta-analysis. Am J Hypertens. 2013;26(4):541-8.
11. Ribeiro TS, Carvalho DP, Guimaraes MT, Campina NN, Lobarinhas MR, Lopes AL, et al. Prevalence of hypertension and its associated factors in contaminated areas of the Santos-Sao Vicente Estuarine region and Bertioga, Brazil: 2006-2009. Environ Sci Pollut Res Int. 2016;23(19):19387-96.
12. Almeida RC, Dias DJ, Deguchi KT, Spesia CH, Coelho OR. Prevalence and treatment of hypertension in urban and riverside areas in Porto Velho, the Brazilian Amazon. Postgrad Med. 2015;127(1):66-72.
13. Vera I, Lucchese R, Nakatani AYK, Pagotto V, Montefusco SRA, Sadoyama G. Funcionalidade familiar em longevos residentes em domicílio. Rev Bras Enferm. 2015;68(1):68-75.
14. Pimentel W, Pagotto V, Nakatani A, Pereira L, Menezes R. Quedas e qualidade de vida: associação com aspectos emocionais em idosos comunitários. Geriatr Gerontol Aging. 2015;9(2):42-8.
15. Instituto Brasileiro de Geografia e Estatística. IBGE.Contagem da População 2007. Rio de Janeiro; 2007.
16. Instituto Brasileiro de Geografia e Estatística. IBGE. Contagem da População 1996. Rio de Janeiro;1997.
17. Castro DC, Nunes DP, Pagotto V, Pereira LV, Bachion MM, Nakatani AYK. Incapacidade funcional para atividades básicas de vida diária de idosos: estudo populacional. Cienc Cuid Saude. 2016;15(1):9.
References
Despite the efforts of health professionals at all levels, blood pressure control rates worldwide are only reasonable. Canada has a rate of 64.6%,31 Switzerland has 59.4%,32 the United States has
57%33 and England, 37%.34 In Brazil, these rates vary between
22.5% in the North region11 and 24.2% in the Midwest.20
Ignoring a high BP rate is a risk to one’s cardiovascular and renal health, as it increases the chances of life-threatening complications, and the higher the BP, the greater the risk of consequences for the heart and blood vessels in the major organs, such as the brain and kidneys, regardless of the age range.29
Conclusions
The prevalence and treatment rates of AH found in this study’s population were high, 74.9% and 72.6%, respectively. However, only 50.8% of the individuals achieved their blood pressure control targets. Women showed higher rates of treatment and control when compared to men.
Author contributions
Conception and design of the research: Sousa ALL, Batista SR, Pagotto V; acquisition of data and statistical analysis: Sousa ALL; analysis and interpretation of the data: Sousa ALL, Batista SR, Vitorino PVO, Pagotto V; writing of the manuscript: Sousa ALL,
Batista SR, Sousa AC, Pacheco JAS, Vitorino PVO, Pagotto V; critical revision of the manuscript for intellectual content: Sousa ALL, Batista SR, Sousa AC, Pacheco JAS, Vitorino PVO, Pagotto V.
Potential Conflict of Interest
No potential conflict of interest relevant to this article was reported.
Sources of Funding
This study was funded by Fundação de Apoio à Pesquisa de Estado de Goiás - FAPEG.
Study Association
This study is not associated with any thesis or dissertation work.
Ethics approval and consent to participate
This is an open-access article distributed under the terms of the Creative Commons Attribution License
18. Malachias M, Souza W, Plavnik F, Rodrigues C, Brandão A, Neves M; Sociedade Brasileira de Cardiologia. 7ª Diretriz brasileira de hipertensão arterial. Arq Bras Cardiol. 2016;107(3):1-103.
19. James PA, Oparil S, Carter BL, Cushman WC, Dennison-Himmelfarb C, Handler J, et al. 2014 evidence-based guideline for the management of high blood pressure in adults: Report from the panel members appointed to the Eighth Joint National Committee (JNC 8). JAMA. 2014;311(5):507-20.
20. Rosario TM, Scala LN, Franca GA, Pereira MG, Jardim PB. Prevalência, controle e tratamento da hipertensão arterial sistemica em Nobres, MT. Arq Bras Cardiol. 2009;93(3):672-8.
21. Jardim PC, Gondim MR, Monego ET, Moreira HG, Vitorino PV, Souza WK, et al. Hipertensão Arterial e alguns fatores de risco em uma capital brasileira. Arq Bras Cardiol. 2007;88(4):452-7.
22. Zdrojewski T, Wizner B, Wiecek A, Slusarczyk P, Chudek J, Mossakowska M, et al. Prevalence, awareness, and control of hypertension in elderly and very elderly in Poland: results of a cross-sectional representative survey. J Hypertens. 2016;34(3):532-8.
23. Choi HM, Kim HC, Kang DR. Sex differences in hypertension prevalence and control: Analysis of the 2010-2014 Korea National Health and Nutrition Examination Survey. PLoS One. 2017;12(5):e0178334.
24. Chu SH, Baek JW, Kim ES, Stefani KM, Lee WJ, Park YR, et al. Gender differences in hypertension control among older korean adults: Korean social life, health, and aging project. J Prev Med Public Health. 2015;48(1):38-47.
25. Xu T, Zhu G, Liu J, Han S. Gender-specific prevalence and associated risk factors of high normal blood pressure and hypertension among multi-ethnic Chinese adolescents aged 8-18 years old. Blood Press. 2015;24(3):189-95.
26. Shirani S, Gharipour M, Khosravi A, Kelishadi R, Habibi HR, Abdalvand A, et al. Gender differences in the prevalence of hypertension in a representative
sample of Iranian population: the Isfahan Healthy Heart Program. Acta Biomed. 2011;82(3):223-9.
27. Kiau BB, Kau J, Nainu BM, Omar MA, Saleh M, Keong YW, et al. Prevalence, awareness, treatment and control of Hypertension among the elderly: the 2006 National Health and Morbidity Survey III in Malaysia. Med J Malaysia. 2013;68(4):332-7.
28. Malhotra R, Chan A, Malhotra C, Ostbye T. Prevalence, awareness, treatment and control of hypertension in the elderly population of Singapore. Hypertens Res. 2010;33(12):1223-31.
29. Wo r l d H e a l t h O r g a n i z a t i o n . W H O. G l o b a l s t a t u s r e p o r t o n noncommunicable diseases Géneve; 2014.
30. Minelli C, Borin LA, Trovo M de C, Reis GC. Hypertension Prevalence, Awareness and Blood Pressure Control in Matao, Brazil: A Pilot Study in Partnership With the Brazilian Family Health Strategy Program. J Clin Med Res. 2016;8(7):524-30.
31. McAlister FA, Wilkins K, Joffres M, Leenen FH, Fodor G, Gee M, et al. Changes in the rates of awareness, treatment and control of hypertension in Canada over the past two decades. CMAJ. 2011;183(9):1007-13.
32. Guessous I, Bochud M, Theler JM, Gaspoz JM, Pechere-Bertschi A. 1999-2009 Trends in prevalence, unawareness, treatment and control of hypertension in Geneva, Switzerland. PLoS One. 2012;7(6):e39877.
33. Olives C, Myerson R, Mokdad AH, Murray CJ, Lim SS. Prevalence, awareness, treatment, and control of hypertension in United States counties, 2001-2009. PLoS One. 2013;8(4):e60308.