www.rpped.com.br
REVISTA
PAULISTA
DE
PEDIATRIA
ORIGINAL
ARTICLE
Body
weight
and
food
consumption
scores
in
adolescents
from
northeast
Brazil
Augusto
Cesar
Barreto
Neto
∗,
Maria
Izabel
Siqueira
de
Andrade,
Vera
Lúcia
de
Menezes
Lima,
Alcides
da
Silva
Diniz
UniversidadeFederaldePernambuco(UFPE),Recife,PE,Brazil
Received3September2014;accepted18January2015 Availableonline29June2015
KEYWORDS Overweight; Foodconsumption; Cardiovascular diseases; Adolescents
Abstract
Objective: Theaimofthepresentstudywas todeterminetheprevalenceofexcessweight andanalyzeeatinghabitsinrelationtocardiovasculardiseaseinadolescentsfromthecityof VitóriadeSantoAntão,stateofPernambuco,northeastBrazil.
Methods: Across-sectionalstudywascarriedoutwithmaleandfemalestudents(10---19years old)enrolledatpublicandprivateschoolsinVitóriadeSantoAntão.Sociodemographic, anthro-pometric and lifestyle variables were collected. Food consumption was evaluated using a FoodFrequencyQuestionnaireandsubsequentlyconvertedtomonthlyintakepatternscores, obtainingtheintakedistributionforagroupoffoodsassociatedwiththeriskofdeveloping car-diovasculardiseaseandforagroupofprotectivefoods.Thesignificancelevelforthestatistical testswassetat5.0%.
Results: Thesampleconsistedof2866students.Thefemalegenderaccountedfor54.2%ofthe sample,andmedianagewas14years(interquartilerange:12---16years).Thefoodintakescores showedgreaterdispersioninthegroupofprotectivefoods(51.1%).Highermedianscoresfor consumptionofriskfoodswerefoundamongadolescentswhosemothershadmorethan9years ofschooling(p<0.001).
Conclusions: Excessweightwasprevalentamongthestudentsanalyzed.Theconsumptionof riskfoodswasonlyassociatedwithmaternalschooling,whichshowstheneedfornutritional interventionsdirectedatfamilies,regardlessofsocioeconomicstatus.
© 2015Sociedadede Pediatria de SãoPaulo. Published by Elsevier Editora Ltda.All rights reserved.
DOIoforiginalarticle:http://dx.doi.org/10.1016/j.rpped.2015.01.002 ∗Correspondingauthor.
E-mail:[email protected](A.C.BarretoNeto).
PALAVRAS-CHAVE Sobrepeso;
Consumoalimentar; Doenc¸as
cardiovasculares; Adolescentes
Pesocorporaleescoresdeconsumoalimentaremadolescentesnonordestebrasileiro
Resumo
Objetivo: Determinaraprevalênciadeexcessodepesoeanalisaroconsumoalimentarderisco eprotec¸ãoparadoenc¸ascardiovascularesemadolescentesescolaresdacidadedeVitóriade SantoAntão,Pernambuco,Brasil.
Métodos: Estudotransversalcomadolescentesdeambosossexosentre10e19 anos, matricu-ladosem39escolaspúblicaseprivadasdeVitóriadeSantoAntão(PE).Foramobtidasvariáveis sociodemográficas,antropométricasedoestilodevida.Oconsumoalimentarfoiavaliadopor meio de questionário de frequência alimentar e posteriormente convertido em escores de padrão deconsumo mensal.Obtiveram-se adistribuic¸ãodeconsumo para um grupode ali-mentos associadosaoriscodedesenvolvimentodedoenc¸ascardiovasculares(GrupoRisco)e umgrupodealimentosprotetores(GrupoProtec¸ão).Oníveldesignificânciausadonadecisão dostestesestatísticosfoide5%.
Resultados: Aamostrafoiconstituídapor2.866escolares;54,2%dosexofeminino,comidade medianade14anos(IntervaloInterquartílico=12---16).Aanálisedosescoresdeconsumo alimen-tarmostroumaiordispersãonogrupodealimentosprotetores(51,1%)emaioresmedianasde consumodealimentosderisconosadolescentescommãesdeescolaridade>9anos(p<0,001).
Conclusões: Oexcessodepesofoifrequentenosadolescentesestudados.Osescoresde con-sumo alimentar do grupo risco revelaram associac¸ão apenas com a escolaridade materna e evidenciaram anecessidade demaior conhecimentode educac¸ãonutricional asfamílias, independentementedascondic¸õessocioeconômicas.
© 2015Sociedadede Pediatriade SãoPaulo. Publicado porElsevier Editora Ltda.Todosos direitosreservados.
Introduction
Inrecentyears,Brazilhasexperiencedasignificantchange intheeatingpatternsofthepopulation,aphenomenonthat ispartofthenutritionaltransitioncontext,withasignificant increaseintheprevalenceofoverweightandobesity.1
Itisafactofconcernthatexcessweightaffects
individ-ualssinceearlyages,especiallyinadolescence.Datafrom
theHouseholdBudgetSurvey(POF---PesquisadeOrc¸amento
Familiar)bytheBrazilianInstituteofGeographyand
Statis-tics---IBGEshowthatbetween1974---1975and2008---2009,
theprevalenceofoverweightamongadolescentsincreased
from11.3%to20.5%, andtheobesity rateincreasedfrom
1.1%to4.9%.2,3
Duetothischangeinthenutritionalpattern,assessment
offoodconsumptioninadolescencehasreceivedattention,
particularly considering propositions thatassociate
inade-quate eating habits in childhood and adolescence to the
development of chronic diseases in adulthood, especially
cardiovasculardiseases.4
In spite of the existing informationon the prevalence
of overweight and obesity in different age groups, data
fromNortheastBraziladolescentsarestillscarceandmore
researchisneededoutsidethemetropolitanarea,wherethe
behaviorofadolescentsoccursinadifferentiatedmanner.
Additionally, analysis of the eating habits of this
popu-lation group allows the identification of dietary factors
associated with the genesis of excess weight, with the
possibilityof creatinginterventionsandpublicpoliciesfor
controlandpreventionofobesityandassociateddiseases.
Therefore,theaimofthisstudywastodeterminethe
preva-lenceof overweight and analyze risk and protective food
consumption for cardiovasculardisease (CVD)among
ado-lescentstudentsinthecityofVitóriadeSantoAntão,state
ofPernambuco,innortheastBrazil.
Method
This wasa cross-sectional study withadolescents of both genders,agedbetween10and19years,enrolledinpublic andprivateschoolsofVitóriadeSantoAntão,Pernambuco, fromApril2010toAugust2011.Theadolescentspresentat thetimeofenrollmentwereeligibleforthestudy,andwe excluded thosewho had/reportedmental health problem (reported by parents or school teachers), physical prob-lem (duetothe impossibilityof obtaininganthropometric measurements), consumptive diseases, pregnancy or use of drugs that interfered with glucoseor lipidmetabolism and/orbloodpressurelevels.
Sample size was estimated using the SampleXS pro-gram(BrixtonHealth,BrixtonUKI2,UK)usingtheformula:
n=A/[E*E+(A/N)], where n=sample size; A=3.8416PQW;
P=prevalenceofthepopulationinpercentage;Q=(100−P);
E=maximum acceptable sample error; w=likely effect of design; N=population size. For the calculation, an esti-mated prevalence of metabolic syndrome of 3.0% was taken as reference,5 as it was calculated by a previous
researchproject entitled‘‘Profile ofMetabolicSyndrome
and Apolipoproteins in School Adolescents with Excess Weight in the Municipality of Vitoria de Santo Antao, Pernambuco’’, which has excess weight as one of the
outcomevariables. The referencepopulation consisted of
21,515adolescentsenrolledintheschools;confidencelevel
used.Theminimumsamplesizewas2473students.To
cor-rectanylossesorrefusals,identifiedinthepilotstudy,this
amount was increased by 15%, and thus the final sample
consistedof2844students.
For sample selection, we identified the total number
of public(n=31) andprivate (n=8)schools, which offered
classes from the 6th grade of Elementary School and/or
HighSchoolinthemunicipality ofVitória deSantoAntão,
in2009.Inordertoobtaintherequiredproportionalityina
stratifiedsample,schoolswereorganizedbygradesasurban
public,ruralpublicandprivateandrandomlyselectedusing
theRandomizerprogram(SocialPsychologyNetwork
Associ-ation,Middletown,CT,USA).Thegradesweredefinedasthe
studyconglomerates,consideringamaximumof40students
perclass.
Datawerecollectedbynursingandnutrition
profession-alsandstudentsat theFederalUniversityof Pernambuco.
The entire staff wasappropriately trainedand monitored
by the project coordinators and the study was carried
outonly after approval by the Institutional Review Board
ofthe HealthSciences Centerof UniversidadeFederal de
Pernambuco (CEP/CCS/UFPE), according with Resolution
196/96 of the National Health Council-Brazil, under
pro-tocol n.262/2009. The parents/guardians of thestudents
receivedinformationabouttheproject,itsobjectivesand
theprocedures tobe performed and signed the informed
consentform.
Demographicandsocioeconomicdataoftheparticipants
wereobtainedfollowingtherecommendationsofthe
Brazil-ianInstituteof GeographyandStatistics(IBGE),6withthe
socioeconomicclassclassified accordingtoBrazilian
Asso-ciation of Research Companies [Associac¸ão Brasileira de
EmpresasdePesquisa]-ABEP,7whichdividessocioeconomic
classesintocategoriesfromAtoE.
Weightandheightweremeasuredaccordingtothe
tech-nique recommended by Lohman et al.,8 using a Balmak®
scalewithcapacityofupto150kgand100gprecision,
cal-ibratedandtested by theNational Institute of Metrology,
StandardizationandIndustrialQuality[InstitutoNacionalde
Metrologia,Normalizac¸ãoeQualidadeIndustrial---INMETRO]
of Pernambuco.Height was measured with astadiometer
attachedtothescalewithaprecisionof1mmandaccuracy
of0.5cm.
Body mass index (BMI) was classified in percentiles
accordingtogenderandagegroup.9ThosewithBMI<85
per-centilewereconsideredindividualswithoutexcessweight,
andthosewithBMI≥85percentilewereclassifiedashaving
excessweight(includingoverweightandobesity).
Waist(WC)andneck(NC)circumferencemeasurements
were obtained according to the techniques proposed by
Sarahetal.10andOlubukolaetal.11Theseprocedureswere
performedusingaSanny®inelasticmeasuringtapein
dupli-cate, with a maximum variation of 0.1cm between the
twomeasurements, which wererepeated ifthis variation
wasexceeded.The cutoffs usedfor the NCanalysiswere
those proposed by Hingorjo et al.,12 adapted for
adoles-cents,whichdefineashavingexcessweightindividualswith
NC>35.5cmand NC>32cm for males and females,
respec-tively.ForWC,thecutoffsusedwerethoserecommended
bytheInternationalDiabetesFederation,13whichidentifies
abdominalobesityasWC≥P90.WiththemeasuresofWCand
heightit waspossible to calculate the waist/height ratio
(WHtR),establishingascutoffforabdominalobesityvalues
≥0.5.14,15
Todeterminethelevelofphysicalactivity,weusedthe
International Physical Activity Questionnaire-IPAQ,16 being
categorized as ‘‘physically active’’ those subjects who
reportedparticipatinginatleast60minofmoderateto
vig-orousphysical activitiesforfiveor moredaysaweek,and
as‘‘insufficientlyactive’’theotheradolescents.
Regardingsmokingandalcoholconsumption,weusedthe
versionforstudents,translatedintoPortuguese,ofthe
ques-tionnaireproposedbytheCentersfor DiseaseControl and
Preventioninitsannualsurvey.17Smokerswerethose
indi-vidualswhoreportedtheysmokedat leastonceaweekor
dailyinthelastmonth,andformersmokerswho,atthetime
oftheinterview,werenonsmokers,buthadbeeninthepast.
Alcoholusewasinferredbasedonalcoholintakeinthelast
72handthelast30days,withriskconsumptionrepresenting
theintakeoffivedosesofalcoholicbeverageswithina2-h
period,atleastonceinthelast30daysandthesensation
ofbeingdrunkatleastonceatthesametimeinterval.
This study assessed the consumption of risk and
pro-tective foods for CVD.Forthat purpose, 30foods or food
preparations were recorded through the Food Frequency
Questionnaire(FFQ)andclassifiedintofivecategoriesof
fre-quencyofconsumption:F1=never;F2=lessthanonce/week;
F3=onceor twice/week;F4=threeto fourtimes/weekand
F5=fiveormoretimes/week.
For the frequency of consumption to be treated as a
quantitativevariable,weusedthemodelofthescores
pro-posedbyFornesetal.,18withconversionofthecategories
intomonthlyconsumptionfrequency,assigningaweight(S)
toeachcategoryoffrequency.Maximumweightwasdefined
asS5=1fordaily consumption,andtheotherswere
calcu-lated usingtheequation:Sn=(1/30) [a+b/2] (with aandb
beingthenumberofdaysofthefrequency).
Therefore, the consumption frequency scores were
obtainedfortwofoodgroups:
1 Risk group(consisting of risk foodsfor CVD): fatty and
curedmeats,viscera,poultrywithskin,wholemilkandits
products,cannedfoodandcoldmeats,softdrinks,fried
foods and fast foods (chips, burgers, French fries, hot
dogsandpizza),artificialjuiceanddesserts(chocolate,
sweets,cakesandicecream).
2 Protectivegroup(includingprotectivefoodsorthosenot
considered arisk for CVD): cerealsand cerealproducts
(rice, bread,couscous, noodles),tubers, legumes, fish,
fruitsandsalads.
The frequency score of each group was obtained by
adding the weight of each item. The food consumption
modelwassubsequentlyassessedbasedonsocioeconomic,
anthropometricandlifestylevariables.
The tabulation of the data was performed using
Epi-data program, release 3.1 (EpiData Association, Odense,
DK). In order to detect errors,data entry wasrepeated,
andusingthecomparisonfunctionforduplicatefiles,
vali-date,typingerrorsweredetectedandcorrected.Datawere
analyzed withStatistical Package for the Social Sciences,
release13.0.(SPSS,Inc.,Chicago,IL,USA).Whendescribing
proportions,anapproximationofthebinomialdistribution
Table1 Prevalenceofexcessweightandabdominalobesity,accordingtogenderandanthropometricvariablesofadolescent students.VitóriadeSantoAntão,Pernambuco,Brazil2012.
Nutritionalstatus Gender p-value
Male1312(45.8%) Female1554(54.2%) Total
n(%) 95%CI n(%) 95%CI n(%) 95%CI
BMIa
Withexcessweight 231(17.6) 15.5---19.7 279(18.0) 16.0---19.9 510(17.8) 16.4---19.2 0.80 Withoutexcessweight 1081(82.4) 80.2---84.4 1.275(82.0) 80.0---83.9 2.356(82.2) 80.7---83.5
WCb
Abdominalobesity 58(4.4) 3.3---5.6 63(4.1) 3.1---5.1 121(4.2) 3.5---5.0 0.62 Normalweight 1.254(95.6) 94.3---96.6 1.491(95.9) 94.8---96.8 2.745(95.8) 94.9---96.4
WHtRc 0.74
Abdominalobesity 152(11.6) 9.9---13.4 174(11.2) 9.6---12.8 326(11.4) 10.2---12.5 Normalweight 1.160(88.4) 86.5---90.0 1.380(88.8) 87.1---90.3 2.540(88.6) 87.4---89.7
NCd <0.001
Excessweight 522(40.8) 38.1---43.5 319(21.0) 19---23.2 841(30.1) 28.4---31.8 Normalweight 757(59.2) 56.4---61.9 1.197(79.0) 76.8---81 1.954(69.9) 68.2---71.6
BMI,bodymassindex;95%CI,confidenceinterval;WC,waistcircumference;WHtR,waist/heightratio;NC,neckcircumference.
a ≥P
85forexcessweight. b ≥P
90forobesity. c ≥0.5forobesity.
d NC>35.5cmformale,NC>32cmforfemalegender.
interval(95%CI).Pearson’schi-squaretestwasusedinthe comparison of proportions. As the food consumption fre-quency scores showed ordinal scale measurements, they weredescribedasmedianandtheirrespectiveinterquartile range(IQR). Theassociationofconsumptionwith explana-tory variableswasperformed usingMann---WhitneyUtest. Significancelevelforthestatisticaltestswassetat5.0%.
Results
Of the 2994 eligible students, 128 adolescents were excludedforrefusingtoparticipateorduetotechnical dif-ficultiesincollectinganthropometricdata.
The final sample consisted of 2866 students, of which 54.2% werefemales, withamedian age of14 years(IQR: 12---16). The prevalenceof overweight was11.0%(95% CI: 9.8---12.2), whereas obesity was 6.8% (95% CI: 5.9---7.8), accordingtoBMI.AccordingtotheWCandWHtRcriteria, 4.2%(95%CI:3.5---5) and11.4%(95%CI:10.2---12.5)of the adolescentshadabdominalobesity,respectively.Asforthe NC,theprevalenceofoverweightwasmoreimportant,with 30.1% (95% CI: 28.4---31.8) of the adolescents being diag-nosedwithexcessweight(Table1).
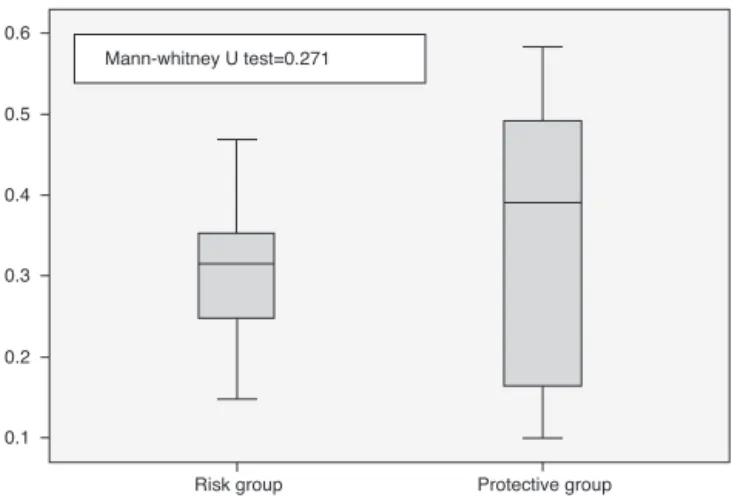
Regarding thefoodconsumptionscores, food
consump-tionmediansfortheriskandprotectivegroupsweresimilar
(p=0.271)(Fig.1).However,theanalysisoftheinterquartile
coefficientofvariation(ICV)showedagreaterdispersionin
thegroupofprotectivefoods(ICV=51.1%)comparedtorisk
foodgroup(ICV=30.5%).
The dataconcerningthe associationbetween scoresof
foodconsumptionandsocioeconomic,anthropometricand
lifestylevariablesareshowninTables2and3.Asignificant
association was observed between risk food consumption
andmaternalschooling,ashighermediansintheriskgroup
wereobservedamongteenagerswhosemothershadhigher
schooling(>9 years)(p<0.001). The distributionof scores
withotherexplanatoryvariableswassimilar.
Discussion
Theproblemofoverweightandobesityinadolescencehas been demonstrated by several studies.1---3,19 Even though
thisdisorderhasamultifactorialorigin,inadequateeating
habitsconstituteoneofthemodifiable factorsmostoften
associatedwiththedevelopmentofexcessweight.1,4,19The
Mann-whitney U test=0.271
0.6
0.5
0.4
0.3
0.2
0.1
Risk group Protective group
Table2 Scores ofthe groups ofrisk andprotective foodsaccording tosocioeconomic variablesand thelife style ofthe adolescents.VitóriadeSantoAntão,Pernambuco,Brasil2012.
Variables Groupsoffoods
Riskgroup Protectivegroup
Median IQR Median IQR
Gender
Male 0.2553 0.1567---0.3338 0.3980 0.1537---0.5073
Female 0.2559 0.1957---0.3236 0.3854 0.1659---0.4870
p-valuea 0.776 0.729
Agerange
10---14years 0.2712 0.1939---0.3393 0.3854 0.1715---0.4959
15---19years 0.2434 0.1476---0.3123 0.3956 0.1448---0.4969
p-valuea 0.327 0.954
Areaofresidence
Urbanarea 0.2642 0.1835---0.3343 0.3967 0.1599---0.5087
Ruralarea 0.2447 0.1389---0.3020 0.3640 0.1546---0.4566
p-valuea 0.327 0.564
Socioeconomicclass
A/B 0.2760 0.1979---0.3426 0.4016 0.1656---0.5599
C 0.2707 0.1851---0.3332 0.3956 0.1620---0.4914
D/E 0.2371 0.1467---0.3145 0.3803 0.1545---0.4748
p-valuea 0.613 0.813
Maternalschooling
≤9years 0.2556 0.1662---0.3235 0.3820 0.1589---0.4792
>9years 0.2717 0.1885---0.3349 0.4021 0.1652---0.5247
p-valuea <0.001 0.683
Levelofphysicalactivity
Active 0.2649 0.1747---0.3677 0.3743 0.1702---0.5757
Sedentary 0.2613 0.1754---0.3225 0.3938 0.1602---0.4848
p-valuea 0.635 0.773
Smokingstatus
Smoker 0.2520 0.1996---0.2989 0.3534 0.1664---0.4952
Non-smoker 0.2621 0.1742---0.3279 0.3907 0.1605---0.4970
p-valuea 0.849 0.954
Alcoholconsumption
Yes 0.2578 0.2039---0.3242 0.3972 0.1493---0.5396
No 0.2615 0.1740---0.3277 0.3909 0.1607---0.4954
p-valuea 0.874 0.954
IQR,interquartilerange.
aMann---WhitneyUtest.
excessiveconsumptionoffastfoodandprocessedfoods(rich in calories, refined carbohydrates, saturated fat, choles-terol, and sodium, which also have low dietaryfiber and micronutrients)isassociatedwiththedisorder.
Thescoremethodfortheassessmentofdietaryintake, initiallyproposedbyFornésetal.,18constitutesarelatively
simple measure that reflects a qualitative aspect of the
diet.Accordingtothemethod,higherscoresmeanhigher
consumption ofcertain foodgroups, allowing the
statisti-calanalysisofanassociationbetweenconsumptionpatterns
andexplanatoryvariables.Inthepresentstudy,althoughno
statisticallysignificant differencewas found between the
intakeofprotectiveandriskfoodsforthedevelopmentof
CVD, the data may suggest, based onthe analysis of the
ICV, that there was probably a greater intake of
protec-tive foods, a fact that differs from the literature studies
showingincreasing consumptionof an atherogenicdiet by
the adolescent population.1,19,20 However, further studies
areneededregardingthisspecificaspectoffood
consump-tioninordertoassessthepresenceorabsenceofsuchan
event.
InastudybyLevyetal.,19withdatafromtheINational
Survey on Schoolchildren’s Health (PeNSE), the high
con-sumptionofanunhealthydietwasidentified(rangingfrom
18.0%to50.9%)inadolescentsattendingpublicandprivate
schools in 26 Brazilian state capitalsand theFederal
Dis-trict,withemphasisontheconsumptionofsweetsandsoft
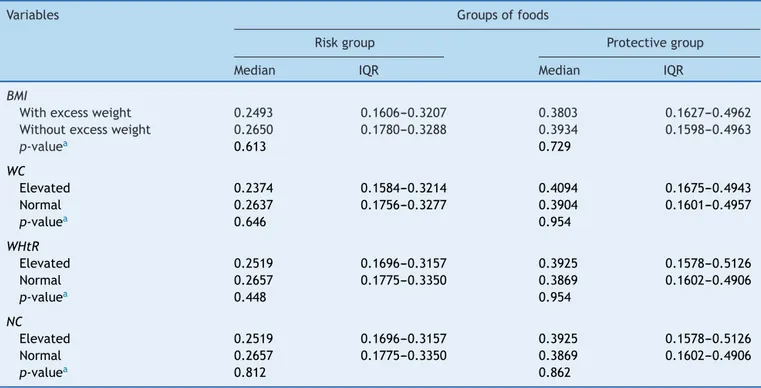
Table3 Scoresofriskandprotectivefoodgroupsaccordingtoanthropometricvariablesofadolescentstudents.Vitóriade SantoAntão,Pernambuco,Brasil2012.
Variables Groupsoffoods
Riskgroup Protectivegroup
Median IQR Median IQR
BMI
Withexcessweight 0.2493 0.1606---0.3207 0.3803 0.1627---0.4962
Withoutexcessweight 0.2650 0.1780---0.3288 0.3934 0.1598---0.4963
p-valuea 0.613 0.729
WC
Elevated 0.2374 0.1584---0.3214 0.4094 0.1675---0.4943
Normal 0.2637 0.1756---0.3277 0.3904 0.1601---0.4957
p-valuea 0.646 0.954
WHtR
Elevated 0.2519 0.1696---0.3157 0.3925 0.1578---0.5126
Normal 0.2657 0.1775---0.3350 0.3869 0.1602---0.4906
p-valuea 0.448 0.954
NC
Elevated 0.2519 0.1696---0.3157 0.3925 0.1578---0.5126
Normal 0.2657 0.1775---0.3350 0.3869 0.1602---0.4906
p-valuea 0.812 0.862
IQR,interquartilerange;BMI,bodymassindex;WC,waistcircumference;WHtR,waist/heightratio;NC,neckcircumference.
a Mann---WhitneyUtest.
Zaninietal.,20evaluatingtheconsumptionofsoftdrinks,
sweetsandfriedfoodsinadolescentsfromnortheastBrazil,
disclosedresultsthatareofconcernregardingtheweekly
frequencyofconsumptionoftheseitems:90.9%,95.4%and
89.6%oftheadolescentsanalyzedinthestudy,respectively,
consumedtheabovementionedfoodsatleastonceaweek.
Itis noteworthythat,accordingtothe‘‘Tenstepstoa
healthydiet’’proposedbytheMinistryofHealthin2006,21
onlyoneportionofsugarsandfatsshouldbeconsumedaday.
Incross-sectionalstudycarriedoutbyNeutzlingetal.22with
adolescentsfromPelotas,usingthesesteps21 ahigh
preva-lenceofindividualswithpoor dietaryhabitswasobserved
whenconstructingthevariablestocharacterizetheeating
behavior,particularlyamongfemales,withtheconsumption
offruitsandvegetablesbeingthemostinadequatein this
sample(5.3%).
Considering thecondition ofa higherintakeof
protec-tive foods by adolescents included in the present study,
weshouldmentionthepossibilityofreversecausality.The
highfrequencyofoverweightandobesitymayinterferewith
the consumption of items considered as ‘‘risk foods’’ for
the developmentof CVD,due tothe occurrenceof
possi-blemodificationstrategiesintheeatingbehaviorofthese
adolescents.Anothersuggestedexplanationisthe
underre-portingofconsumptionofriskfoodsbytheindividualswith
excessweight.
Regardingthehigherscorefound fortherisk food
con-sumption in the group of adolescents whose mothers had
higherschooling,thiseventmayhaveoccurredduetothe
factthat,incountriesundergoingindustrializationprocess,
suchasBrazil,overweightandobesityoccurmorefrequently
in individuals of higher socioeconomic levels and higher
levelsof education,23 demonstrating food consumption at
greaterquantity,butnotofbetterquality.
Ina studyby Nunesetal.24 withadolescentsfrom
dif-ferent socioeconomic classes, it was demonstrated that
socioeconomic status more significantly influences the
developmentofoverweightandobesitythanother
sociode-mographicfactors.However,inastudycarriedoutbyTerres
etal.25 usingthesamecutoffsformaternaleducationused
inthissample,highermaternalschoolingwasaprotective
factoragainsttheconsumptionofapoordietandthe
con-sequentdevelopmentofexcessweight.Ourresultsallowus
toconcludethatthereisaneedfornutritioneducation,not
onlyforthepoorestfamilies,butamoreglobalactionthat
willhaveanimpactontheentireat-riskpopulation.
Theuseofscoresinthisstudyallowedasimpleand
dif-ferentiatedanalysisoftheeatingpatternsof adolescents,
withtheadvantageofallowingstatisticalanalysistoassess
thedietquality,ratherthanexplanatoryvariablesrelated
toeatinghabits.
Regardingthehighprevalenceofobesityandoverweight
accordingtoBMI,thepresent studyshowedthatthis
find-ingis a frequent event in the literature andranges from
around16.4%to25.1%forbothgenders.1,20,22,24,26
Addition-ally,using the NCas parameter toassess overweight and
obesity detected a higher prevalence of individuals with
thisnutritionaldiagnosis.RecentstudiesemphasizetheNC
asa reliable methodfor the assessment of overweight in
adolescents,demonstratingevengreaterfrequenciesofthe
disorderwhencomparedtoBMI,26,27afactthatcorroborates
Some limitations should be taken into account when
interpreting theresults. This is across-sectional study,in
whichcauseandeffectassociationscannotbedetermined.
Thedietaryintakeassessmentusingdifferentmethodsinthe
analyzedstudieswasalsoalimitingfactorregardingthe
dis-cussionandcomparisonofresults.Theassessmentofsexual
maturationstagewasafactorwithahighdegreeofrejection
inschoolsduringthepilotstudy,mainlyinprivateschools,
whichmadeitimpossibletoobtainsuchdata.Additionally,
the IPAQ, in its original publication,16 was well rated for
adolescentsolderthan14years,butshowedlimitedusefor
adolescentsyoungerthan14years.
Despite these limitations, the present study assessed,
using a practical approach, the eating habits of
adoles-centsusingthescoremodel,atoolthatadditionallyallowed
an analysisof environmental factors associatedwithsuch
eating habits, demonstrating an association between the
intakeofhighcardiovascularriskfoodswithhighermaternal
schooling.Similarly,inastudybyMoraesandHawk,28itwas
observedthateatinghabitsaremediatedbyfamilycontexts
inadolescents,regardlessofgender.Inaddition,ourresults
wereimportantinrecognizingthenutritionalstatusof
ado-lescentslivinginthemunicipalityofVitóriadeSantoAntão,
beingimportantfortheimplementationofstrategiesaimed
attheprevention,treatmentandcontrolofchronicdiseases
inthisagegroup.
In conclusion, the present study showeda high
preva-lenceofoverweightandobesityintheassessedadolescent
schoolchildren.Thegreaterconsumption ofriskfoods was
associatedwithhighermaternalschooling,whichindicates
theneedfornutritioneducationinterventionsinthefamily
context, regardless of socioeconomic---demographic status
ofindividuals.Suchinterventionsshouldbecarriedoutbya
multidisciplinaryteam,includinghealthandeducation
pro-fessionals,aswell asthe media, inorderto promotethe
healthofadolescentswitheducationalstrategiesand
stim-ulateadequatefoodconsumption,thushelpingtoprevent
chronicdiseasesinadultlife.Theimportanceofintroducing
otheranthropometricmeasurementsinadditiontoweight
andheightinpatient/individualmanagement,suchasWC,
WHtRandNCinBrazilisalsonoteworthy,whichwere
impor-tant for the diagnosis of abdominal obesity and excess
weight.
Funding
National Council for Scientific and Technological Develop-ment (ConselhoNacional de Desenvolvimento Científico e Tecnológico --- CNPq), responsible for the funding of bio-chemicaltests.
Conflicts
of
interest
Theauthordeclaresnoconflictsofinterest.
Acknowledgements
ToConselhoNacionaldeDesenvolvimentoCientíficoe Tec-nológico(CNPq)forfundingthestudy.
References
1.PinhoL,FlávioEF,SantosSH,BotelhoAC,CaldeiraAP.Excess weightandfoodconsumptionofadolescentsinpublicschools in northern Minas Gerais state, Brazil. Cienc Saude Colet. 2014;19:67---74.
2.Brasil--- InstitutoBrasileirodeGeografiaeEstatística.Pesquisa de orc¸amentos familiares 1978---1988. Rio de Janeiro: IBGE; 1991.
3.Brasil---InstitutoBrasileirodeGeografiaeEstatística.Pesquisa de orc¸amentos familiares 2008---2009. Rio de Janeiro: IBGE; 2011.
4.AraujoMC,Veiga GV,SichieriR,Pereira RA.Developmentof a semiquantitative food frequency questionnaire for adoles-centsfromtheRiodeJaneirometropolitanarea.BrazRevNutr. 2010;23:179---89.
5.SekiM,MatsuoT,CarrilhoAJ.Prevalenceofmetabolicsyndrome andassociatedriskfactorsinBrazilianschoolchildren.Public HealthNutr.2009;12:947---52.
6.Brasil---InstitutoBrasileirodeGeografiaeEstatística.Pesquisa deOrc¸amentoFamiliar2002---2003:análisedadisponibilidade domiciliardealimentosedoestadonutricionalnoBrasil.Rio deJaneiro:IBGE;2004.
7.Associac¸ão Brasileira de Empresas de Pesquisa [homepage on the Internet]. Dados com base no Levantamento Sócio Econômico2010---IBOPE[accessed14.06.13].Availablefrom:
http://www.abep.org/new/
8.LohmanTG,RocheAF,MartorellR.Anthropometric standard-izationreferencemanual.Champaign:HumanKineticsBooks; 1991.
9.CentersforDiseaseControlandPrevention[homepageonthe Internet]. United States Growth charts [accessed 01.10.14]. Availablefrom:http://www.cdc.gov/growthcharts/
10.Preis SR, Massaro JM, Hoffmann U, D’Agostino RB, Levy D, Robins SJ, et al. Neck circumference as a novel measure ofcardiometabolic risk: theFramingham heartstudy. JClin EndocrinolMetab.2010;95:3701---10.
11.NafiuOO,Burke C,LeeJ, Voespel-LewisT,MalviyaS, Trem-per KK. Neck circumference as a screening measure for identifying children with high body mass index. Pediatrics. 2010;126:e306---10.
12.Hingorjo MR, Qureshi MA, Mehdi A. Neck circumference as a useful marker of obesity: a comparison with body mass index and waist circumference. J Pak Med Assoc. 2012;62: 36---40.
13.International Diabetes Federation [homepage on the Inter-net]. Diabetes Voice [accessed 01.10.14]. Available from: http://www.idf.org/
14.McCarthy HD, Ashwell M. A study of central fatness using waist-to-heightratiosinUKchildrenandadolescentsovertwo decadessupportsthesimplemessage---‘keepyourwaist cir-cumferencetolessthanhalfyourheight’. IntJObes(Lond). 2006;30:988---92.
15.Li C, Ford ES, Mokdad AH, Cook S. Recent trends in waist circumferenceand waist-height ratioamong USchildrenand adolescents.Pediatrics.2006;118:e1390---8.
16.GuedesDP,LopesCC,GuedesJE.Reproducibilityandvalidity ofinternationalphysicalactivityquestionnaireinadolescents. RevBrasMedEsporte.2005;11:151---8.
17.Carlini-CotrimB,Gazal-CarvalhoC,GouveiaN.Healthbehavior amongstudentsofpublicandprivateschoolsinS.Paulo,Brazil. RevSaudePublica.2000;34:636---45.
18.FornesNS,MartinsIS,VelasquezMG,LatorreMRDO.Food con-sumptionscoresandserumlipidslevelsinthepopulationofSão Paulo,Brazil.RevSaudePublica.2002;36:12---8.
adolescents:National AdolescentSchool-based healthsurvey (PeNSE),2009.CiencSaudeColet.2010;15Suppl.2:3085---97. 20.ZaniniRV,MunizLC,SchneiderBC,TassitanoRM,FeitosaWM,
González-ChicaDA.Daily consumptionof softdrinks, sweets andfriedfoodsamongadolescentsintheNortheastofBrazil. CiencSaudeColet.2013;18:3739---50.
21.Brasil ---Ministério da Saúde.Secretariade Atenc¸ãoà Saúde --- departamento de atenc¸ão básica --- coordenac¸ão geral da política de alimentac¸ão e nutric¸ão. Guia alimentar para a populac¸ão brasileira: promovendo a alimentac¸ão saudável. Brasília:MinistériodaSaúde;2006.
22.NeutzlingMB,Assunc¸ãoMC,MalconMC,HallalPC,MenezesAM. Foodhabitsof adolescentstudents from Pelotas,Brazil.Rev Nutr.2010;23:379---88.
23.WangY,MonteiroC,PopkinBM.Trendsofobesityand under-weightinolderchildrenandadolescentsintheUnitedStates, Brazil,ChinaandRussia.AmJClinNutr.2002;75:971---7.
24.NunesMM,FigueiroaJN,AlvesJG.Overweight,physical activ-ity and foodshabits in adolescentsfrom differenteconomic levels, Campina Grande (PB). RevAssoc Med Bras. 2007;53: 130---4.
25.Terres NG, Pinheiro RT, Horta BL, Pinheiros KA, Horta LL. Prevalenceoffactorsassociatedtooverweightandobesityin adolescents.RevSaudePublica.2006;40:627---33.
26.GuoX,LiY,SunG,YangY,ZhengL,ZhangX,etal. Prehyperten-sioninchildrenandadolescents:associationwithbodyweight andneckcircumference.IntMedJ.2012;51:23---7.
27.Hatipoglu N, Mazicioglu MM, Kurtoglu S, Kendirci M. Neck circumference: an additional tool of screening over-weight and obesity in childhood. Eur J Pediatr. 2010;169: 733---9.