Universidade do Minho
Escola de Ciências
Ana Henrique Martins Araújo
outubro de 2016
Mono and bimetallic catalysts for
green chemistry applications
Ana Henrique Martins Araújo
Mono and bime
tallic cat
al
ys
ts for green chemis
tr
y applications
Escola de Ciências
Ana Henrique Martins Araújo
Mono and bimetallic catalysts for
green chemistry applications
Trabalho realizado sob orientação da
Professora Doutora Isabel Correia Neves
e da
Professora Doutora Elisabetta Rombi
Dissertação de Mestrado
Acknowledgments
The project presented by this thesis couldn’t be done without the support and the friendship of very special people and institutions. Here I want to say thank you to the people/institutions that make possible the achievement of this work, with special attention to:
My guiders Professor Doctor Isabel Correia Neves, Professor Doctor António Maurício Fonseca and Professor Doctor Elisabetta Rombi, for the opportunity, availability, knowledge shared and sympathy.
All the Industrial Lab workers from Cagliari University, in special Daniela, Luciano and Franca for the fellowship, support and friendship. They all make easier the placement exchange period.
Chemical Department of Minho University for the opportunity of realise this master degree on Chemical Characterisation and analysis techniques.
All the Catalysis Lab collaborators, in special to Professor Doctor Fernando Pereira, Doctor Salomé Soares and Doctor Alexandra Gonçalves that help me on some characterization and catalytic processes, very important to this work.
All family, in special my parents, Henrique and Carmo and my brother João to never let me give up and make this journey easier.
All my friends, in special my classmate Elsa for the constant encouragement.
And last but not least, my boyfriend Nuno for the patient and unconditional love in this very stressing period.
Abstract
The oxidation reactions play a very important role in the field of Green Chemistry for a sustainable environment. In general, these reactions occur in gas or liquid phase using heterogeneous catalysts. In this context, the work presented in this thesis had the main objective the development of the heterogeneous catalysts for green chemistry applications.
The heterogeneous catalysts with copper and palladium, prepared by ion exchange method using Y (FAU) and ZSM5 (MFI) zeolite structures, were applied to removing selectively some pollutants from gas or liquid feed solutions. For both zeolite structures, two mono and two bimetallic catalysts were prepared. These heterogeneous catalysts were characterized by different analytical techniques such as: scanning electron microscopy coupled with EDX (SEM-EDX), microcalorimetry, nitrogen adsorption isotherms (BET areas), pHPCZ determination and reduced programmed temperature (TPR). The characterization results of the catalysts showed that the inclusion of metal ions by ion exchange method did not modify the integrity of the zeolite structures.
On gas phase, the reactions studied were CO oxidation, PROX and H2 oxidations. For these reactions, only the heterogeneous catalysts prepared with HY zeolite were studied. The simulation of water reserve pollutants removal was done using ozonisation method. Here, the heterogeneous catalysts prepared with HZSM5 zeolite were evaluated in the salicylic acid (SA) ozonisation. As oxalic acid is an intermediary of the SA degradation, also the oxalic acid ozonisation was studied. The catalytic behaviour was followed by gas chromatograph (CG), to gas phase reactions, and HPLC, to liquid phase reactions. The catalytic results show that the pair CuPd was the best combination for the reactions studied. In gas phase, CuPd-Y show the best catalytic results. In liquid phase, CuPd-ZSM5 was the best catalyst for SA degradation and, however for oxalic acid degradation was PdCu-ZSM5.
Resumo
As reações de oxidação desempenham um papel muito importante na química verde para obter um ambiente sustentável. Geralmente, estas reações ocorrem no estado gasoso ou no estado líquido usando catalisadores heterogéneos. Neste contexto, o trabalho apresentado nesta dissertação tem como principal objetivo o desenvolvimento de catalisadores heterogéneos para aplicações em química verde. Os catalisadores heterogéneos com cobre e paládio preparados pelo método de permuta iónica, usando os zeólitos Y (FAU) e ZSM5 (MFI), foram aplicados para remoção seletiva de poluentes em soluções gasosas e líquidas. Estes catalisadores heterogéneos foram caracterizados por diferentes técnicas analíticas tais como: microscopia eletrónica de varrimento acoplada a EDX (SEM/EDX), microcalorimetria, isotérmicas de adsorção de nitrogénio (áreas BET), determinação do pHPCZ e redução a temperatura programada (TPR). Os resultados de caracterização dos catalisadores mostraram que a inclusão dos iões metálicos pelo método de permuta iónica não modificou a integridade da estrutura dos zeólitos.
Na fase gasosa, as reações estudadas foram oxidação de CO, PROX e oxidação de H2. Para estas reações só os catalisadores heterogéneos preparados com o zeólito Y é que foram estudados. A simulação de remoção de poluentes de águas foi efetuada usando a ozonização. Neste caso, os catalisadores preparados com o zeólito ZSM5 foram avaliados na ozonização do ácido salicílico (SA). Como o ácido oxálico é um intermediário na degradação do SA, também foi alvo de estudo. O comportamento catalítico foi seguido por cromatografia gás (GC), para as reações em fase gasosa, e por cromatografia líquida (HPLC), para as reações em fase líquida. Os resultados catalíticos mostraram que o par CuPd foi a melhor combinação para as reações estudadas. Em fase gasosa, CuPd-Y apresentou os melhores resultados catalíticos. Em fase líquida, o CuPd-ZSM5 foi o melhor catalisador para a degradação do SA, no entanto no caso do ácido oxálico o resultado para o PdCu-ZSM5 foi superior.
Index
Acknowledgments ... I Abstract ... III Resumo ... V Index ... VII Figure Index ... IX Table Index ... XI Chapter 1 Introduction ... 3 1.1. State of art ... 31.1.1. Carbon monoxide oxidation reactions in gas phase ... 3
1.1.2. Ozonisation reaction in phase liquid ... 5
1.2. Zeolites ... 7
1.2.1. Zeolite Y ... 9
1.2.2. Zeolite ZSM5 ... 10
1.3. Objectives ... 10
1.4. Thesis structure ... 11
Chapter 2 Catalysts Preparation ... 15
Chapter 3: Catalysts Characterization ... 21
3.1 pHPCZ determination ... 21
3.2 Scanning electronic microscopy (SEM) ... 22
3.2.1 SEM Analysis ... 23
3.3 Microcalorimetry... 25
3.3.1 Microcalorimetric Analysis ... 26
3.4 Temperature programmed reduction (TPR) ... 28
3.5.1 BET Analysis ... 31
Chapter 4: Catalytic activity ... 35
4.1 CO Oxidation – Gas phase reaction ... 35
4.1.1 CO Oxidation ... 36
4.1.1 Preferential CO oxidation ... 38
4.1.2 H2 oxidation ... 40
4.2 Salicylic Acid (SA) Ozonisation – Liquid phase reaction ... 41
Chapter 5: Conclusions and future work ... 47
Figure Index
Figure 1: Ozonisation resonance structures15. ... 6
Figure 2: Reaction mechanism of ozonation catalyzed by carbon materials containing ceria on the surface20. ... 7
Figure 3:Faujasite structure20,32. ... 9
Figure 4: Representation of the MFI framework type (adapted)34. ... 10
Figure 5: Scheme of catalysts preparation method. ... 17
Figure 6:SEM micrographs with the same magnifications of: HY (a) and HZSM5 (b). ... 23
Figure 7: SEM micrographs with the same magnifications of: HZSM5 (a) and CuPd-ZSM5 (b). ... 24
Figure 8: SEM micrographs with the different magnifications of: HY (a) and PdCu-HY (b). ... 24
Figure 9: Microcalorimetric results for H-Y, Pd-HY, Cu-HY, PdCu-HY and CuPd-HY. It is presented the Qdiff along the coverage of catalyst surface. ... 27
Figure 10: TPR results presented as TCD signal in function of the Temperature. It was tested about 100 mg of each catalyst: Cu-ZSM5, Pd-ZSM5, CuPd-ZSM5 and PdCu-ZSM5... 29
Figure 11: CO conversion program temperature. ... 37
Figure 12: CO oxidation results for the heterogeneous catalysts prepared. ... 38
Figure 13:Program temperature for PROX. ... 39
Figure 14:O2 conversion in function of Temperature in PROX reaction. The reaction occurred in about 53.81 mL/min total flow, with a GHSV of 53 810 mL/hg. ... 39
Figure 15 Selectivity of O2 to form, the preferentially CO2 for CuPd-HY, represented as function of temperature increasing. ... 40
Figure 16: H2 oxidation program temperature. ... 40
Figure 17: O2 conversion in function of Temperature in H2 oxidation. The reaction occurred in about 54.42 mL/min total flow, with a GHSV of 54 420 mL/hg. ... 41
Figure 18: Salicylic acid degradation to 60 min of reaction. ... 42
Figure 19: Salicylic mineralization to 300 min of reaction. ... 43
Figure 20: Evolution of oxalic acid along the time reaction during SA degradation. ... 43
Table Index
Table 1:Characteristics and supplier specifications of the zeolite structures used in this work. 15
Table 2: Characteristics and supplier specifications of the reactants used in this work. ... 15
Table 3: Solutions prepared used in ion exchange method. ... 16
Table 4: Mono and bimetallic catalysts prepared. ... 17
Table 5: pHPZC values of the parent zeolites. ... 21
Table 6: Chemical analysis obtained by SEM-EDX and ICP-OE analyses for the samples prepared. ... 24
Table 7: Percentage of weak, medium and strong acid sites of HY, ZSM5 and the heterogeneous catalysts prepared. ... 27
Chapter I
Introduction
“Although the good things
that I search are far, they
exist”
Confúncio
Chapter 1: Introduction
The first chapter present general considerations about the oxidation reactions studied in this work. An account of the literature results of the oxidations reactions studied, including mechanisms and catalysts is presented. The description of the zeolite structures in the reactions studied is highlighted. Finally, the main objectives of the work and the thesis outline are presented.
1.1. State of art
The oxidation reactions play a very important role in the field of Green Chemistry for a sustainable environment. In general, these reactions occur in gas or liquid phase using heterogeneous catalysts. For the different oxidation reactions is important to have stable catalysts which can be reusable for many cycles1,2. These catalysts need a stable support for the active species which prevents their leaching. Zeolites offer different structures which serve as support for these active species for performing oxidation reactions in presence of the oxidants agents. The unique zeolite’s physicochemical properties confer stability and selectivity to the process creating more affinity with a specific analyte3. To improve the catalytic activity, noble metals are being added at the supports surface. Gold (Au) particles are the most used but increases the price of the catalysts and reduce their lifetime. This problem is an impasse for industrial applications. Recently, palladium (Pd) was revealed a substitute with similar performance, with lower expenses and longer lifetime4–6. In the same way, copper (Cu) has been related as a good catalyst to preferential carbon monoxide (CO) oxidation (PROX)6–8. The introduction of Cu to replace or minimize the amount of noble metals enhance cheaper heterogeneous catalysts with high stability and catalytic activity.
1.1.1. Carbon monoxide oxidation reactions in gas phase
With the increasing of population, the demand for energy has been growing exponentially. Beyond the high pollution levels, non-renewable sources are not meeting the needs. One of the fields in which this problem is more evident is in the internal combustion motors. Hydrogen is a very interesting substitute for the
traditional fuels and its application on polyelectrolyte membrane fuel cells (PEMFC) is the most known example. The high important of PEMFC is due to their high power density ability, fast start-up and high efficiency4,9,10. Despite of all advantages, PEMFC performance were very affected by the presence of CO, even in low concentration. To solve this problem, it was necessary to develop processes for purify H2 fuel gases from CO pollutant. Several techniques were used to remove CO from hydrogen sources like membrane purification or catalytic processes. The catalytic reactions can involve CO methanation or, most common, CO oxidation. In this case, it is important to oxidize CO at lower temperatures than hydrogen7,10.
Low temperature CO oxidation (LTCOO) is a catalytic reaction with great potential to be applied in many industrial fields. The environmental control methods are being a new target and they are very attractable5. CO elimination in carbon dioxide (CO2) lasers, hydrogen purification in proton exchange fuel cells (PEFC) and gas pollutant exhaustion in vehicles, are the main application examples6. Between all heterogeneous catalytic reactions, LTCCO has special meaning. The simple mechanism and the easy to understand process are the focal reasons that promoted this reaction3. Usually, the catalysts used are supported in metal oxides as Co3O4 or Fe2O3 but they present serious problems of toxicity. Because of that, new materials as carbons or zeolites has been tested and showed a very good performance5,6. In this case, the oxidation of CO produces CO2 (Reaction
1).
(1) To evaluate the catalysts performance Equation 1 is required7,8.
Eq. 1
where [CO2]out is the molar concentration of CO2 determined by the percentage of this gas measured in the chromatograph and [CO]in is the molar concentration of carbon monoxide present in the feed gas.
When CO catalytic oxidation is applied to H2 mixtures, a new reaction is intended, the preferential CO oxidation (PROX). Hence, with the increasing of compounds present in the reaction environment, there are other possibilities and ways to react. Thus, other products can be formed and they are expressed by
reaction 2, correspondent to hydrogen oxidation, reaction 3 that shows the water
gas shift reaction (WGS) and Reaction 4 corresponds to CO methanation7,9. (1) (2) (3) ) (4)
Considering the application on PEMFC, the three last reactions are not desire. Attending that the intention is to remove the CO from H2 feed gas. It is important to reinforce that the focus is to remove carbon monoxide at lower temperatures than hydrogen. The working temperature of PEMFC is between 80 ˚C and 100 ˚C and catalysts need to be active at these low temperatures4,7.
With the introduction of H2 in the mixing feed gas solutions, the CO and O2 conversion are expressed by Equations 2 and 3. To verify the activity of the catalysts, both data treatment can be used, but if undesired reactions are present only with O2 conversion is possible to detect them11.
Eq. 2 Eq. 3
As O2 can be consumed for CO or H2 oxidation is important to introduce a new concept, selectivity. To verify the performance of the catalyst to a specific reaction, it is important to check if it is selective form CO2. Equation 4 allows the determination of the selectivity of the catalysts to produce CO2 from O211.
Eq. 4
1.1.2. Ozonisation reaction in phase liquid
Water purification is another problem that need to be taken in account in green chemistry field. Water is an essential natural recourse that is daily applied in several activities (human consumption, irrigation, electric power production,
etc.)12. In these sense, for a sustainable environment, it is important to ensure that the water sources have good properties to be consumed.
In the last years, the consumption of pharmaceuticals has been increasing worldwide. Pharmaceuticals are being introduced into the environment at variable degrees and on a continuously basis, mainly through wastewater and sewage treatment plants, as a consequence of the inadequacy of the treatment processes applied in these facilities13.
There are many processes to remove pollutants from water sources but catalytic heterogeneous reactions have a special attention. The catalytic ozonisation is an important oxidation reaction emerged as a powerful technology for the treatment of pollutants in water14. Ozone molecule is a good oxidation agent due to its distribution of electronic density (Figure 1)15.
Figure 1: Ozonisation resonance structures15.
There are several examples in catalytic ozonisation using carbons, oxides and zeolites as supports. Also, the modification with noble metals, platinum or palladium, showed the better results for the oxidation reaction15. Some studies shown that carbon materials, like activated carbon and multi-walled carbon nanotubes are efficient ozonisation catalysts for removing pharmaceutical pollutants, such as diclofenac,16 nitroimidazole antibiotics,17 sulfamethoxazole18 and bezafibrate19.
The ozonisation of organic compounds involves a large number of complex reactions and many mechanistic approaches have been presented in the literature. The consensual mechanism of catalytic ozonisation reaction involves the attack of OH radical which is formed from molecular ozone molecules and surface oxygenated radical species, in presence of the heterogeneous catalysts. These heterogeneous catalysts with metal species enhances the oxidation of the pollutants from aqueous effluents, as show in the works of A.G. Gonçalves et al. with ceria dispersed on carbon materials20. The mechanism is present on Figure 2.
Figure 2: Reaction mechanism of ozonation catalyzed by carbon materials containing ceria on the surface20.
In this work, a specific emergent pharmaceutical pollutant was studied, salicylic acid (SA), which is a beta hydroxy acid, chemically classified as monohydroxybenzoic acid, commonly used to treat comedonal or non-inflammed acne. SA is also the major metabolite and active component of aspirin (acetylsalicylic acid)21. Aspirin is recognized by its analgesic, anti-inflammatory and antipyretic effects22. This drug was selected because it is one of the most widely used for acne treatment and is present in water supplies at high levels.
In the oxidation reaction of SA by ozonisation, the presence of the intermediates with long time-life, as catechol and oxalic acid can interfere in the mineralisation performance16.
In order to select a correct catalyst to be applied in a specific reaction there are many constraints that need to be taken in account. Preparation methods, nature of supports and experimental conditions are crucial and need to be very well controlled3,11. In respect to the supports, there are many characteristics that could influence the catalytic activity, like surface area, pore size and volume14-16. For the metal species, the oxidation state, amount and dispersion on the support are the main characteristics to give attention3,4. The characterization is important in order to select the best heterogeneous catalysts. In this work a whole of characterization techniques were applied to achieve the characterization of the metal catalysts prepared with zeolites.
1.2. Zeolites
Zeolites are immerging materials with good properties to be good supports for heterogeneous catalysts. These materials with higher specific areas have a porous
structure, characterized by channels and cavities in the molecular scale. The unique properties of this material, like high adsorption ability, ion exchange capacity, intrinsic acidity, high stability and selectivity, give them the popularity in the industrial field. Also, they are non-toxic to humans, environmental friendly and lead low prices23-25.
The history of zeolites begins in 1756 when a Swedish mineralogist, Axel Fredrick Crønsted, described the particular foam formed when they are heated the mineral in a blow-pipe flame. This particular behaviour gives them the name by join the Greek words of Zeo, boiling, and Lithos, rock16,17. Beyond the natural zeolites, as analcime or modernite, many studies have been done in such a way to arrive a 100 % synthetic materials. It is important to develop synthetic zeolites because it is possible to obtain different regular structures by several synthesis process18,19. This new mineral class has aluminosilicates in their constitution. These atoms, Si4+ and Al3+, are arranged as tetrahedral with elemental units, SiO4 and AlO4, in the framework20–23. The sequences of this unit cells give to zeolites the characterization of the pore size and surface area17,23.The presence of Al3+ ions in the framework balances the charges of oxygen to a negative value. This particularity allows exchanging metal ions in water solution. The introduction of metals gives to zeolites the desire selectivity to a specific reaction and could change the acidity20,24,25.
The general empirical formula of zeolites crystal framework is represented by
Equation 5.
Eq. 5
where y varies from 2 to ∞, m represents the cation valence, A is the cation and z corresponds to the number of water molecules confined in the voids of the zeolites per structural unit. The sum of x and y is the tetrahedral number per unit crystallographic cell. The ratio is the silicon/aluminium proportion, one of the most important parameter of characterization, and can oscillate from 1 to ∞. Si/Al ratio can give information about the acidity of the catalysts. Usually, the strongest acid sites are in the zeolites with higher Si/Al ratio25–27.
At the beginning, zeolites were applied only as molecular sieves to purify fluid solutions, special in gas phase. The ability to have more affinity for a target analyte
make them great materials for that application. Also, the zeolites properties improve the application of them in other fields, like detergent industries, adsorption processes and catalysis. Catalytic reactions could exist in many industries like petrochemical (cracking) or energy (Fuel cells)28–30. Catalysts with metal adsorbed can operate in many reactions like acid, basic and both or redox. Giving the importance of redox process to the metal, the support’s acidity need to be taken in account too. To describe zeolites acidity is necessary to determine the density, strength and nature of acid sites (Brønsted or Lewis)1,20,23.
In this work two different structures, FAU and MFI, were choosing for preparing the heterogeneous catalysts. These structures have different pore sizes and Si/Al ratio, which confer different ion exchange capacity.
1.2.1. Zeolite Y
Zeolite Y is one of the two structures that compose the group of zeolites with faujasite (FAU) structure. It is characterized to have regular and large pores with a Si/Al ratio 2.5. The zeolite structure is represented by the chemical formula , and its arrangement in the space is represented by
Figure 3. In this representation, it is possible to identify two secondary building
units (SBU): sodalite cages and hexagonal double prisms. The supercages are formed by combination of the sodalite cages. Between the unit cells are formed channels that allows the diffusion along the catalyst20,31,32.
Exchangeable cations, as Na+, are introduced in the framework to compensate the negative charge created by Al-O link. These cations can be positioned in three different sites, named in Figure 3 by I, II or III, depending on the cation type or the oxidation state. Position I is in the hexagonal prism faces between the sodalite units, position II correspond to the sodalite cages in the open of hexagonal faces and position III is on the walls of supercages32. The metals introduced can change the acidity of zeolite and they can be also easily changed by ion exchange. Protons (H+) or ammonium (NH4+) are other cations that can be present in the zeolite or it can also be possible to obtain them by thermal treatment20,32,33.
1.2.2. Zeolite ZSM5
The zeolite ZSM5 is a high silica and medium-pore zeolite belonging to the framework type MFI and present high temperature stability (Figure 4). ZSM5 is composed of several pentasil units linked together by oxygen bridges to form pentasil chains. A pentasil unit consists of eight 5-membered rings. ZSM5 zeolites have a network of two systems of straight and sinusoidal channels running across each other. The medium pore diameters of this structure have one channel with the dimension of 0.55 x 0.51 nm and the other of 0.53 x 0.56 nm34,35.
Figure 4: Representation of the MFI framework type (adapted)34.
1.3. Objectives
The investigation work present in this thesis has the main objective of prepare and characterized heterogeneous catalysts to be applied in real situations of pollutant reduction. For achieve that goal, a controlled ion exchange method was used to prepare the mono and bimetallic catalysts using two zeolite structures.
Several characterization techniques were carried out, as pHPcz determination, scanning electronic microscopy (SEM/EDX), BET-areas, Chemical analysis and
temperature programmed reduction (TPR) in order to obtain information’s of the heterogeneous catalysts prepared. These informations are very important to understand the catalytic behaviour of the heterogeneous catalysts.
Finally, the catalytic activity of the heterogeneous catalysts prepared was evaluated using different oxidation reactions: CO oxidation, preferential oxidation in H2/CO mixing gases and H2 oxidation in gas phase and ozonisation in liquid phase. For understand the catalytic activity of the heterogeneous catalysts is important to analyse the reaction process taking in account the characterization results.
1.4. Thesis structure
This thesis is divided in 6 chapters, describing all the steps of the work. The first one is the state of art (introduction) which presents the reactions studied and the work already done in this field.
The second chapter is about the preparation methods. It includes the ion exchange method, the solutions used and the calcination and reduction treatments used for preparing the heterogeneous catalysts.
The third chapter cover all aspects of the characterization techniques used in this work. The heterogeneous catalysts were characterized by pHPCZ determination, scanning electronic microscopy (SEM/EDX), BET-areas, chemical analysis and temperature programmed reduction (TPR) and discussion of the obtained results is also present.
In the fourth chapter, the catalytic results are presented and discussed. Here is present the results of the catalytic activity of the heterogeneous catalysts prepared using different oxidation reactions: CO oxidation, preferential oxidation in H2/CO mixing gases and H2 oxidation in gas phase and ozonisation in liquid phase. In this chapter, the catalytic performance of the heterogeneous catalysts and the relation with the characterization results were highlighted.
The fifth chapter provides an overview of all results and present the conclusions. Some suggestions for future work are also expressed in this chapter.
Last but not least, the sixth chapter present the references used in all the thesis. This Master thesis was carried out at the Centre of Chemistry at the Department of Chemistry of the University of Minho and the Laboratory of
Industrial Chemistry from Cagliari University, Italy. The ozonisation catalytic tests were performed at the Laboratory of Catalysis and Materials (Associate Laboratory LSRE/LCM), at the Department of Chemical Engineering, Faculty of Engineering of the University of Porto.
Chapter II
Catalysts preparation
“Try to move the world,
the first step is to move
yourself”
Platão
Chapter 2: Catalysts Preparation
This chapter presents the general considerations to the execution of the experimental work with emphasis in the description of the preparation of mono and bimetallic catalysts using zeolites.
The mono and bimetallic catalysts were prepared by ion exchange method using two zeolite structures, as supports. The parent zeolites were NH4-Y, from faujasite (FAU) structure, and NH4-ZSM5 that belongs to pentasil (MFI) structure. All zeolites are in powder form, were obtained from Zeolyst International and were used as received. The main characteristics of the zeolites are described in
Table 1.
Table 1: Characteristics and supplier specifications of the zeolite structures used in this work.
Zeolite name
Framework type
Stabilizing
Ion Si/Al ratio
Total surface area (m2/g) Supplier reference NH4-Y FAU NH4+ 2.55 925 CBV 300 NH4-ZSM5 MFI NH4+ 15.0 405 CBV 3024E
For the ion exchange method, the reactants used were copper(II) nitrate and palladium(II) nitrate (Table 2). All reactants were purchased with high purity level and they were used without any treatment.
Table 2: Characteristics and supplier specifications of the reactants used in this work.
Reactant Molecular formula Molecular weight (g/mol) Hazard statements (H) Precautionary statements (P) Supplier Copper(II) nitrate Cu(NO3)2.2.5H2O 232.59 H272 H302 H315 H318 P220 P280 P305+P351+P338 Riedel de Haen Palladium(II) nitrate Pd(NO3)2.2H2O 266.44 H272 H314 P220 P280 P305+P351+P338 P310 Sigma Aldrich
All metal catalysts were prepared following the same procedure as described in detail elsewhere35. Several mono and bimetallic catalysts with zeolites were prepared by ion exchange method. The metal solutions used in this work are described in Table 3, and the same metal solution was used for prepare one mono and one bimetallic catalyst. The nomenclature used for the identification of the metal catalysts prepared was M-zeo, where M represents the metal and zeo the zeolite structure.
Table 3:Solutions prepared used in ion exchange method.
Reactant Weight (g) Solution volume (mL) Concentration (mol/L) Catalysts Copper(II) nitrate 1.1637 500 0.01 Cu-zeo PdCu-zeo Copper(II) nitrate 0.4652 200 0.01 CuPd-zeo Palladium(II) nitrate 1.3334 500 0.01 PdCu-zeo Pd-zeo
In this method, after the filtration step, the resulting solids were calcined for 4 h in a tubular vertical oven at 500 ˚C, with a rate of heating was 10 ˚C/min, under a dried air flow, 50 mL/min. Finally, the catalysts were also reduced in a tubular vertical oven, at 200 ˚C during 3 h, under a hydrogen flow, 50 mL/min. The heating (10 ˚C/min) and the cooling were done under the nitrogen flow, also with a, 50 mL/min flow.
So, the monometallic catalysts (Cu-zeo and Pd-zeo) were prepared by adding 6 g of zeolite to 100 mL of the corresponding metal solution in an Erlenmeyer flask with stirrer (300 rotations per minute) at room temperature during 24 h. The suspensions were filtered off, washed in a fritted funnel G4 pore volume and dried at 90 ˚C during 12 h. The monometallic catalysts were calcined under a dry air flow and reduced under hydrogen flow. The bimetallic catalysts (CuPd-zeo and PdCu-zeo) were prepared by the introduction of the second metal (0.01 M solution) into the 3 g of the monometallic catalyst by ion exchange after the reduction step. The bimetallic catalysts were prepared and calcined/reduced in the same conditions as described above.
Figure 5 shows a scheme for the preparation of the heterogeneous catalysts by
ion exchange method.
Figure 5: Scheme of the heterogeneous catalysts preparation method.
Table 4 presents the catalysts prepared and the theoretical amount of the
metal in each mono and bimetallic catalyst.
Table 4:Mono and bimetallic catalysts prepared.
Zeolite Metal
Solution Final catalyst
Theoretical metal (%) NH4-Y NH4-ZSM5 Copper(II) nitrate Cu-HY Cu-HZSM5 1.06 (Cu) Cu-Y Cu-ZSM5 Palladium(II) nitrate CuPd-HY CuPd-HZSM5 1.06 (Cu) 1.77 (Pd) NH4-Y NH4-ZSM5 Palladium(II) nitrate Pd-HY Pd-HZSM5 1.77 (Pd) Pd-Y Pd-ZSM5 Copper(II) nitrate PdCu-HY PdCu-HZSM5 1.77 (Pd) 1.06 (Cu)
Chapter III
Catalysts characterization
“Know yourself and you will
know the universe and the
gods.”
Sócrates
Chapter 3:
Catalysts Characterization
This chapter covers all aspects and details related to the characterization of the mono and bimetallic catalysts using zeolites. The characterization results and the discussion will be also present at long the chapter.
3.1
pH
PCZdetermination
The measurement of zero charge potential, generally called pHPCZ, has the main objective to determine the pH value of the neutralization of the material solid surface36,37. This parameter gives information’s about the acidity or basicity character of the supports and the determination was carried out only for the parent zeolites.
Initial, the parent zeolites NH4-Y and NH4-ZSM5 were calcined at 500 ºC under a dried air flow for obtaining the protonic form H-Y and H-ZSM5. After calcination, the ammonium present in these zeolites was transformed in NH3 and H+. NH3 desorbs and the presence of the protons increases the number of acid sites. So, in 8 Erlenmeyer flasks, three series correspond to the blank (series 1) and zeolite (series 2 and 3) tests, respectively, were added 20 mL of NaCl 0.10 M and the pH were adjusted with HCl 0.10 M and/or NaOH 0.10 M solutions pH for values of 3, 4, 6 and 8. In the series 2 and 3, it was introduced 20 mg of each zeolite. The blank series is important to detect the effect of CO2 in the final pH. All solutions were maintained under stirring during 4 h. At the end, the resulted suspensions were filtered by gravity and the final pH was measured. The pHPCZ value is the point where the curve of pHfinal vs pHinitial crosses the line pHinitial = pHfinal. Table 5 presents the results obtained for the parent zeolites.
Table 5:pHPZC values of the parent zeolites.
Zeolite pHPZC
HY 4.7
HZSM5 4.4
The pHPZC values obtained for HY and HZSM5 confirm the acidic proprieties of these parent zeolites, due to the presence of the protons in the structure after the calcination step.
3.2
Scanning electronic microscopy (SEM)
The catalytic activity is manly related by adsorption and desorption reactions at the material surface. In this way, the characterization of the morphology of the surface in solid phase has special attention38.
The microscopy has been used to produce images that illustrate the morphology surface of many materials. The introduction of electronic irradiation sources that allows higher magnification with excellent quality images, comparing with the traditional optic microscopy, provide a wide potential for the scanning electronic microscopy (SEM)39,40.
The principle of SEM is the irradiation by electrons in a specific point in a sample, resulting in a variety of signals with different information. Between them, stand out the back-scattered electrons with high energy, the secondary electrons with low energy and the characteristic X-ray electrons. The head of SEM are the secondary electrons, and after the primary radiation in a specific point it is done the scanning along parallel lines39. The image results in a topographic contrast provoked by differences in the conductivity variation at the sample41. The information collected by SEM images are the material roughness and with the variation of the primary radiation angle it is possible to project 3D images42.
Apart of other techniques that can give information at higher depth, as Auger electronic spectroscopy (AES) and X-ray photoelectron spectroscopy (XPS), SEM has the highlight on the easier operation method and the high number of results in a short period of time43. The main obstacle in the application of scanning electron microscopy is the not so easy sample preparation. There is an electric and/or magnetic field induced in the detector and because of that, the analysis need a high vacuum atmosphere and a considerable conductive surface. Otherwise the images produced can have associated some deformation39. The low or non-conductive materials issue radiation without velocity enough to be detected. This limitation can not only give distortion of the images but also change the sample composition. To avoid this problem, a thin layer of metal, in many cases gold, is deposited above the catalyst surface to improve the conductivity44.
The scanning electronic microscopy can also be coupled with Auger electrons or X-ray detectors to give some chemical composition45,46. In this case, SEM was
coupled with energy dispersive X-ray spectroscopy (EDX) that provided the elemental analysis of the surface. Comparing with other techniques as induced coupled plasma (ICP), the chemical analysis of SEM-EDS showed closer values43,47.
3.2.1 SEM Analysis
In order to evaluate the catalyst morphology, the samples were analyzed by SEM. Scanning electron micrographs of parent zeolites and catalysts were collected on a JEOL/EO Scanning Microscope equipped with an EDX system. In order to avoid surface charging, the samples were previously placed in a carbon tape and coated with a thin layer of gold (5 nm) for 15 min at a pressure of 10-5 Tor by using a Polaron SC502 sputter coated. The magnification of 5000x and 15000x were used with an energy beam of 15 kV.
Figure 6 displays the SEM micrographs of the parent zeolites.
Figure 6:SEM micrographs with the same magnifications of: HY (a) and HZSM5 (b).
Analysis of the SEM micrographs revealed that the parent HY zeolite present well-formed cubic particles typical of faujasite crystals with average size about 700 nm. However, SEM micrographs of the HZSM5 show the typical morphology of the zeolite with the individual particles forming larger and irregular aggregates, including small particles.
Also, SEM results show that no significant differences were found in the mono and bimetallic catalysts prepared by ion exchange method in both FAU and MFI structures. As we can see in Figures 7 and 8 which show the SEM results obtained for the bimetallic catalysts CuPd-ZSM5 and PdCu-HY, respectively, as example.
b) a)
Figure 7: SEM micrographs with the same magnifications of: HZSM5 (a) and Cu/Pd-ZSM5 (b).
Figure 8: SEM micrographs with the different magnifications of: HY (a) and Pd/Cu-HY (b).
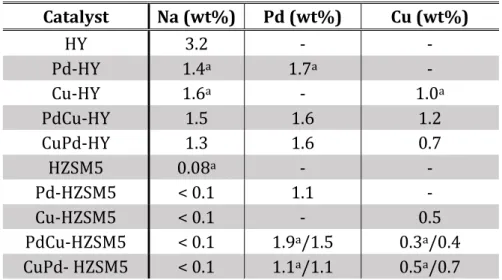
Comparing the SEM microphotographs of the parent zeolites and the bimetallic catalysts, respectively, no significant differences on morphology and particle size were found. The preparation of the catalysts by the ion exchange method does not cause any apparent modification on the morphology of the zeolites. SEM analysis provides also the chemical composition of the samples by the EDX analysis. Table 6 presents the results obtained for the metal catalysts. The amounts of metal (Cu or Pd) were obtained for the metal catalysts also by ICP-OE analysis.
Table 6:Chemical analysis obtained by SEM-EDS and ICP-OE analyses for the samples prepared.
Catalyst Na (wt%) Pd (wt%) Cu (wt%) HY 3.2 - - Pd-HY 1.4a 1.7a - Cu-HY 1.6a - 1.0a PdCu-HY 1.5 1.6 1.2 CuPd-HY 1.3 1.6 0.7 HZSM5 0.08a - - Pd-HZSM5 < 0.1 1.1 - Cu-HZSM5 < 0.1 - 0.5 PdCu-HZSM5 < 0.1 1.9a/1.5 0.3a/0.4 CuPd- HZSM5 < 0.1 1.1a/1.1 0.5a/0.7
aChemical analysis obtained by ICP-OES
a) b)
b) a)
The chemical results obtained by both techniques are very comparable. The amount of palladium in the catalysts was almost the same as the theoretical value expected (1.8 %). However, for the case of the copper, a decrease in the amount compared with theoretical value (1.1 %) was observed for all catalysts. The metal catalysts based in HY present the higher amount for both metals, than the catalysts based in HZSM5, due to the more ion exchange capacity of the zeolite HY.
3.3
Microcalorimetry
Microcalorimetry is an emerging technique to analyse the surface activity of solid materials. It is used a specific molecule as a probe, on a gaseous phase, which is adsorbed at the interface of the solid catalyst. In this case, the interaction of the adsorbent (solid) with the adsorbate (gas) results, generally, in an exothermic process. The energy released in the adsorption process, calling heat of adsorption, can be experimentally measured. So, it is assumed that the stronger interactions release the higher energy48.
The operation of microcalorimety is based in the measurement of an electrical potential generated by a calorimeter coupled with a sensible volumetric system. Through the Equation 6 it is possible to calculate the total heat involved in the adsorption. It is important to maintain a constant temperature in all system to have sure that every variation is associated with the surface interaction. After ensure a constant temperature, it is injected in the system a known amount of probe molecule until the surface be totally covered. In each addition is measured the heat released and the pressure drop comparing with the initially injected. This pressure drop corresponds to the amount of probe molecule that is adsorbed at the material surface. It is considered that the surface is completed covered when there is no pressure difference between the initial injection and the final measured38.
Eq. 6
where Qexp is the heat measured experimentally, K the equipment constant and E the potential measured in the thermopile.
There are many studies that can be done with this technique, as isothermal or calorimetric tests. However, the main focus is for the distribution of the reactive
sites along the material surface. It is represented the differential heat (Equation 7) as a function of the occupation of reactive sites. In this case, it is possible to verify the density of reactive sites relative of each level of link energy, giving information about the surface heterogeneity. Making some successive adsorptions we can know if there are some irreversible sites. In between the adsorption step is made a degasification for removing the linked molecules. The molecules that are not desorbed correspond to the strongest sites positions. The existence of baselines shows that can dwell some families of reactive sites with different levels of energy 38.
Eq. 7
where qdiff is the integral heat released in the interaction, na is the number of adsorbed molecules and m is the weight of catalyst.
Depending on the objective of study and of course the target information, a careful selection of the probe molecule is important. In the most common, acidity and basicity determination, the probe molecules used are ammonium and carbon dioxide, respectively. Otherwise, to discern between the different types of acid sites is necessary to introduce another molecule, usually pyridine 49.
3.3.1 Microcalorimetric Analysis
The microcalorimetric analysis was performed in a flow heat equipment TIAN-CALVET from SETERAM. Before the analysis, the activation of the surface was obtained with a calcination temperature of 500 ˚C, rate of heating of 1 ˚C/min during 12 h. To measure the pressure was used a capacitive manometer DATAMETRICS.
Figure 9 presents the microcalorimetric results obtained for HY and the metal
Figure 9: Microcalorimetric results for H-Y, Pd-HY, Cu-HY, Pd/Cu-HY and Cu/Pd-HY. It is presented the Qdiff along
the coverage of catalyst surface.
The results, presented in Figure 9, show a very similar behaviour, with slightly differences only in Cu-HY. In this catalyst, the strength of acid sites is a slight higher than the others catalysts. In order to determine the acid sites strength, a study of the percentage of each acid site was achieved. For this study, it was considered as weak acid sites, the ones were the molecules are adsorbed with Qdiff between 70 kJ/mol and 120 kJ/mol. The medium acid sites have a Qdiff between 120 kJ/mol and 150 kJ/mol and Qdiff higher than 150 kJ/mol are considered for the strong acid sites.
Table 7 shows the percentage of weak, medium and strong acid sites
determined for HY, HZSM5, and the mono and bimetallic catalysts prepared. Table 7: Percentage of weak, medium and strong acid sites of HY, ZSM5 and the heterogeneous catalysts prepared.
Percentage of coverage of acid sites (%)
Catalyst (70 < Qdiff < 120 kJ/mol)Weak (120 < Qdiff < 150 kJ/mol)Medium (Qdiff > 150 kJ/mol)Strong
HY 77 17 6 Pd-HY 88 10 2 Cu-HY 88 9 3 PdCu-HY 90 8 2 CuPd-HY 87 11 2 HZSM5 76 20 4 Pd-HZSM5 72 23 5 Cu-HZSM5 67 29 4 PdCu-HZSM5 82 15 3 0 100 200 300 400 500 0 1000 2000 3000 4000 Qdi ff . (kJ /mo l) coverage ( mol/g) H-Y Pd-HY Cu-HY Pd/Cu-HY Cu/Pd-HY Higher adsorption energy
CuPd-HZSM5 78 19 3
From the results, it is possible to verify differences between the parent zeolites and the metal catalysts. The introduction of metals in both structures by ion exchange method enhances differences in the distribution of the acid sites. For HY zeolite, the introduction of the metals decreases the medium and strong acid sites for all metal catalysts. However, for HZSM5 zeolite, the introduction of the metals increases the medium and strong acid sites, with in the monometallic catalysts the effect was more pronounced. These results suggest that the catalysts obtained with HZSM5 are more acidic than the metal catalysts based in HY zeolite, in agreement with pHPCZ.
3.4
Temperature programmed reduction (TPR)
The temperature programmed reduction (TPR) analysis is another example where a probe molecule can be informing about the solid surface characteristics. Here are applied reduction agents that provide information about the redox reaction that can occur at the catalyst surface 50. This technique uses a mixing of gases of low concentrate hydrogen in an inert gas that flows along the sample with a constant rate of heating. The system includes a thermal conductivity detector (TCD) that measures the amount of hydrogen that crosses the sample. If there is any reaction at the surface, the amount of H2 detected is less than that which is provided. The main information giving by TPR is the optimal temperature for the redox reactions. It is also possible to know the oxidation state of the catalyst’s metal if we can measure the amount of hydrogen that is consumed 51.
3.4.1 TPR Analysis
The TPR analysis was done in a TPDRO 1100 equipment. Before the analysis, the samples, that have been previously reduced, were calcined at 500 ˚C for 12 h. After that, they were treated for 1 h under a 50 mL/min air flow at the same temperature. The analysis was then realised under a 30 mL/min of hydrogen (H2,
5% (v/v)) in Nitrogen flow. The beginning temperature was 50 ˚C and it increased with a 5 ˚C/min rate until a maximum of 600 ˚C.
The temperature programmed reduction results for the catalysts obtained with HZSM5 zeolite are presented on Figure 10. It is represented the TCD signal with the increasing of temperature. With this values it is possible to identify the behaviour of each metal.
Figure 10: TPR results presented as TCD signal in function of the Temperature. It was tested about 100 mg of each catalyst: Cu-ZSM5, Pd-ZSM5, Cu/Pd-ZSM5 and Pd/Cu-ZSM5.
From the results, the monometallic catalysts present different profile. Cu-ZSM5 show a reduction peak observed at 220 ºC, which are attributed to the reduction of the copper. In the case of Pd-ZSM5, the curve profile is more complex. First, a remarkable inverse peak at 90 ºC was observed, due to higher adsorption of hydrogen and two reduction peaks in the range 330-450 ºC were detected, attributed to reduction of Pd. A reduction peak at 60 ºC is not observed in Pd-ZSM5, which is attributed to the decomposition of Pd -hydride phase. Both bimetallic catalysts show similar profile, with the inverse peak around 100 ºC and the two reduction peak in the same range at higher temperatures than the Pd-ZSM5. The increase of the temperature indicates the reduction of mixed Pd-Cu species when both metals are in close contact in the zeolite structure35.
3.5
Adsorption isotherms – BET areas
-45 -35 -25 -15 -5 5 15 25 0 100 200 300 400 500 600 700 TSD signa l (m V) Temperature (˚C)
The determination of adsorption of a gas in solid materials is a very useful technique. The interaction between the solid and the fluid is done not so at the regular surfaces but also at the channels and pores. So, it is important refer that the majority of solid materials are heterogeneous and, beyond the irregularities, can exist many types of sites with different affinity to interact with the adsorbate, and the adsorption is strongly influenced by room vapour pressure and temperature52. There are two ways of interaction between adsorbent and adsorbate: chemisorption and physisorption. They are distinguishing above all if exist or chemical linking or only intermolecular attraction, respectively. The physisorption is a mechanism that can be reverted with the improvement of the temperature or decreasing the vapour pressure, which provide information about the surface area, size and distribution of pores52.
The characterization of catalysts is obtained by studying the isothermal adsorption with different methods. Between them, the Brunauer–Emmet–Teller (BET) have more attention for the heterogeneous solid surfaces because is a simplified method that consider the multilayer formation and the existence of pores 53. Equation 8 shows how can treat the data:
Eq. 8
where, P/P0 is the relative pressure, Vads is the molecule volume adsorbed, Vml is the monolayer volume and CBET is the BET constant. Assuming the study of as function of , it is possible to determined the monolayer volume and the surface area of the material (Equation 9).
Eq. 9
assuming as the slope and as the intercept, the monolayer volume and the surface area can be express by Equations 10 and 11, respectively.
Eq. 10
where NA is the Avogadro’s number, am is the effective cross-section area of one adsorbed molecule, vm is the molar volume and ms is the amount adsorbed. In this case, a minimum number of 3 points are enough to determine the surface area. However, is convenient improve the number of points to get better fit of the linear regression. It is considered 0.9975 as reference for the linear correlation coefficient. The values equal to 0.9975 or upper are acceptable to de analysis52,53.
3.5.1 BET Analysis
The BET analysis were done in a 4200e equipment (QUANTACHOMES INSTRUMENTS) using as probe molecule N2 at 77 K. 150 g of sample were weight and exposed a high vacuum system under a He flow and 523 K for 5 h.
For all metal catalysts, the surface areas were calculated by the BET equation
(SBET). Table 8 presents the SBET results obtained for the parent zeolites and the
metal catalysts prepared.
Table 8: SBET of parent zeolites and the metal catalysts prepared.
Catalyst S BET (m 2 /g) HY 925 Pd-HY 884 Cu-HY 948 PdCu-HY 518 CuPd-HY 730 HZSM5 437 Pd-HZSM5 460 Cu-HZSM5 470 PdCu-HZSM5 431 CuPd-HZSM5 447
The results show that the surface area of the ZSM5 zeolite seems to be not affect by the introduction of the metals, especially when the zeolite was submitted to two ion exchange treatments. This situation changes in the case of HY zeolite. The introduction of metal, especially palladium reduces a lot the surface area of the catalysts. In opposite to ZSM5, bimetallic catalysts showed the very remarkable changes.
Chapter IV
Catalytic activity
“And those who were seen dancing
were judged insane by those who could
not hear the music”
Friedrich Nietzsche
Chapter 4:
Catalytic activity
This chapter presents the catalytic results and related discussion of the heterogeneous catalysts prepared by ion exchange method using zeolites, previously described in Chapters 2 and 3. Despite FAU and MFI zeolites were used for prepared the heterogeneous catalysts, both structures were evaluated in different catalytic reactions. First, the catalytic results of the CO oxidation in gas phase obtained with the heterogeneous catalysts prepared with FAU zeolite are discussed. The choice of this zeolite is due to their lower Si/Al ratio and favourable microporous structure, where the supercages interlinked by large pore three-dimensional channels offer the ideal support for entrapped higher amount of different metal species. In the second part of this chapter, the results of the catalytic ozonisation of salicylic acid (SA) in phase liquid were discussed. For this reaction, the heterogeneous catalysts evaluated were prepared with MFI zeolite. This structure presents higher Si/Al ratio with an acidity which make interesting for apply in the ozonisation reaction. SA was choosing as model for emergent pharmaceutical pollutant in water.
4.1 CO Oxidation – Gas phase reaction
The heterogeneous catalysts prepared with HY zeolite were evaluated by CO oxidation using Gas-phase chromatography (GC) as the technique for identification and quantification. GC is a very popular technique used for quantification and it is based on the partition between a mobile gaseous phase carrying the analyte and a stationary phase, which may be solid (gas-solid chromatography) or immobilized liquid (gas-liquid chromatography). The basic principle in GC is the separation of the components of a sample by their different affinity for the stationary phase.
The analysis in GC starts with the injector where the sample is quickly heated and vaporized. The sample vapours are transported through the column by an inert gas (mobile phase), helium or nitrogen, which should be chosen depending on type of detector used. One of the most frequently employed detectors in GC analysis is the flame ionization detector (FID), which consists of a H2/air burner fitted with a collector electrode over the flame. The thermal conductivity detector
(TCD) is a chemical specific detector. This detector senses changes in the thermal conductivity of the column effluent and compares it to a reference flow of carrier gas. Since most compounds have a thermal conductivity much less than that of the common carrier gases of helium or hydrogen, when an analyte elutes from the column the effluent thermal conductivity is reduced, and a detectable signal is produced. When organic compounds are pyrolized by the flame, ions are produced, which decreases electrical resistance, allowing electric current to flow through the plasma. This current is detected by the electrode and the amount of ionized species (which in turn is related to their concentration) promotes a linear response. The signals acquired by the detector are presented as a chromatogram with depicted as detector signal in function of elution time54.
4.1.1 CO Oxidation
The first catalytic studies were performed with CO oxidation reaction, without the presence of hydrogen (H2). This decision was made due to the fact that studies reported in the literature showed good selectivity to CO2 in CO oxidation with palladium and copper mixing. For this reaction, all heterogeneous catalysts prepared with HY zeolite were evaluated, in order to determine which catalyst is more active at lower temperatures and assess the range temperature in which the catalysts are active.
The catalytic tests were done in quartz tubular vertical reactor. About 60 mg of catalyst, after transformed in a homogeneous powder, were placed between two layers of quartz wool. The experiment was performed in a CO (1.36%)/O2 (1.33%)/He (helium) gas mixture with a flow rate of 56.81 mL/min. According to
Equation 12, the gas space velocity (GHSV) used was about 56 810 mL/hg. The
outgas measurements were performed in a gas chromatograph with both TCD and FID detectors (equipped with a methanator).
Eq. 12
Before the reaction starts, is important to control the gas flow and activate the catalyst. So, the exact flow of each gas and also the total flow needed to be
corrected and measured. For the activation step, the catalyst was placed in the reactor and the temperature was increased to 200 ˚C (10 ˚C/min) under He flow (20 mL/min) overnight.
After the activation step, the catalysts were treated for 1 h under hydrogen, to outwit any possibility of oxidation. With this reduction treatment, all catalyst surface is available to be active to oxidise.
The catalytic test started with a low temperature (40ºC) and it was increased slowly until the total conversion has been observed. The program temperature for CO oxidation is present in Figure 11. Each Temperature was kept for 30 min before injection to allow the achievement of the stationary state conditions.
Figure 11: CO conversion program temperature.
Catalytic results are shown in Figure 12. HY zeolite was first tested to evaluate the possible contribution of the support. As expected, the parent zeolite was not active. Cu-HY shows a very low activity with CO conversion values lower than 1 mol % even at 245 ˚C. On the other hand, Pd-HY is much more active, exhibiting a complete conversion of CO at 200˚C. Interestingly, when the two metals are simultaneously present on the HY zeolite, a manifest in activity occurs. Both catalysts convert 100 mol % of CO at 190 ˚C, and the temperature value required to achieve 50 mol % of conversion shifts from 193 ˚C to 184 ˚C for PdCu-HY and 193 ˚C to 183 ˚C for CuPd-HY. This clearly demonstrates the synergistic effect of Pd and Cu in the bimetallic catalysts. However, only slight differences in the catalytic behaviour are shown by the two samples.
Comparing the catalytic results with the results of catalysts characterization (Chapter 3), it is possible to see that the presence of the metal species and the acidity behaviour are the main proprieties for the redox process. The acidity of the zeolite plays an important role in the activity of the heterogeneous catalysts. The pHPZC value obtained for HY was 4.7, which confirms the acidic properties of the
parent zeolite, which correspond to 80% of weak acid sites, and to 20% of medium plus strong acid sites. The introduction of the metals preserves this acidity with a decrease (around 10 %) in the medium and strong acid sites (Table 7, Chapter 3).
Figure 12: CO oxidation results for the heterogeneous catalysts prepared.
From chemical analysis, the amount of copper was 1.0 wt% in Cu-HY, 0.70 wt% in CuPd-HY and 1.20 wt% for PdCu-HY. While the palladium content is the same for both bimetallic catalysts, 1.60 wt%, and 1.70 wt% for Pd-HY. In the case of the bimetallic catalysts, Pd/Cu atomic ratio in these catalysts is 0.80 for PdCu-HY (44.3% of Pd and 55.7% of Cu) and 1.40 for CuPd-HY (42.3% of Cu and 57.7% of Pd). The small difference observed in catalytic activity for both bimetallic catalysts probably is related to different PdCu atomic ratio in the catalysts. This ratio is almost the double in CuPd-HY which enhance the activity of the catalyst.
4.1.1 Preferential CO oxidation
The preferential oxidation of CO under H2-rich conditions (PROX) was performed to evaluate the activity of the selected bimetallic catalyst for residual CO removal (or H2 purification)55. It is important to have present that in feed gas mixing, the catalyst need to be selective to a specific gas. Hereupon, the catalyst used for PROX was CuPd-Y once that this catalyst showed the higher activity in CO oxidation. The experimental conditions adopted for PROX reaction includes a feed gas mixing with oxygen (1.35 %) and CO (1.32 %) in 5 % in He, and H2 (46.57 %) making a total flow of 53.81 % with GHSV value of 53 810 mL/hg.
0.0 20.0 40.0 60.0 80.0 100.0 160.0 170.0 180.0 190.0 200.0 CO c o n ve rsi o n ( % ) Temperature (˚C) Cu-Y Pd-Y CuPd-HY PdCu-HY
As in CO oxidation, the PROX performance follow a program of temperature very well defined. Here, as the value for CO oxidation was determined before, the beginning temperature was adjusted to the range of CO oxidation. The program temperature for PROX used is represented in Figure 13.
Figure 13: Program temperature for PROX.
Figure 14 shows the preferential CO oxidation reaction obtained for CuPd-HY. CO2
and H2O species were the reaction products detected. This bimetallic catalyst showed a very unexpected behaviour, since it was expected O2 should be selective to form CO2 instead of water. In this case, a little amount of CO2 (0.05%) was obtained for almost 100 % (98.66) of O2 conversion at 220 ˚C.
Figure 14: O2 conversion in function of Temperature in Prox reaction. The reaction occurred in about 53.81 mL/min
total flow, with a GHSV of 53 810 mL/hg.
In Figure 15 is represented the selectivity of the catalyst for CO2 along of the temperature reaction increasing. The very low values (1.80 %) at 220 ˚C of selectivity, confirms the catalytic behaviour analysis.
50 60 70 80 90 100 160 180 200 220 O2 Co nv er sio n (%) T (˚C)
Figure 15: Selectivity of O2 to form, the preferentially CO2 for CuPd-HY, represented as function of temperature
increasing.
4.1.2 H2 oxidation
To clarify the results obtained for PROX reaction, the hydrogen oxidation reaction was performed. H2 oxidation was carried out in O2 (1.32%) balanced with He and H2 (46.05 %) feed gas mixing, with a total flow of 54.42 mL/min and a GHSV of 54 420 mL/hg. Considering the possibility of H2 conversion occur at very low temperatures, the hydrogen oxidation was started at 40 ˚C and after, the temperature was increased until the total conversion was verified. The program temperature for H2 oxidation is presented on Figure 16.
Figure 16: H2 oxidation program temperature.
The catalytic activity for H2 oxidation is represented in Figure 17. In agreement with PROX results, H2 oxidation starts at very low temperatures, presenting 60 % of oxygen conversion even at lower temperatures (40 ˚C). This remarkable results can be explained by the affinity of Pd to H2, fact that is presented on TPR results (Chapter 3) that presents an inverted peak corresponding, possibly, to an adsorption of H2 on the catalysts surface at low temperatures.
0.00 1.00 2.00 150 170 190 210 230 Select iv it y ( m o l%) T (°C)
Figure 17: O2 conversion in function of Temperature in H2 oxidation. The reaction occurred in about 54.42 mL/min
total flow, with a GHSV of 54 420 mL/hg.
To confirm these results, other reaction studies should be present, as infra-red spectra to follow the reaction process. Knowing that this procedure is very expensive, the calibration of water in GC could identify if it is on the outgas products. On the other hand, other characterization methods could be useful to understand the catalytic activity. X-ray photoelectronic spectroscopy (XPS) or transmission electronic microscopy (TEM) could give some information about the position of metal particles along the zeolite structure, and this way it possible to understand which catalyst is more appropriated for each reaction. Also the acid sites can be characterized by using two different probe molecules and it is possible to distinguish Lewis acid sites and Brønsted acid sites and verify if anyone is more active for a specific reaction.
4.2 Salicylic Acid (SA) Ozonisation – Liquid phase reaction
The ozonisation of salicylic acid (SA) was studied in liquid phase using heterogeneous catalysts prepared with ZSM5 zeolite. This zeolite structure has higher Si/Al ratio which promote different acid sites and SA was choosing as model for emergent pharmaceutical pollutant in water.
The ozonisation tests were performed in a laboratory scale reactor (1 L) equipped with agitation (300 rpm) and circulation jacket. In each ozonisation test, the reactor is filled with 700 mL of salicylic acid solution (5×10⁻⁴ M) and 350 mg of
0 20 40 60 80 100 40 60 80 100 O2 Co nv er sio n (%) T (˚C)