Article
J. Braz. Chem. Soc., Vol. 26, No. 4, 695-704, 2015. Printed in Brazil - ©2015 Sociedade Brasileira de Química 0103 - 5053 $6.00+0.00
A
*e-mail: [email protected]
CO Oxidation Catalyzed by Ag Nanoparticles Supported on SnO/CeO
2Inayat A. Khan,a Nida Sajid,a Amin Badshah,*,a Muhammad H. S. Wattoo,a Dalaver H. Anjumb and Muhammad A. Nadeema
aCatalysis and Nanomaterial’s Lab 27, Department of Chemistry, Quaid-i-Azam University,
45320 Islamabad, Pakistan
bImaging and Characterization Lab, King Abdullah University of Science and Technology,
Thuwal, Saudi Arabia
Ag-Sn/CeO2 catalysts were synthesized by the co-precipitation method with different Ag-Sn wt.% loadings and were tested for the oxidation of CO. The catalysts were characterized by powder X-ray diffractometry (XRD), scanning electron microscopy (SEM), high-resolution transmission electron microscopy (HRTEM), energy dispersive X-ray spectroscopy (EDS), and selected area electron diffraction (SAED) techniques. UV-Vis measurements were carried out to elucidate the ionic states of the silver particles, and the temperature-programmed reduction (TPR) technique was employed to check the reduction temperature of the catalyst supported on CeO2. There are peaks for silver crystallites in the X-ray diffraction patterns and the presence of SnO was not well evidenced by the XRD technique due to sintering inside the 3D array channels of CeO2 during the calcination process. The Ag-Sn/CeO2 (4%) catalyst was the most efficient and exhibited 100% CO oxidation at 100 °C due to small particle size and strong electronic interaction with the SnO/CeO2 support.
Keywords: co-precipitation, crystallites, energy dispersive X-ray spectroscopy, reducibility
Introduction
Silver oxide nanoparticles (NPs) are considered excellent catalysts for many catalytic reactions such as formaldehyde synthesis, NOx abatement, ethylene
epoxidation, oxidative coupling of methane, selective oxidation of ammonia and ethylene glycol, partial oxidation of benzyl alcohol and oxidation of styrene and carbon monoxide.1-17 The catalytic performance of silver NPs
largely depends on surface area, surface texture, synthetic methods and reaction conditions. It has been reported by researchers that pretreatment of silver oxide in O2 at high temperature results in the formation of subsurface oxygen which activates the catalyst.18-23 There are endorsements
that Ag0 species is an excellent catalyst below 140 °C,
while above 140 °C, Ag+ is much active for CO oxidation.5
CO catalytic oxidation has been extensively studied for its widespread applications in the subject of environmental protection, closed cycle CO laser and selective oxidation of CO in reformer gases for fuel cell applications, etc.24-26 A number of metal nanocatalysts (e.g., Au/TiO
2,
Pt/Al2O3, etc.) have been recognized to be very effective
in CO oxidation reaction.27-29 It has been accepted that
silver dispersed on silica is more dynamic and stable than silver supported on carbon nanotubes or reducible oxides (Mn2O3, TiO2).30-32 Afanasev et al.33 have reported that Ag
supported on fumed silica (4 wt.%) is very effective in CO oxidation reaction [T100 = 30 °C]. On the other hand,
Yu et al.34 testified that the catalytic efficiency of silver NPs
supported on SiO2 for CO oxidation at ambient temperature
is quite low due to particle agglomeration and single phase of the support materials. Zhang et al.35 have also reported that silver NPs on mesoporous silica (SBA-15) is an ideal candidate for CO oxidation (T98 = 20 °C) and they have
proposed evaporation-deposition-diffusion mechanism for metal-supported interactions. Zhu et al.36 have published that gold NPs confined within the mesoporous silica are stable after heat treatment. Sun et al.37 explored that due to the confinement effect of mesoporous channels of the support for silver NPs, the particles are located outside as well as inside the channels even after thermal treatment at high temperature (500 °C).
gases, gas diffusion and adsorption.38-40 The unsaturated
bonds present on the surface of solid hybrid/composite materials act as active sites for gas adsorption. The changes in morphology may be thermal or reaction induced.39 The
thermally induced morphological changes occur with or without the presence of reacting atmosphere while reaction induced morphological change takes place only in a reacting atmosphere. These induced changes result in a structure different from those formed even after thermal treatment in inert atmosphere or vacuum.39,41-43 This phenomenon
is called adsorbate-induced alterations of the surface free energy. The adsorption of O2 on solids at elevated
temperature decreases the surface free energy. However, the thermal treatment of silver at high temperature is not affordable due to low melting point (960 °C), reversible redox behavior, sintering inside the support channels and morphological changes.17 Thus, there is a need of third
body metal to facilitate the redox behavior of silver and also its sintering inside the support channels without severe thermal treatment.
In the present work, Ag-Sn (with equal wt.% loading) bimetallic nanocatalysts supported on ceria were synthesized for CO oxidation reaction using co-precipitation method. It was observed that the tin oxide sintered in the 3D array of ceria during thermal treatment (at 400 °C) formed a platform for silver NPs. The tin oxide particles facilitated the silver sintering and controlled its redox behavior for catalytic purposes.44-46 Our research group is still interested
to further investigate and propose a mechanism for this dual function of tin oxide NPs in catalysis.
Experimental
Synthesis of ceria and catalysts
For the synthesis of ceria, Ce(NO3)3
⋅
6H2O (1.5 g;3.45 mmol) was dissolved in 25 mL of distilled water. To the cerium salt solution, aqueous NaOH (2 mol L–1;
pH > 12) was added dropwise under magnetic stirring at room temperature leading to the formation of a yellow precipitate. The product was obtained at folded filter paper, washed with excess distilled water and dried at 105 °C.47
Ce3+ + H
2O → Ce(OH)3+ + H+ + e–
(oxidation at pH > 10) (1)
Ce(OH)3+ + 3OH–→ Ce(OH)
4 (hydrolysis) (2)
Ce(OH)4→ CeO2
⋅
2H2O (3)CeO2
⋅
2H2O → CeO2 + 2H2O (drying at 105 °C) (4)Similarly, co-precipitation method was employed for the synthesis of Ag-Sn/CeO2 catalysts for which CeO2
slurry was prepared in distilled water (25 mL) and the salt solutions (AgNO3 and SnCl2
⋅
2H2O) with an appropriatequantity for the catalysts were added dropwise. The salt solutions were added separately to avoid the precipitation of Ag+ and Cl– (Ag+ + Cl– → AgCl
ppt). pH of the mixture
was maintained at 12 by adding NaOH solution dropwise under gentle stirring at room temperature. Powdered catalysts were obtained after washing with distilled water till the pH came to neutral. After drying, the catalysts were thermally treated at 400 °C to remove impurities. The different catalysts were synthesized like Ag-Sn/CeO2 (1%), Ag-Sn/CeO2 (2%), Ag-Sn/CeO2 (3%)
and Ag-Sn/CeO2 (4%) in accordance with the successive
increase in the Ag-Sn wt.% loadings.
Ag+ + H
2O →Ag(H2O)+ (5)
2Ag(H2O)+ + 2OH–→ Ag2O + 3H2O (6)
Ag2O + H2O → 2Ag + 2OH– (7)
Sn2+ + 2OH–→ Sn(OH)
2 (8)
Sn(OH)2→ SnO
⋅
H2O (9)SnO
⋅
H2O → SnO + H2O (10)Characterization techniques
PANalytical diffractometer (X’Pert PRO 3040/60) with a Cu Kα (λ = 1.544206 Å) radiation generated at
40 kV and 30 mA was used for X-ray diffractometry (XRD) measurements, which were carried out at a speed of 0.015 degree s–1. Surface morphology of catalysts was
examined by scanning electron microscopy (SEM) (JEOL JSM-6610LV) and high-resolution transmission electron microscopy (HRTEM) of samples was conducted with FEI Company Titan 80-300 CT TEM by operating it with the acceleration voltage of 300 kV. Moreover, the energy dispersive X-ray spectra (EDS) of samples were also acquired during their conventional transmission electron microscopic (CTEM) investigations. Finally the selected area electron diffraction (SAED) patterns from various regions of samples were acquired for the determination of crystal structures. It should be noted that the entire electron micrographs acquired with TEM were recorded on a 4 k × 4 k charge coupled device (CCD) camera of model US4000 from Gatan, Inc. The UV-Visible (diffuse reflectance) spectra were recorded with a UV-1800 spectrophotometer (Shimadzu). The temperature-programmed reduction (TPR) analyses of the samples were carried out on a Micromeritics (Chemisorb-2750) with H2/Ar (10 vol.%) as a reducing agent (flow rate of
35 cm3 min–1) at a heating rate of 15 °C min–1 from room
to the reduction, the samples (120 mg) were pretreated in helium at 300 °C for 90 min.
CO oxidation experiments
The CO oxidation catalytic activity was conducted by a fixed bed flow reactor system with a quartz tube (5 mm outer diameter) fixed in a tube furnace (Nabertherm B 180) at atmospheric pressure and 0.3 g of catalyst load. The reactant gas, consisting of CO, O2 (1:2 vol.%) and balanced with Ar,
was supplied with mass flow controller and mixed with each other, and then the final reactant gas mixture (35 cm3 min–1)
was passed through the catalyst bed. The samples were activated at 350 °C for 120 min by Ar flow (35 cm3 min–1)
before the reaction. The CO oxidation reaction was studied in the temperature range of 25-250 °C and the reactor effluent was analyzed using an online gas chromatograph system (GC-2010 Plus, Shimadzu) with Molecular Sieves 5A (30 m) column and TCD. Conversion of CO to CO2 was calculated from the gas chromatographic (GC)
data according to the equation: Xco = [CO]* – [CO] / [CO]*;
where Xco is CO conversion, [CO]* and [CO] are the inlet
and outlet gas concentrations (ppm), respectively.
Results and Discussion
Characterization of the catalysts
Powder X-ray diffractometry (PXRD) technique was used to investigate the chemical composition and crystalline phases of the synthesized catalysts. The X-ray diffraction pattern of the free support (CeO2) and
catalysts with different Ag-Sn wt.% loading is presented in Figure 1 after calcination at 400 °C. There are peaks in the diffraction pattern a (Figure 1) at 2θ = 28.6, 47.3, 56.4, and 72.4° corresponding to the (111), (220), (311) and (400) lattice planes, respectively, (Joint Committee on Powder Diffraction Standards (JCPDS) cards file No. 00-004-0593) of CeO2. The X-ray pattern shows the
three-dimensional cubic structure of CeO2 with Fm-3m space
group. The calculated crystallite size from the respective 2θ values falls in the range of 4.6-10 nm and the average size is 7 nm. It is also obvious from the diffraction pattern of CeO2 that all the characteristic peaks are broad and of
quite low intensity due to small particle size. In catalysis, small particle size of the support plays an important role in metal particles distribution and reaction selectivity like CO oxidation. In the X-ray diffraction, patterns (Figure 1, patterns b, c, d and e) of the nanocatalyst peaks are present for CeO2, SnO, Ag2O and Ag. Ag characteristic peaks are
present at 2θ = 44.4, 64.6 and 77.6° due to the (200), (220)
and (311) lattice planes, respectively, in all the catalysts systems. Small peaks at 2θ = 54.3°, (Figure 1, patterns b and c), 69.2° (Figure 1, pattern d) and 82.4° (Figure 1, patterns d and e) correspond to the (220), (222) and (400) lattice planes, respectively, of Ag2O in the synthesized
catalysts. Peak at 2θ = 38.4° corresponds to the (111) lattice plane of Ag and (200) lattice plane of Ag2O. The
observed mirror indices for Ag and Ag2O reflect cubic
(fcc) geometry (JCPDS cards file No. 00-001-1164 for Ag and 00-001-1041 for Ag2O) with space groups Fm-3m and
Pm-3m, respectively. Peak at 2θ = 33.4° corresponds to the (002) lattice plane of CeO2 and to the (111) lattice plane of
Ag2O and this peak can also be assigned to SnO (JCPDS
cards file No. 00-001-0902) in all the catalyst diffraction patterns. Other corresponding peaks of SnO do not appear in the diffraction pattern of the catalysts probably due to two possible reasons: (i) the particle size is very small, i.e., below the detection limit of X-ray radiation; and (ii) SnO is intermingled in the 3D array of cerium(IV) oxide in such a way that it forms a combined plate form for silver NPs and is not explored in the XRD analysis. Peaks responsible for Ag and Ag2O crystallites become intense and sharper
in the XRD pattern of Ag-Sn/CeO2 (3%) catalyst system
(Figure 1, pattern d), suggesting comparatively large particle size. It is clear from Figure 1 that the diffraction peaks for Ag and Ag2O are not of equal intensity suggesting
that the crystallites are not of equal size. The crystallite size (d) calculated for Ag and Ag2O at 2θ = 77.6 and 38.4°
using the Scherrer equation is given in Table 1. There is no linear relationship between particle size and Ag-Sn wt.% loading. Possible reason for this nonlinear relationship is the phenomenon of particle agglomeration that takes place during co-precipitation synthesis. In case of Ag-Sn/CeO2
(3%), the particle size of Ag and Ag2O reaches up to 18.32
and 22.12 nm (Table 1), respectively, showing maximum crystallite aggregates formation. The calculated crystallite size (d) at 2θ = 33.5° for SnO via Scherrer equation ranges from 2 to 4 nm in all the catalysts systems.
An EDS spectrum of Ag-Sn/CeO2 (4%) catalyst
acquired in CTEM mode is shown in Figure 2, which ratifies peaks for oxygen, silver, tin and cerium. There is a single point at 3 keV for silver, two peaks at 3.4 and 3.55 keV for tin and two peaks at about 3.9 and 5.2 keV for cerium metal. Peaks are originated at 8 and 0.35 keV due to copper grid and carbon polish, used for sample analysis. The EDS analysis illustrates that tin is the part of catalyst system but its presence is not confirmed by PXRD technique.
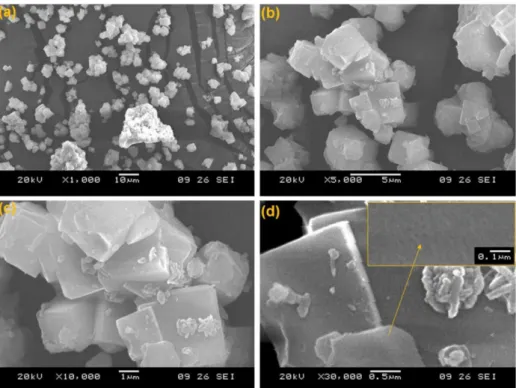
and small average particle size (3-8 nm) (Figure 5) after calcination in air at 400 °C. It has been reported by Zhang et al.17 that when the catalysts are treated at 500 °C temperature in O2 silver’s particles, dispersion increases but no such
changes have been observed in this case which may be due to the stability of the silver NPs in the presence of tin oxide providing synergistically a platform along with ceria. No clear distinction can be drawn between silver and tin particles in the HRTEM micrographs due to a small difference in their atomic numbers. Collectively the particle size of the Ag-Sn in 4 and 2% metal loading catalysts is small in comparison to 3 and 1% metal loading catalysts (Table 1 and Figure 5). So, no clear correlation with increasing metal loading and particle size is observed in this study. SAED results are in good agreement with PXRD patterns of the catalysts.
The ionic states of silver in Ag-Sn/CeO2 catalysts were
further studied by UV-Vis measurements after thermal treatment at 400 °C in air. Figure 6 is the UV-Vis spectra of Ag-Sn/CeO2 catalysts with different Ag-Sn wt.% loading.
Generally, there are three bands from different oxidation states of silver reported in different research articles. These are absorption bands at 220 nm for Ag+, at 275 nm for
Agnδ+ clusters and at 410 nm for metallic Ag0 NPs.17 In the
work presented, in the absorption spectra of Ag-Sn/CeO2
catalysts, no band is observed at 410 nm for Ag0 in all
catalysts combinations suggesting the non-interaction mode of Ag0 with support because of the reduced form. There
are two surface resonance plasmon centered at 310 and 350 nm in the catalysts having 1, 2, and 3 wt.% loading of metals while the catalyst with 4 wt.% metal loading has only a small band at 350 nm. The band, centered at 310 nm, is attributed to the transition of electron from 4d10
to 4d95s1 of highly dispersed Ag+ ions, while band centered
at 350 nm is due to the Agnδ+ clusters. The observed red
shift for Ag+ (from 220 to 310 nm) and for Ag
nδ+ (from
275 to 350 nm) in case of Ag-Sn/CeO2 (3%), Ag-Sn/CeO2
(2%), and Ag-Sn/CeO2 (1%) catalysts is due to the strong
interaction of silver particles with SnO/CeO2 support,
which synergistically facilitates the electronic transition.1
In UV-Vis measurements the intensity of the band is related to the average size of the NPs. When the particles aggregate and particle size increases comparatively (up to certain extent), the intensity of the absorption band increases as in the case of Ag-Sn/CeO2 (3%) catalyst while
band of 310 nm for Ag+ disappeared in Ag-Sn/CeO 2 (4%)
catalyst combination, which is due to small particle size as confirmed by HRTEM and PXRD analysis. In the UV-Vis spectrum of pure CeO2 support, there is a broad absorption
band, centered at 370 nm for localized oxygen-cerium charge transfer transition.48 The CeO
2 characteristic band
in the different catalysts combination does not appear at the
Table 1. Ag/Ag2O crystallite size from powder XRD at 2θ = 77.6 and
38.4°, mean particle size of catalysts from TEM analysis
Catalyst
Particle size / nm
XRD
TEM
Ag Ag2O
Ag-Sn/CeO2 (1%) 6.08 6.66 5.50 ± 1.907
Ag-Sn/CeO2 (2%) 6.19 23.62 4.67 ± 1.773
Ag-Sn/CeO2 (3%) 18.32 22.12 7.55 ± 1.21
Ag-Sn/CeO2 (4%) 2.74 5.52 3.67 ± 1.936
30 40 50 60 70 80
2θ / degree Ag
Ag2O (a) (b) (c) (d) (e)
Figure 1. XRD pattern of: (a) CeO2 support; (b) (Ag-Sn/CeO2) (1%);
(c) (Ag-Sn/CeO2) (2%); (d) (Ag-Sn/CeO2) (3%); and (e) (Ag-Sn/CeO2) (4%). Cu Kα (λ = 1.544206 Å) X-ray radiation source generated at 40 kV and 30 mA was used for XRD analysis.
Figure 2. Representative EDS spectrum of Ag-Sn/CeO2 (4%) catalyst
shows Ag, Sn and Ce as the main constituents of catalyst’s combination. The EDS spectrum of sample was acquired during their TEM investigation.
and SAED techniques were employed to investigate the size and distribution of nanoparticles supported on CeO2.
The results compiled by these techniques are presented in Figures 4a-d, which illustrate that the silver-tin particles are well dispersed on ceria matrix with narrow size distribution
30 40 50 60 70 80
2θ / degree
Ag
Ag2O
Figure 3. SEM images showing the cubic morphology (a, b, c and d) and porous plane (inset of image d) of the Ag-Sn/CeO2 nanocatalysts.
Figure 4. HRTEM images for: (a) Ag-Sn/CeO2 (4%); (b) Ag-Sn/CeO2 (1%); (c) Ag-Sn/CeO2 (3%); and (d) Ag-Sn/CeO2 (2%) catalysts. The inset pictures
respective λmax probably due to the electronic interaction between the metal load and support. The absence of CeO2
absorption band distinctly in the catalyst systems further confirm the red shift for Ag+ and Ag
nδ+ clusters and blue shift
for CeO2 due to silver support (SnO/CeO2) interaction.49
The UV-Vis studies strongly suggest the interaction of silver ionic species with SnO/CeO2 which affects its redox
properties during catalysis. The primary focus of this work is to control the redox property of silver without harsh thermal treatment by incorporating a third body metal, which is conclusively shown by UV-Vis studies.
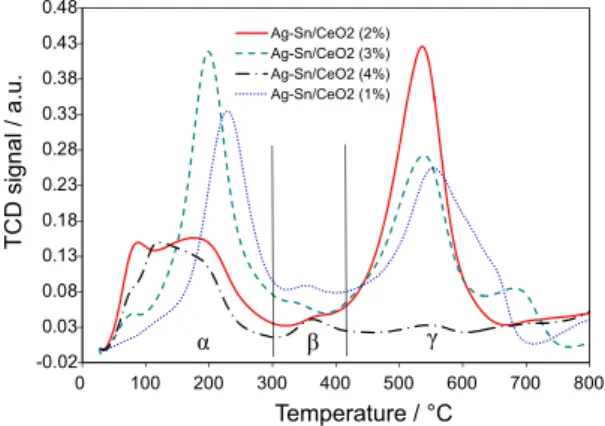
The reducibility of the synthesized catalysts was examined by TPR technique and the H2-TPR profiles are
presented in Figure 7. In the examined temperature range (25-800 °C) the catalyst’s H2-TPR profiles consist of
three reduction zones, which are in the temperature range of 50-280 °C (α), 280-430 °C (β) and 430-750 °C (γ), respectively. According to the reported literature work, there is no reduction peak below 400 °C for pure support (ceria).50 In our studies several reduction peaks are present
in the H2-TPR profiles of the Ag-Sn/CeO2 catalysts in the
whole temperature range. Peaks in the temperature range of 50-280 °C (α-temperature zone) can be assigned to the
reduction of oxygen adsorbed on the surface of catalyst and to the reduction of Ag2O to Ag.51 In the total amount of
silver, the oxidized species (Ag2O) is not of equal amount;
so, the peak responsible for Ag+ reduction is not of equal
intensity in all the catalyst combinations. Consequently, the peak area for Ag+ reduction, i.e., the amount of consumed
hydrogen does not increase gradually with increasing amount of silver loading. Peaks in the β-temperature zone (280-430 °C) of the four catalysts are due to the
0 5 10 15 20 25 30
1.703 2.74
5
3.414 4.422 5.579 7.747 11.753
Size / nm (d)
Frequenc
y
(a)
0 5 10 15 20 25
Frequenc
y
Size / nm
3.121 4.065 5.91
1
6.233 7.321 8.347 11.056 2.333
3.5
4.585 5.691 6.793 7.395 8.557 11.076
(b)
0 5 10 15 20 25
Size / nm
Frequency
(c)
0 5 10 15 20 25
3.31 1
4.023 5.021 6.221 7.161 8.377 11.192
Frequency
Size / nm
Figure 5. Particle size distribution from TEM analysis of CeO2 supported nanocatalysts: (a) 1%; (b) 2%; (c) 3%; and (d) 4%.
0 0.1 0.2 0.3 0.4
280 330 380 430 480
A
b
s
o
rb
a
n
c
e
/ a.u.
Wavelength / nm
350 nm 3 0 nm1
370 nm
(a) (b) (c) (d)
(e)
Figure 6. UV-Vis absorption spectra of: (a) Ag-Sn/CeO2 (4%); (b) Ag-Sn/
reduction of surface capping oxygen of SnO.44 There is
an intense peak and a small shoulder in the γ-temperature zone (430-750 °C) in the H2-TPR profiles of Ag-Sn/CeO2
(1%), Ag-Sn/CeO2 (2%) and Ag-Sn/CeO2 (3%) catalysts.
The intense peak can be assigned to the reduction of bulk cerium(IV) oxide while the shoulder is due to the reduction of surface capping oxygen of ceria.52 In the H
2-TPR profile
of Ag-Sn/CeO2 (4%) catalyst, there is a small peak and a
shoulder with almost the same intensity in the γ-temperature zone for the reduction of bulk and surface capping oxygen of ceria. The decrease in peak intensity for ceria reduction in Ag-Sn/CeO2 (4%) catalyst is probably due to the small
particle size and high surface area of CeO2, which ensures
the dispersion of metals over the surface. The dispersion of metals over the support surface further facilitates the electronic interaction of metal with support and lower hydrogen consumption for CeO2 reduction. Alternatively,
it is obvious from the β-temperature zone that the peak responsible for the reduction of surface capping oxygen of SnO is comparatively intense in the H2-TPR profile of
Ag-Sn/CeO2 (4%) catalyst, presenting high consumption of
hydrogen because of their enhanced electronic interaction. Kharlamova et al.49 have also reported that Ag2O and CeO2 interact with each other strongly and there is a simultaneous reduction of both in α-temperature zone. Therefore, the peak responsible for CeO2 reduction in γ-temperature zone
is very minute for Ag-Sn/CeO2 (4%) catalyst in comparison
with other options. There is shifting of peaks with changing metal wt.% loading on support due to interaction with support up to different extent. In the H2-TPR profiles of
Ag-Sn/CeO2 (2%) and Ag-Sn/CeO2 (3%) catalysts the reduction
maxima for Ag+ ion shift toward low temperature as
compared to Ag-Sn/CeO2 (1%) catalyst profile probably due
to: (i) comparatively weak interaction of Ag+ with support;
and (ii) the increasing quantity of SnO also facilitates the
reducibility of Ag+. The peak intensity in the TPR profile
has a relationship with the size of nanocatalysts particle. The present TPR studies have shown that Ag-Sn/CeO2 (4%)
catalyst system consists of small reduction peaks due to very fine particle size of metals and support as well.
Catalytic activity
Catalytic activities of Ag-Sn/CeO2 catalysts and pure
support CeO2 prepared by co-precipitation method and
later calcination at 400 °C towards CO oxidation are shown in Figure 8. The CO conversion increases with reaction temperature and all the silver catalysts can completely oxidize CO to CO2 at certain temperature. For 99%
conversion of CO, the temperature for catalysts with 1, 2, 3, and 4% metal loading are 152, 133, 157, and 98 °C, respectively (Table 2). Meanwhile, pure support CeO2 is
also active in CO oxidation reaction and demonstrates 99% conversion at about 170 °C. The activity slope of CeO2 can
be divided into three temperature events. The first event is below 60 °C - its activity is lower than Ag-Sn/CeO2 (3%)
catalyst and presents 8% CO conversion at about 58 °C. The second temperature event is in the range of 60 to 120°C, where its activity is almost equal to Ag-Sn/CeO2 (1%)
catalyst. The third event is beyond 120 °C, where the slope again goes beneath the slope of Ag-Sn/CeO2 (3%) catalyst.
This irregular behavior of CeO2 with temperature toward
CO oxidation in comparison with other catalysts is due to the particle size, oxygen capturing property and thermal changes. At the same temperature, the four catalysts have exhibited relatively higher activities than the catalysts reported by Yu et al.34 supplying the reaction mixture with
flow rate of 50 cm3 min–1. This is because of silver loading
with appropriate quantity and the incorporation of SnO in support platform for controlling the redox behavior of silver ion. The important factor that influences the activity of nanocatalysts is the particle size. The surface-to-volume ratio becomes larger and the concentration of partially coordinated surface sites becomes higher when the particle size decreases.34 It has been usually observed
by different researchers that the activity increases with decrease in particle size. In the present research work, there is a relationship between silver particle size and catalytic activity. Based on 99% CO conversion the activity of the four catalysts is in the order Ag-Sn/CeO2 (4%) >
Ag-Sn/CeO2 (2%) > Ag-Sn/CeO2 (1%) > Ag-Sn/CeO2
(3%). In comparison, the particle size was also in the same order: Ag-Sn/CeO2 (4%) > Ag-Sn/CeO2 (2%) >
Ag-Sn/CeO2 (1%) > Ag-Sn/CeO2 (3%), as illustrated from
HRTEM and PXRD data (Table 1 and Figure 5). Particle size smaller than 3 nm is also the worst for Ag catalytic -0.02 0.03 0.08 0.13 0.18 0.23 0.28 0.33 0.38 0.43 0.48
0 100 200 300 400 500 600 700 800
TCD signal
/ a.u.
Temperature / °C Ag-Sn/CeO2 (2%) Ag-Sn/CeO2 (3%) Ag-Sn/CeO2 (4%) Ag-Sn/CeO2 (1%) γ α β
Figure 7. H2-TPR profiles of CeO2 supported nanocatalysts in the
temperature range of 25 to 800 °C. The H2-TPR of samples were carried out with H2/Ar (10 vol.%) as a reducing agent (flow rate of 35 cm3 min–1) at a heating rate of 15 °C min–1.
-0.02 0.03 0.08 0.13 0.18 0.23 0.28 0.33 0.38 0.43 0.48
0 100 200 300 400 500 600 700 800
TCD signal
/ a.u.
activity because it leads to a wider band gap and results in metal to nonmetal transition owing to which it cannot dissociate molecular oxygen for the catalytic conversion of CO to CO2. In the present studies, the particle size of Ag
in Ag-Sn/CeO2 (4%) catalyst is below 3 nm but presents
superb catalytic activity among the other options. This behavior of the catalysts can be assigned to the electron donating effect of Sn (Electronegativity (E. N.) = 1.8 eV) for being less electronegative than Ag (E. N. = 1.9 eV), which results in shorter band gap and enhanced catalytic activity. In comparison to the work reported by Zhang et al.,35,53 that Ag/SBA-0500 and Au/SiO2,catalysts have 98% CO conversion at 190 and 400 °C, respectively. El-Shall and co-workers54-57 have reported the synthesis of Ag,
Pd and Au (5 wt.%) nanoparticles and AuPd, PdAg (5 wt.%) bimetallic nanoalloys supported on CeO2
for CO oxidation by two different methods, like laser vaporization and microwave irradiation. They found out that Pd/CeO2 and Au/CeO2nanocatalysts, developed by
laser vaporization technique, have converted CO to CO2
with 100% efficiency at 108 and 163 °C, respectively, while the catalyst combinations Ag/CeO2, Pd/CeO2 and
Au/CeO2 synthesized via microwave irradiation showed
100% CO to CO2 conversion at 266, 151, and 301 °C,
respectively (Table 2). The bimetallic nanoalloys, supported on CeO2 and synthesized by microwave irradiation, have
demonstrated 93% CO conversion at 186 °C. The catalyst combination Ag-Sn/CeO2 (4%), presented in this study, has
demonstrated 100% CO to CO2 conversion at 100 °C, which
is the superb catalytic activity among the other options. This excellent catalytic performance could be attributed to the strong metal-support electronic interaction, which controls the redox behavior of silver nanoparticles.
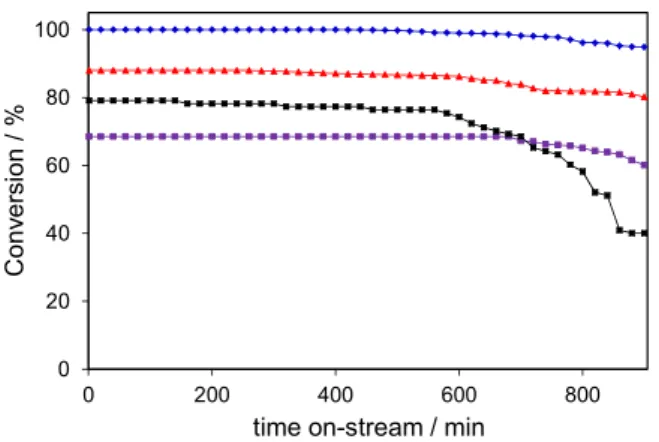
To evaluate the long term stability and reproducibility of the designed nanocatalysts stability, tests were performed under stationary condition and fixed temperature. The
stability of CeO2 supported nanocatalysts was tested for
900 min (15 h) at 110 °C and the results are shown in Figure 9. In the selected time period, the stability of the catalysts is in the order: Ag-Sn/CeO2 (4%) > Ag-Sn/CeO2 (3%) >
Ag-Sn/CeO2 (2%) > Ag-Sn/CeO2 (1%) = CeO2. Surprisingly,
the CO conversion over the 4, 2 and 3% catalysts is as high as 97, 85 and 64%, respectively, for about 700 min. These values decrease slowly to 95, 80 and 60% after keeping the catalysts at 110 °C for 900 min. The 4, 2 and 3% catalysts have demonstrated 5, 8 and 6% stability loss in the whole testing period, respectively. Possible explanation for the long term stability of these catalysts is the appropriate quantity of metal loading on support and their mutual interaction for reproducing their electronic states, which is a key factor for catalytic recycling. The behavior of Ag-Sn/CeO2 (1%) catalyst is different from the other
options and the CO conversion percentage decreases from 79 to 40% with 39% stability loss for 900 min at
20 40 60 80 100 120 140 160
0 20 40 60 80 100
CO conversion / %
Temperature / °C Ag-Sn/CeO2 (1%)
Ag-Sn/CeO2 (2%) Ag-Sn/CeO2 (3%) Ag-Sn/CeO2 (4%) CeO2
Figure 8. Catalytic activity for CO oxidation of Ag-Sn/CeO2 catalysts
with different Ag-Sn wt.% loading and CeO2 support. The reactor effluent was analyzed using an online gas chromatograph system with Molecular Sieves 5A (30 m) column and TCD detector.
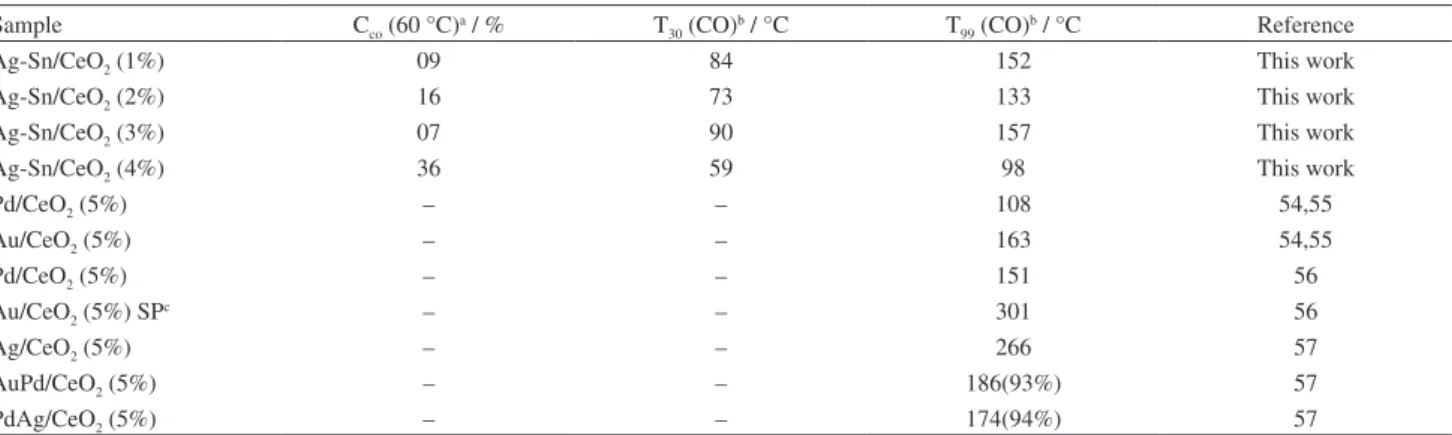
Table 2. CO oxidation over Ag-Sn/CeO2 catalysts with different Ag-Sn wt.% loading and literature reported catalytic activities of Pd, Au, Ag nanoparticles
and AuPd, PdAg bimetallic nanoalloys supported on CeO2
Sample Cco (60 °C)a / % T
30 (CO)b / °C T99 (CO)b / °C Reference
Ag-Sn/CeO2 (1%) 09 84 152 This work
Ag-Sn/CeO2 (2%) 16 73 133 This work
Ag-Sn/CeO2 (3%) 07 90 157 This work
Ag-Sn/CeO2 (4%) 36 59 98 This work
Pd/CeO2 (5%) – – 108 54,55
Au/CeO2 (5%) – – 163 54,55
Pd/CeO2 (5%) – – 151 56
Au/CeO2 (5%) SPc – – 301 56
Ag/CeO2 (5%) – – 266 57
AuPd/CeO2 (5%) – – 186(93%) 57
PdAg/CeO2 (5%) – – 174(94%) 57
110 °C. Similar behavior to Ag-Sn/CeO2 (1%) catalyst for
pure CeO2 support was observed under the same testing
conditions.
Conclusions
In summary, catalyst combinations like Ag-Sn/CeO2
with different Ag-Sn wt.% loading were synthesized by co-precipitation method, characterized by a range of instrumental techniques and tested for catalytic CO oxidation reaction. PXRD and HRTEM analyses confirmed that these catalysts have small particles with narrow size distribution over support surface. UV-Vis and H2-TPR measurements
have recommended strong metal-support interaction, which expedites the catalytic activity and catalysts stability. The catalysts are classified by increasing the order of their activity as Ag-Sn/CeO2 (3%) < Ag-Sn/CeO2 (1%) <
Ag-Sn/CeO2 (2%) < Ag-Sn/CeO2 (4%) after their testing for
CO oxidation reaction. The Ag-Sn/CeO2 (4%) catalyst is the
most promising catalyst combination of this study among the other options, which presents 100% CO oxidation at 100 °C and only 5% stability loss at 110 °C for 900 min due to small particle size and strong metal-support interaction.
Acknowledgements
This work was supported by the Higher Education Commission (HEC) of Pakistan (No. 20-1638/ R&D/09/2900). The authors thank PhD Dalaver Hussain Anjum (KAUST Saudi Arabia) for high resolution TEM and SAED analyses.
References
1. Dai, W. L.; Yong, C.; Ren, L. P.; Yang, X. L.; Xu, J. H.; Li, H. X.; He, H. Y.; Fan, K. N.; J. Catal.2004, 228, 80.
0 20 40 60 80 100
0 200 400 600 800
Conv
ersion
/
%
time on-stream / min
Figure 9. Stability performance of the nanocatalysts supported on CeO2:
(a) 4%; (b) 2%; (c) 3%; and (d) 1%. Testing condition: 1 vol.% CO, 2 vol.% O2 and Ar balanced, 110 °C, 35 cm3 min–1.
2. Shi, C.; Cheng, M. J.; Qu, Z. P.; Bao, X. H.; J. Mol. Catal. A: Chem.2005, 235, 35.
3. Lee, J. H.; Schmieg, S. J.; Oh, S. H.; Appl. Catal., A2008, 342, 78.
4. van Santen, R. A.; Kuipers, H. P. C. E.; Adv. Catal.1987, 35, 265.
5. Zhang, L.; Zhang, C. B.; He, H.; J. Catal.2009, 261, 101. 6. Nagy, A. J.; Mestl, G.; Schlögl, R.; J. Catal.1999, 188, 58. 7. Yamamoto, R.; Sawayama, Y.; Shibahara, H.; Ichihashi, Y.;
Nishiyama, S.; Tsuruya, S.; J. Catal.2005, 234, 308. 8. Purcar, V.; Donescu, D.; Petcu, C.; Luque, R.; Macquarrie, D. J.;
Appl. Catal., A2009, 363, 122.
9. Magaev, O. V.; Knyazev, A. S.; Vodyankina, O. V.; Dorofeeva, N. V.; Salanov, A. N.; Boronin, A. I.; Appl. Catal., A2008, 344, 142.
10. Frey, K.; Iablokov, V.; Melaet, G.; Guczi, L.; Kruse, N.; Catal. Lett.2008, 124, 74.
11. Song, K. S.; Kang, S.; Sim, S. D.; Catal. Lett.1997, 49, 65. 12. Xu, R.; Wang, X.; Wang, D. S.; Zhou, K. B.; Li, Y. D.; J. Catal.
2006, 237, 426.
13. Wang, A. Q.; Liu, J. H.; Lim, S. D.; Lin, T. S.; Mou, C. Y.; J. Catal.2005, 233, 186.
14. Wang, A. Q.; Hsieh, Y. P.; Chen, Y. F.; Mou, C. Y.; J. Catal.
2006, 237, 197.
15. Liu, X. Y.; Wang, A. Q.; Yang, X. F.; Zhang, T.; Mou, C. Y.; Su, D. S.; Li, J.; Chem. Mater. 2009, 21, 410.
16. Liu, H. Y.; Ma, D.; Blackley, R. A.; Zhou, W. Z.; Bao, X. H.; Chem. Commun.2008, 23, 2677.
17. Zhang, X.; Qu, Z.; Li, X.; Wen, M.; Quan, X.; Ma, D.; Wu, J.; Sep. Purif. Technol.2010, 72, 395.
18. Bao, X.; Muhler, M.; Pettinger, B.; Schlögl, R.; Ertl, G.; Catal. Lett.1993, 22, 215.
19. Bao, X.; Muhler, M.; Pettinger, B.; Schlögl, R.; Ertl, G.; Catal. Lett.1995, 32, 185.
20. Schubert, H.; Tegtmeyer, U.; Herein, D.; Bao, X.; Muhler, M.; Schlögl, R.; Catal. Lett.1995, 33, 305.
21. Su, D. S.; Jacob, T.; Hansen, T. W.; Wang, D.; Schlögl, R.; Freitag, B.; Kujawa, S.; Angew. Chem., Int. Ed. 2008, 47, 5005.
22. Qu, Z. P.; Cheng, M. J.; Huang, W. X.; Bao, X. H.; J. Catal.
2005, 229, 446.
23. Christopher, J. B.; Charles, A. M.; J. Catal.1999, 184, 224. 24. Gardner, S. D.; Hoflund, G. B.; Upchurch, B. T.; Schryer, D. R.;
Kielin, E. J.; Schryer, J.; J. Catal. 1991, 129, 114.
25. Gardner, S.; Hoflund, G.; Schryer, D.; Schryer, J.; Upchurch, B.; Kielin, E.; Langmuir1991, 7, 2135.
26. Qu, Z.; Cheng, M.; Huang, W.; Bao, X.; J. Catal.2005, 229, 446.
27. Pietron, J.; Stroud, R.; Rolison, D.; Nano Lett.2002, 2, 545. 28. Qu, Z. P.; Huang, W. X.; Cheng, M. J.; Bao, X. H.; J. Phys.
Chem. B2005, 109, 15842.
0 20 40 60 80 100
0 200 400 600 800
Conv
ersion
/
%
29. Bamwenda, G.; Tsubota, S.; Nakamura, T.; Haruta, M.; Catal. Lett.1997, 44, 83.
30. Hu, R. R.; Xie, L. Y.; Ding, S.; Hou, J.; Cheng, Y.; Wang, D. Z.; Catal. Today2008, 131, 513.
31. Comsup, N.; Panpranot, J.; Praserthdam, P.; Catal. Commun.
2010, 11, 1238.
32. Dai, Y. M.; Pan, T. C.; Liu, W. J.; Jehng, J. M.; Appl. Catal., B
2010, 103, 221.
33. Afanasev, D. S.; Yakovina, O. A.; Kuznetsova, N. I.; Lisitsyn, A. S.; Catal. Commun.2012, 22, 43.
34. Yu, L. B.; Shi, Y. Y.; Zhao, Z.; Yin, H. B.; Wei, Y. C.; Liu, J.; Kang, W. B.; Jing, T. S.; Wang, A. L.; Catal. Commun.2011,
12, 616.
35. Zhang, X.; Qu, Z.; Yu, F.; Wang, Y.; J. Catal.2013, 297, 264. 36. Zhu, H. G.; Liang, C. D.; Yan, W. F.; Overbury, S. H.; Dai, S.;
J. Phys. Chem. B2006, 110, 10842.
37. Sun, J. M.; Ma, D.; Zhang, H.; Liu, X. M.; Han, X. W.; Bao, X. H.; Weinberg, G.; Pfänder, N.; Su, D. S.; J. Am. Chem. Soc.
2006, 128, 15756.
38. Backx, C.; de Groot, C. P. M.; Biloen, P.; Surf. Sci.1981, 104, 300.
39. Wei, T. C.; Phillips, J.; Adv. Catal.1996, 41, 359.
40. Bao, X.; Barth, J. V.; Lehmpfuhl, G.; Schuster, R.; Uchida, Y.; Schlögl, R.; Ertl, G.; Surf. Sci.1993, 284, 14.
41. Marta, C. N.; de Carvalho, A.; Passos, F. B.; Schmal, M.; J. Catal.2007, 248, 124.
42. Bron, M.; Teschner, D.; Wild, U.; Steinhauer, B.; Knop-Gericke, A.; Volckmar, C.; Wootsch, A.; Schlögl, R.; Claus, P.; Appl. Catal., A2008, 341, 127.
43. Shimizu, K.; Miyamoto, Y.; Satsuma, A.; ChemCatChem2010,
2, 84.
44. Li, K.; Wang, Y.; Wang, S.; Zhu, B.; Zhang, S.; Huang, W.; Wu, S.; J. Nat. Gas Chem.2009, 18, 1.
45. Avgouropoulos, G.; Ioannides, T.; Appl. Catal., A2003, 244, 155.
46. Chen, Y.; Zhang, L. F.; Catal. Lett.1992, 12, 51.
47. Djuričić, B.; Pickering, S.; J. Eur. Ceram. Soc.1999, 19, 1925. 48. Bensalem, A.; Bozon-Verduraz, F.; Delamar, M.; Bugli, G.;
Appl. Catal., A 1995,121, 81.
49. Kharlamova, T.; Mamontov, G.; Salaev, M.; Zaikovskii, V.; Popova, G.; Sobolev, V.; Knyazev, A.; Vodyankina, O.; Appl. Catal., A2013, 467, 519.
50. Yen, H.; Seo, Y.; Kaliaguine, S.; Kleitz, F.; Angew. Chem., Int. Ed.2012, 51, 12031.
51. Yatsimirskii, V. K.; Oleksenko, L. P.; Lutsenko, L. V.; Chen, Y.; Russ. J. Phys. Chem. A2008, 82, 1460.
52. Giordano, F.; Trovarelli, A.; Leitenburg, C.; Giona, M.; J. Catal.
2000, 193, 273.
53. Qian, K.; Jiang, Z. Q.; Huang, W. X.; J. Mol. Catal. A: Chem.
2006, 264, 26.
54. Yang, Y.; Saoud, K. M.; Abdelsayed, V.; Glaspell, G.; Deevi, S.; El-Shall, M. S.; Catal. Commun.2006, 7, 281.
55. Glaspell, G.; Hassan, H. M. A.; Elzatahry, A.; Abdalsayed, V.; El-Shall, M. S.; Top. Catal.2008, 47, 22.
56. Glaspell, G.; Fuoco, L.; El-Shall, M. S.; J. Phys. Chem. B2005,
109, 17350.
57. Abdalsayed, V.; Aljarash, A.; El-Shall, M. S.; Al Othman, Z. A.; Alghamdi, A. H.; Chem. Mater.2009, 21, 2825.
Submitted: May 31, 2014