Article
Printed in Brazil - ©2018 Sociedade Brasileira de Química
*e-mail: monicaneves03@gmail.com
Aqueous Ultrasound-Assisted Extraction for the Determination of Fluoroquinolones
in Mangrove Sediment by High-Performance Liquid Chromatography and
Fluorescence Detector
Mônica A. Neves,*,a Gilmar S. Silva,b Natilene M. Brito,b Karla C. M. Araújo,b
Edmar P. Marquesa and Lanna K. Silvab
aLaboratório de Pesquisa em Química Analítica (LPQA), Departamento de Química,
Universidade Federal do Maranhão (UFMA), Av. Portugueses, s/n, Bacanga, 65080-040 São Luis-MA, Brazil
bDepartamento de Química, Instituto Federal de Educação, Ciência e Tecnologia do Maranhão,
Monte Castelo Campus, Av. Getúlio Vargas, No. 04, 65030-005 São Luís-MA, Brazil
A method for simultaneous analysis of ciprofloxacin (CIP), levofloxacin (LEV) and norfloxacin (NOR) in mangrove sediment was developed using aqueous ultrasound-assisted extraction (UAE), solid phase extraction (SPE) and high-performance liquid chromatography with fluorescence detection (HPLC-FD). The method showed excellent linear correlation coefficient for the three fluoroquinolones (r2 > 0.999) using external calibration curve and good recovery in real sediment
samples ranging from 73.73 to 88.85%. The precision showed a relative standard deviation lower than 20% and detection limits of 1.10, 3.33 and 0.26 µg kg-1 to CIP, LEV and NOR, respectively.
There was no presence of interfering. After validation, the method was applied in the determination of pharmaceuticals in mangrove sediment in the Paciência River, Maranhão Island, Brazil. Only the CIP antibiotic was found in three of six samples analyzed, with values ranging 56.55-70.45 µg kg-1.
Keyword: fluoroquinolones, sediment, ultrasound assisted extraction, solid phase extraction
Introduction
Antibiotics are substances used worldwide in human and veterinary medicine to inhibit the growth of microorganisms, treat diseases (therapeutic purposes), prevent diseases caused by the presence of pathogenic organisms in the human or animal (prophylactic) and to
promote growth.1,2
The fluoroquinolones antibiotics negatively affect the environment by chronic effect in biota or potential
resistance in microorganisms.3-6 They are released
continuously into the environment as a result of industrial processes, and discharges of commercial products or human or livestock sewage directly into water bodies, soil
and sediments.6-8
Estimates of worldwide total antibiotic consumption in livestock alone range from 60,000 to 240,000 tons
annually.9 Until 2030 in some countries, including Brazil,
the consumption might increase by 67%. That Brazil is
one of the leaders in poultry and cattle production and exportation implies that a great quantity of antibiotics is used annually in this economic activity. In addition, Brazil has only 40% of its sewage treated, and in the Northwest region this value drops to 28.8%. These situations imply that much of the antibiotic residue consumed by humans
is released into water bodies.10
Over the past few years, environmental regulatory agencies in developed countries have worked to establish regulatory guidelines to control harmful substances in the
environment, and more specifically, to human health.8-10
The main concern is that many emerging contaminants are not yet included in environmental legislation around the world. Currently, only a few isolated compounds have been regulated, although the vast majority still remain without
legal definitions as their presence in different matrices.11 At
the same time, some studies address the problem focusing on both the presence of these contaminants and the acute
and chronic effects on living organisms.11,12
carboxylic and carbonyl functional groups in positions 1,
3 and 4, respectively.13 The addition of fluorine in position
7 produces the fluoroquinolones antibiotics. In Table 1 are described the physicochemical properties and chemical structure of some fluoroquinolones: ciprofloxacin (CIP),
levofloxacin (LEV) and norfloxacin (NOR).13,17 CIP,
LEV and NOR have been used in human medicine. CIP
and NOR are also used in veterinary applications.20,21
The carboxylic and fluorine groups contribute to polar
characteristics of fluoroquinolones, resulting in log Kow
ranging from −1.03 to 0.89.19 Hydroxyl, amide or ketone
radicals in fluoroquinolones are able to form complex
with cations (Ca2+, Mg2+, and Al3+) commonly found in the
environment.13,19 The fluoroquinolones have amphoteric
properties due to carbonyl and nitrogen functional groups in its structure. The ionizable functional groups carboxylic
(pKa1) and nitrogen (pKa2) are responsible for cationic,
anionic, neutral and zwitterionic species according to pH. The species define fluoroquinolone mobility in solid
matrices.10
There are few methods described in literature for analysis of the fluoroquinolones in solid environmental matrices,
such as soil and sediment of water bodies.22,23 Most methods
are described for aqueous environmental matrices, for example, high performance liquid chromatography (HPLC) using different detectors, such as UV-Vis, fluorescence and
mass spectrometry.22-25
The great challenge for analysis of fluoroquinolones in solid matrices involves the presence of organic matter and metallic cations, responsible for the strong interactions
with sediment and soil.26 The analytical protocol involved
in fluoroquinolones analysis in solid samples, such as sediment/soil, is related to sample preparation which requires time-consumption and several steps. In addition, after fluoroquinolones extraction, a subsequent purification protocol is required. The association of these two previous
protocol is a precondition for different analytical methods.13
For the preparation of solid samples, there are traditional extraction techniques such as mechanical agitation and
extraction by Soxhlet.11 Alternatives techniques have
been studied to improve the performance of extraction of
analytes, such as pressurized liquid extraction (PLE),27,28
also known as accelerated solvent extraction (ASE),29,30
microwave assisted extraction (MAE)31,32 and ultrasound
assisted extraction (UAE).33-35 Solid phase extraction (SPE)
technique has been chosen for purification of extracts due to its efficiency and availability of phases. As an alternative, two SPE cartridges are set up in tandem for purification of
the aqueous extracts.25,36
The objective of this study was to develop and apply methodology using ultrasound assisted extraction (UAE), solid phase extraction (SPE) and high-performance liquid chromatography with fluorescence detection (HPLC-FD) for simultaneous analysis of CIP, LEV and NOR in
Table 1. Physicochemical properties of fluoroquinoles
Compound Structure pKa log Kowa,b
Kda (soil) /
(L kg−1)
Kda (sediment) /
(L kg−1)
Zwitterionic
point (pH) Reference
CIP pKa1 = 5.90
pKa2 = 8.89
−2.82; 2.30/−0.81
74; 1,277,874/21,099
794;
18,620/7,000 7.5 14-16
LEV pKa1 = 5.59
pKa2 = 7.94
−2.00;
1.30/−0.72 − − 6.77 16-18
NOR pKa1 = 6.20
pKa2 = 8.55
−3.78; 1.45/−1.17
41;
335,633/29,876 30; 75/54 7.34 14,16,19
Kow: octanol-water partition coefficient; Kd: distribution coefficient. alog Kow and Kd were presented as minimum and maximum/mean; bdepending on
mangrove sediments in the estuary of the Paciência River, located in Maranhão Island, belonging to legal Amazon, Brazil.
Experimental
Standards and reagents
CIP, LEV and NOR were obtained from Sigma-Aldrich (St. Louis, MO, USA) both with a minimum purity of 98%. All organic solvents used have chromatographic grade (methanol, acetonitrile and dichloromethane) and were obtained from Merck (Darmstadt, Germany). Other reagents used have analytical purity (hexahydrate of magnesium nitrate, ammonium hydroxide, phosphoric
ortho acid, formic acid, monobasic sodium phosphate,
monobasic potassium phosphate, disodium EDTA, citric acid, sodium citrate) and were obtained from Isofar (Rio de Janeiro, Brazil). The ultrapure water used was obtained from Milli-Q Merck Millipore systems (Darmstadt, Germany). All glassware used was previously washed with Extran® alkaline solution 5% and rinsed with ultraclean water.
Instrumentation
The chromatographic system used was liquid chromatography Shimadzu LC 20AT Prominence, model DGU-20A with two high-pressure pumps coupled to a fluorescence detector RF-10AXL, also from Shimadzu, and an injector with 20 µL of the capacity. For control of equipment and data collection, it was used a microcomputer and LCsolution® software (version 1.11 SP1, Shimadzu).
Separation by liquid chromatography was performed using C18 Luna column, Phenomenex (250 × 4.6 mm, 5 µm particles), mobile phase MeOH/phosphate buffer
(NaHPO4.H2O to 0.04 mL min-1, pH 3 with H3PO4 85%)
ratio 30:70 (v/v), isocratic elution, flow rate 1 mL min-1
and detection by fluorescence at wavelengths of 280 and 450 nm for emission and excitation, respectively.
Study area and sample preparation
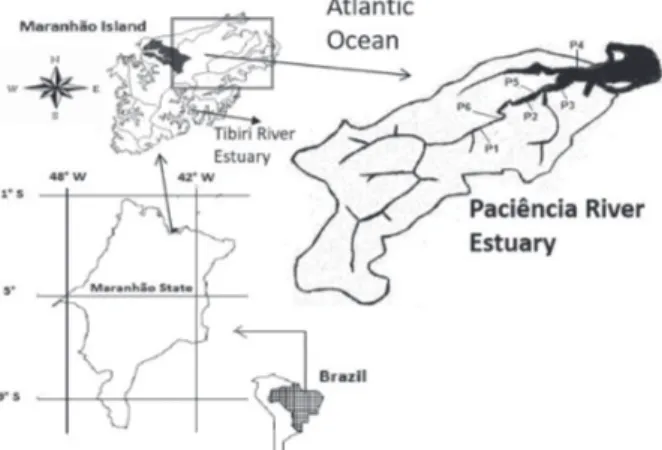
The Paciência River has 32 km of extension, with
estuarine characteristics. On its drainage basin, 171.74 km2,
there are four cities: São Luís, Paço do Lumiar, Raposa and São José de Ribamar. It is characterized by leisure activities, fishing and agriculture. It receives in its waters expressive raw sewage discharge from a population estimated at more
than 250,000 inhabitants.37 The mangrove sediment from
Tibiri River used in this work is the same one studied
previously by Silva et al.38 This sediment was used in this
work as blank matrix (Figure 1).
Mangrove sediment samples were collected from Paciência River during one field campaign carried out in August 2014 at six points (P1 [2° 29’ 07.10’’ S; 44° 08’ 100.70’’ O], P2 [2° 28’ 32.02’’ S; 44° 07’ 33.54’’ O], P3 [2° 28’ 03.53’’ S; 44° 06’ 40.89’’ O], P4 [2° 27’ 53.62’’ S; 44° 06’ 15.40’’ O], P5 [2° 28’ 25.47’’ S; 44° 07’ 10.37’’ O] and P6 [2° 29’ 00.33’’ S; 44° 07’ 57.25’’ O]) along the Paciência River during low tide development, spaced approximately 200 m between sampling. The collection was performed using a stainless steel Van Veen dredge type sampler, specific for sediments. The sediment samples were collected from the surface. Once collected, the samples were packed in polyethylene bags, identified and transported under cooling to the laboratory. In the
laboratory, the samples were frozen at −18 °C, freeze-dried,
sieved (sieve 0.63 µm) and stored in amber bottles at
−18 °C until the time of analysis.26 The properties of
mangrove sediments for the six sampling points were analyzed using the previously described methods and the resulting average values are: pH = 6.92 ± 0.43; redox
potential (Eh) = −126.50 ± 16.68 mV; exchange cation
capacity (CTC) = 20.90 ± 2.31 (cmol kg-1); organic matter
(MO) = 12.92 ± 1.02%, silt + clay = 99%.38
Optimization of extraction conditions
Ultrasound-assisted extraction (UAE)
Different experimental conditions in the literature were adapted and tested in order to optimize the simultaneous extraction of the three antibiotics (CIP, LEV and NOR) from the mangrove sediment, as shown in Table 2.
For each method, sediment samples (1 g each) were weighed in triplicate in Falcon tubes, and spiked with 200 µL of the mixture of three individual standard solutions
(CIP, LEV and NOR), each one of them at 1.0 mg L-1
and then kept in the dark at 4 °C overnight for complete solvent evaporation. After following the steps outlined in Table 2 for each method, the extracts of the samples were centrifuged at 3000 rpm at 25 °C and the supernatants obtained combined and transferred to amber bottle before making the SPE purification step.
Solid phase extraction
Extracts of the sediment samples were cleaned and enriched using Oasis HLB cartridges (60 mg, 3 mL, Waters, USA). The following protocol was the same for all extraction methods: prior to SFE, the combined extracts were diluted to 100 mL with Milli-Q water. The Oasis HLB cartridges were preconditioned with 5 mL of dichloromethane, 5 mL of methanol and 10 mL of Milli-Q water adjusted to pH 3
with H3PO4, successively. Afterward, the aqueous extracts
of sediments were performed at a flow rate of 1 mL min-1.
After all extracts were completely percolated each cartridge was washed with 10 mL of Milli-Q water solution with
H3PO4 adjusted to pH 3 with 5% methanol (v/v) to remove
impurities weakly bound to the sorbent. Before elution, the cartridges were dried for 30 minutes under a vacuum. The elution of the antibiotic from the cartridges was performed with 6 mL of 2% methanolic solution of formic acid (v/v). The eluate containing the target compounds were evaporated to dryness under gentle argon stream, and redissolved with 1 mL mobile phase followed by filtration through 0.22 µm nylon membrane (Chrom Tech, Minnesota, USA) to remove particles prior analysis by HPLC-FD.
Method validation
In order to assess the selectivity, linearity, accuracy, precision, limit of detection and limit of quantification,
sediment samples from the Tibiri River were selected. These sediment samples are similar to Paciência River, but the presence of CIP, LEV and NOR compounds was not identified. The samples were collected in November 2011 in the sediment surface in the estuary of the Tibiri River, located in Maranhão Island, Brazil (Figure 1). The sediment (pH = 7.9; organic matter: 16.3%; silt + clay: 99%) was
characterized in a previous study.38
Results and Discussion
Optimization of the extraction procedure
The extraction of the fluoroquinolones from solid environmental samples requires the application of exhaustive extraction conditions to isolate the analyte of interest, since these compounds bind firmly to this
matrix.10,14,34 Therefore, it was decided to optimize an
extraction technique assisted by ultrasound (UAE) to isolate the CIP, LEV and NOR fluoroquinolones from the mangrove sediment samples. This procedure is easy-to-use (sonication followed by centrifugation), the equipments are easily found in the laboratory, low-cost and uses little solvent extractor.35,39-41
Since the fluoroquinolones compounds have amphoteric properties due to the presence of two ionizable functional groups with environmental relevance in its structure,
the carboxylic group (pKa ca. 6) and the amino group
(pKa ca. 8), different mixtures of extracting solutions in
acid and basic pH were evaluated to find an appropriate solution for the extraction of the three antibiotics in sediment samples. The results of these experiments are
summarized in Figure 2.23,42
In the most studies involving the extraction of fluoroquinolone antibiotics in solid environmental matrices the extraction of these compounds improves when
Table 2. Protocols for extraction using ultrasound-assisted extraction (UAE) of fluoroquinolones antibiotics from sediment
Methoda Extraction solution Reference
1 0.2 M phosphate buffer solution (pH 3.0) and methanol 50:50 (v/v)
26
2 0.2 M citrate buffer solution (pH 4.0) and acetonitrile 50:50 (v/v)
34
3 aqueous solution of Mg(NO3)2 to 29%
(m/v) (pH 8.1) adjusted with ammonia 4% (v/v)
35
aVolume extraction (10 mL), extraction cycles (3) and extraction time
(15 min) are the same for all methods.
performed at pH acids.12,26,29,33,34,43 In the present study, it
can be concluded that, in general, fluoroquinolones were best extracted from the sediment by use of basic solution
(method 3).35 Importantly, there is no consensus in the
literature about the best pH for the extraction of sediment samples of antibiotics. This shows that the matrix effects are very important in the choice of extraction method. Hence, this method has merit in proposing a way to deal with a complex matrix such as mangrove sediment.
In basic conditions used in method 3 (pH 8.1), the LEV has more anionic than zwitterion specie concentration, pH = 6.77 (Table 1). For CIP (pH = 7.5) and NOR (pH = 7.34) compounds the zwitterions specie is predominant. The cationic species (amino group protonation) are absent for all fluoroquiolones.
The extraction of fluoroquinolones from sediment can
be separated into two aspects: (i) octanol-water partition
coefficient (Kow)and (ii) distribution coefficient (Kd)
(Table 1). First, since the fluoroquinolones have relatively
low Kow, due to the presence of many ionizable functional
groups, they are preferably solubilized in polar solvents. This could explain the fact observed in extraction process
number 3, which uses only aqueous solution.14,23,42 Second,
since Kow is low, weak sorption would be expected in
sediment and soil, but it does not occur. Studies have shown that once present in the sediment, the antibiotics (CIP, LEV and NOR) have low vertical mobility because of their high potential for adsorption. Fluoroquinolones compounds have
Kd ranging from 794 to 19,952 (L kg-1).14,18,44 This wide
range of Kd values reflects that sorption mechanisms are
diverse and vary according to the sediment properties, for
example, the presence of mineral and organic matter.45,46
Minerals play a key role in the adsorption of fluoroquinolones in soil and sediments. Clay mineral and Al and Fe oxides are important components in the soil and sediments. Different adsorption mechanisms such as cation exchange (cation exchange capacity), hydrogen bond and complexation (metal oxide content), are involved in adsorption of fluoroquinolones onto soil and sediments. Liu et al.47 observed that in modified clay mineral the
LEV showed better adsorption in zwitterion with pH ca. 7, decreasing for pH lower or higher than 7. In another work,
Yang et al.26 concluded that ciprofloxacin showed better
adsorption on clay mineral (montmorillonite, rectorite, and illite) in acid pH. In this condition, the cationic species of ciprofloxacin is adsorbed by cation exchange mechanism.
In this way, Vasudevan et al.,15 by investigating different
types of soils, also concluded that the cationic specie of ciprofloxacin was the most important specie in sorption mechanism in acid pH and the sorption rates varied in function of soil type. In addition, the authors suggested that
organic matter is not fundamental for ciprofloxacin sorption
regarding hydrophobic properties (Kow). The Koc (partition
coefficient between organic carbon and water) seems
unsuitable to express sorption capacity in soil and sediment.14
Also in acid pH, according to Leal et al.,48 by investigating
Brazilian soils, fluoroquinolones demonstrated very high
sorption (Kd≥ 544 L kg-1). Based on what was mentioned
above, three explanations for the method 3 performance were
hypothesized: (i) the anionic specie can suffer repulsion of
the negative sites in the surface of the sediment particles
formed by clay minerals and iron oxides among others; (ii) in
association with the previous mechanism, antibiotic/Mg2+
complex contributes to increasing the fluoroquinolones
solubility;10,35,49,50 and (iii) on the other hand, the acid pH
of methods 1 and 2 favors the cation exchange sorption mechanism, since the mangrove sediment has high exchange
cation capacity (CTC = 20.90 cmol kg-1).
Analytical performance
In order to ensure the reliability of analytical results, some figures of merit were determined to guarantee the successful use of the proposed methodology, in addition to finding errors of the analytical protocols.
Selectivity
The selectivity of the method was evaluated by comparing the chromatograms obtained from the extract of Tibiri River sediment without and with fluoroquinolones fortification to verify the presence of some interfering matrix in the same analyte retention times.
By overlaying the chromatograms it was observed that there were no interferences (Figure 3). The presence of co-extractives from the matrix did not elute at the same retention times of the analytes under current study. This fact is of great importance because the mangrove sediments are rich in organic matter due to the high biological productivity. This organic matter undergoes microbial degradation, generating numerous organic and inorganic compounds. For example, in the study of sediment samples from the Pearl River in China, the authors could not determine some antibiotics (CIP and NOR) due to serious interference of
compounds present in the extracts evaluated.26
Linearity
For the study of linearity method, it was prepared an external calibration curve using six concentration levels set
in triplicates (20, 25, 50, 100, 200 and 500 µg L-1, prepared
The values were used to obtain the linear regression equation by the least square method. The linear correlation
coefficient (r2) was used to verify the adequacy of the
representation of the mathematical model expressed by the
linear equation. An r2 value greater than 0.995 was required
to consider the satisfactory linear model.51-54
The analytical curves for the three fluoroquinolones (Table 3) were shown to be linear over the studied range,
with satisfactory r2 since they achieved values greater
than 0.995 for CIP, LEV and NOR, i.e., very strong correlation.52,55,56
Limits of detection and quantification
The limits of detection (LOD) and quantification (LOQ) were established from the blank matrix (Tibiri River sediment). The standard deviation was obtained by injecting at least ten times the sample blank for subsequent application of formula LOD (3s/S) and LOQ (10s/S), where s is the standard deviation of the background and S is the
slope of the analytical curve.51-53
LOD and LOQ were considered satisfactory (Table 4), mainly for the purpose of the method, which evaluates antibiotic residues in complex matrices such as mangrove sediment. The present method is in the range of detection limits found in the literature. For example, Li et al.,57 by using
liquid chromatography with mass detector (LC-MS/MS),
obtained an LOD ranging from 0.08 to 2.86 µg kg-1.
Recovery and matrix effect
Accuracy was assessed from recovery tests using the extraction method proposed in this study for the three fluoroquinolones. To assess the recovery, sediment samples from Tibiri River were spiked with a mixture of three individual standard solutions (CIP, LEV and NOR) in three
fortification levels: 20, 200 and 500 µg kg-1. At least five
analyses were performed for each of the three fortification levels studied. The recovery percentage was calculated from the ratio between the average concentration determined experimentally and the corresponding theoretical concentration. The average percentage recoveries of the analytes are given in Table 5.
Figure 3. HPLC-FD chromatograms obtained from extraction methods: blank matrix using method 3 (yellow) and fortified matrices with CIP, LEV and NOR at 200 µg kg-1 using methods 1 (red), 2 (green) and 3 (blue), respectively.
Table 3. Quantitative parameters for typical analytical curves obtained by HPLC-FD for compounds LEV, NOR and CIP
Analyte Retention
time / min Linear equation r2
LEV 10.4 y = 0.451x + 0.443 0.9997
NOR 12.3 y = 3.163x – 4.771 0.9999
CIP 13.6 y = 2.655x – 2.198 0.9999
r2: correlation coefficient.
Table 4. LOD and LOQ values for the three fluoroquinolones Analyte LOD / (µg kg-1) LOQ / (µg kg-1)
CIP 1.10 3.68
LEV 3.33 11.10
NOR 0.26 0.86
LOD: limit of detection; LOQ: limit of quantification.
Table 5. Antibiotics recovery in mangrove sediments and relative standard
deviation of the compounds
Analyte Spiked level / (µg kg-1) Recovery / % RSD / %
CIP
20 76.67 8.79
200 73.73 4.26
500 76.43 3.60
LEV
20 85.73 2.51
200 88.85 3.96
500 87.64 6.57
NOR
20 81.52 4.71
200 82.85 2.62
500 85.63 6.49
The method was considered to be accurate since it included recoveries in the range between 70 and 120% established in the literature for residue analysis and their values repeated in all samples indicating the consistency
of the method.51-53
The presence of matrix effect in a complex sample such as the mangrove sediment is not uncommon. In order to evaluate the matrix effect on signal intensity, this work used
the equation described by Vieno et al.58 The following set of
solutions was prepared: (i) standard solution of CIP, LEV
and NOR at 200 µg kg-1; (ii) un-spiked sediment extracts
and (iii) spiked sediment extracts with CIP, LEV and NOR
at 200 µg kg-1. According to the equation, the matrix effects
values obtained were CIP (0.27), LEV (0.14) and NOR (0.18). Although undesirable, these values do not represent a limiting aspect for method validation.
Precision
Precision was determined by repeatability levels from the analysis of three concentration levels (20, 200 and
500 µg kg-1) with at least five tests each on the same day and
same experimental conditions. The results were expressed by estimating the relative standard deviation (RSD) shown in Table 5 and were considered adequate, as they are within
the recommended limits for residue analysis (≤ 20%),
indicating that the developed method is precise within the
concentration range and the adopted conditions.52
Analysis of environmental sediment samples
The sediment is an environmental compartment that has a great ability to accumulate different types of pollutants, including pharmaceuticals, which makes it a true witness to the environmental impacts suffered by aquatic ecosystems
over time.59 The concentrations of the antibiotics in the
sediment samples collected in the Paciência River are shown in Table 6.
Among the antibiotics investigated in this study, only CIP was detected in three of the six sites evaluated. One
possible explanation to CIP contamination derives from the fact that the Paciência River basin undergoes a great domestic sewage discharge of the untreated effluents from urban activities spread in this basin (São Luís, Raposa,
Paço do Lumiar and São José de Ribamar cities).37
Literature data related to sediment contamination by fluoroquinolones report the same route of entry,
and similar contamination levels or even higher.26,28,36,60
Table 7 shows a comparison among the concentrations of fluoroquinolones found in other sediments around the world.
The results presented in Table 7 are the first dates about fluoroquinolones in mangrove sediment in Maranhão Island. The relevance becomes greater due to the almost non-existent treatment of sewage in this area. The mangrove is an ecosystem that occur in large areas of Brazil and around the planet. Therefore, the present study offers a relevant alternative for antibiotics investigation in sediment, since the literature on this problem is scarce.
Conclusions
The methodology based on aqueous ultrasound assisted extraction (UAE) and solid phase extraction (SPE) followed by the HPLC-FD was optimized for the analysis of the fluoroquinolones antibiotics in mangrove sediment.
Table 6. Concentrations of the compounds investigated in the Paciência River sediments
Site CIP ± SD /
(µg kg-1)
LEV ± SD / (µg kg-1)
NOR ± SD / (µg kg-1)
1 60.08 ± 5.56 n.d n.d
2 n.d n.d n.d
3 70.45 ± 4.81 n.d n.d
4 n.d n.d n.d
5 56.55 ± 4.45 n.d n.d
6 n.d n.d n.d
SD: standard deviation; n.d: not detected.
Table 7. Fluoroquinolone concentrations found in other regions
Region Fluoroquinolone Concentration Reference
Rio Pearl, China CIP
NOR
9.02-197 µg kg-1
19.2-1120 µg kg-1
26
Valência, Spain CIP 5.95 ng g-1 28
Yellow, Hai and Liao Rivers, China CIP NOR
32.8; 1290; 28.7 ng g-1
141; 5770; 176 ng g-1
36
Baiyangdian Lake, China CIP
NOR
2.49 µg kg-1
267 µg kg-1
60
The UAE-SPE-HPLC-FD methodology provides a low
detection limit (1.10, 3.33 and 0.26 µg kg-1 to CIP, LEV and
NOR, respectively) and high linear coefficient (r2 > 0.999).
Additionally, in real mangrove sediment samples, the recovery (%) ranged from 73.73 to 88.85%, proving that the complexity of the matrix does not interfere significantly in the extraction efficiency. UAE-SPE-HPLC-FD is relatively simple, precise and accurate. Also, the methodology has expressive clean up capacity.
The method was applied in the determination of pharmaceuticals in mangrove sediment of the Paciência River, Maranhão Island, Brazil, where only the CIP antibiotic was found in three of six samples analyzed, with
values ranging from 56.55-70.45 µg kg-1.
Acknowledgments
This work was supported by the National Council of Technological and Scientific Development (CNPq) and the Foundation of Research and Scientific and Technological Development of Maranhão (FAPEMA). The authors thank the Chemistry Department of the Federal Institute of Education Science and Technology of Maranhão (Monte Castelo Campus, IFMA) and Federal University of Maranhão (UFMA).
References
1. Guimarães, D. O.; Momesso, L. S.; Pupo, M. T.; Quim. Nova
2010, 33, 667.
2. Santos, P. N.; Maciel, M. I. S.; Lavorante, B. R. B. O.; Medeiros, M. M.; Albuquerque Júnior, E. C.; Quim. Nova 2011, 34, 1265.
3. Kemper, N.; Ecol. Indic. 2008, 8, 1.
4. Sapkota, A.; Sapkota, A. R.; Kucharski, M.; Burke, J.; McKenzie, S.; Walker, P.; Lawrence, R.; Environ. Int. 2008,
34, 1215.
5. Kümmerer, K.; Annu. Rev. Environ. Resour. 2010, 35, 57. 6. Morris, D.; Harris, S.; Morris, C.; Commins, E.; Cormican, M.;
Hospital Effluent: Impact on the Microbial Environment and
Risk to Human Health; Research Report No. 162
(2008-EH-MS-6-S3); EPA: Wexford, Ireland, 2016.
7. Bila, D. M.; Dezotti, M.; Quim. Nova 2003, 26, 523.
8. Silva, C. G. A.; Collins, C. H.; Quim. Nova 2011, 34, 665. 9. https://amr-review.org/sites/default/files/Antimicrobials%20
in%20agriculture%20and%20the%20environment%20-%20 Reducing%20unnecessary%20use%20and%20waste.pdf, accessed on April 22, 2017.
10. Leal, R. M.; Figueira, R. F.; Tornisielo, V. L.; Regitano, J. B.;
Sci. Total Environ. 2012, 432, 344.
11. Tadeo, J. L.; Sánchez-Brunete, C.; Albero, B.; García-Valcárcel, A. I.; Pérez, R. A.; Cent. Eur. J. Chem.2012, 10, 480.
12. Dorival-García, N.; Zafra-Gómez, A.; Camino-Sánchez, F. J.; Navalón, A.; Vílchez, J. L.; Talanta 2013, 106, 104.
13. Salvia, M. V.; Fieu, M.; Vulliet, E.; Appl. Environ. Soil Sci.
2015, 2015, 1.
14. Tolls, J.; Environ. Sci. Technol. 2001, 35, 3397.
15. Vasudevan, D.; Bruland, G. L.; Torrance, B. S.; Upchurch, V. G.; MacKay, A.; Geoderma 2009, 151, 68.
16. Van Doorslaer, X.; Dewulf, J.; Van Langenhove, H.; Demeestere, K.; Sci. Total Environ. 2014, 500-501, 250.
17. Ahmad, I.; Bano, R.; Sheraz, M. A.; Ahmed, S.; Mirza, T.; Ansari, S. A.; Acta Pharm. 2013, 63, 223.
18. Sarisaltik, D.; Teksin, Z. F.; FABAD J. Pharm. Sci. 2007, 32,
197.
19. Uivarosi, V.; Molecules 2013, 18, 11153.
20. da Silva, J. M. B.; Hollenbach, C. B.; Arq. Inst. Biol.2010, 77, 363.
21. http://www.moreirajr.com.br/revistas.asp?fase=r003&id_ materia=2632, accessed on April 22, 2017.
22. Speltini, A.; Sturini, M.; Maraschi, F.; Profumo, A.; Albini, A.;
Trends Anal. Chem. 2011, 30, 1337.
23. Picó, Y.; Andreu, V.; Anal. Bioanal. Chem. 2007, 387, 1287.
24. Li, Y.; Li, Q.; Zhou, K.; Sun, X.; Zhao, L.; Zhang, Y.;
Chemosphere 2016, 147, 25.
25. Seifrtová, M.; Pena, A.; Lino, C. M.; Solich, P.; Anal. Bioanal. Chem. 2008, 391, 799.
26. Yang, J. F.; Ying, G. G.; Zhao, J. L.; Tao, R.; Su, H. C.; Chen, F.; Sci. Total Environ.2010, 408, 3424.
27. Runnqvist, H.; Bak, S. A.; Hansen, M.; Styrishave, B.; Halling-Sørensen, B.; Björklund, E.; J. Chromatogr. A 2010, 1217,
2447.
28. Vazquez-Roig, P.; Segarra, R.; Blasco, C.; Andreu, V.; Picó, Y.;
J. Chromatogr. A 2010, 1217, 2471.
29. Golet, E. M.; Strehler, A.; Alder, A. C.; Giger, W.; Anal. Chem.
2002, 74, 5455.
30. Christian, T.; Schneider, R. J.; Färber, H. A.; Skutlarek, D.; Meyer, M. T.; Goldbach, H. E.; Acta Hydrochim. Hydrobiol.
2003, 31, 36.
31. Sturini, M.; Speltini, A.; Maraschi, F.; Rivagli, E.; Profumo, A.; J. Chromatogr. A 2010, 1217, 7316.
32. Hu, X.; Zhou, Q.; Chromatographia 2011, 74, 489. 33. Martínez-Carballo, E.; González-Barreiro, C.; Scharf, S.; Gans,
O.; Environ. Pollut.2007, 148, 570.
34. Uslu, M. Ö.; Yediler, A.; Balcıoğlu, I. A.; Schulte-Hostede, S.;
Water, Air, Soil Pollut. 2008, 1901, 55.
35. Turiel, E.; Martín-Esteban, A.; Tadeo, J. L.; Anal. Chim. Acta
2006, 562, 30.
36. Zhou, L. J.; Ying, G. G.; Zhao, J. L.; Yang, J. F.; Wang, L.; Yang, B.; Liu, S.; Environ. Pollut. 2011, 159, 1877.
38. Silva, G. S.; Nascimento, A. S.; Sousa, E. R.; Marques, E. P.; Marques, A. L. B.; Corrêa, L. B.; Silva, G. S.; Rev. Virtual Quim.
2014, 6, 323.
39. Blackwell, P. A.; Holten Lützhøft, H. C.; Ma, H. P.; Halling-Sørensen, B.; Boxall, A. B.; Kay, P.; Talanta 2004, 64, 1058. 40. Tadeo, J. L.; Sánchez-Brunete, C.; Albero, B.; García-Valcárcel,
A. I.; J. Chromatogr. A 2010, 1217, 2415.
41. Carvalho, P. N.; Pirra, A.; Basto, M. C. P.; Almeida, C. M. R.;
Anal. Methods 2013, 5, 6503.
42. Leyva, S.; Leyva, E.; Bol. Soc. Quím. Mex. 2008, 2, 1.
43. Kim, S. C.; Carlson, K.; Anal. Bioanal. Chem. 2007, 387, 1301. 44. Kümmerer, K.; Chemosphere 2009, 75, 417.
45. Thiele-Bruhn, S.; J. Plant Nutr. Soil Sci. 2003, 166, 145. 46. Pereira, L. A.; Jardim, I. C. S. F.; Fostier, A. H.; Rath, S.; Quim.
Nova 2012, 35, 159.
47. Liu, X.; Liu, Y.; Xu, J. R.; Ren, K. J.; Meng, X. Z.; Environ. Pollut. 2016, 219, 916.
48. Leal, R. M. P.; Alleoni, L. R. F.; Tornisielo, V. L.; Regitano, J. B.; Chemosphere 2013, 92, 979.
49. Park, H. R.; Chung, K. Y.; Lee, H. C.; Lee, J. K.; Bark, K. M.;
Bull. Korean Chem. Soc. 2000, 21, 849.
50. Park, H. R.; Kim, T. H.; Bark, K. M.; Eur. J. Med. Chem. 2002,
37, 443.
51. Amarante Júnior, O. P.; Caldas, E. P. A.; Brito, N. M.; Santos, T. C. R.; Vale, M. L. B. F.; Cad. Pesqui. 2001, 12, 116.
52. Brito, N. M.; Amarante Júnior, O. P.; Polese, L.; Ribeiro, M. L.; Pesticidas: R. Ecotox. Meio Ambiente 2003, 13, 129.
53. Ribani, M.; Bottoli, C. B. G.; Collins, C. H.; Jardim, I. C. S. F.; Melo, L. F. C.; Quim. Nova 2004, 27, 771.
54. Lanças, F. M.; Cromatografia Liquida Moderna (HPLC/CLAE), 1a ed.; Átomo:São Paulo, Brazil,2009.
55. http://redsang.ial.sp.gov.br/site/docs_leis/vm/vm1.pdf, accessed in December 2015.
56. http://www.inmetro.gov.br/Sidoq/Arquivos/Cgcre/DOQ/DOQ-Cgcre-8_04.pdf, accessed in June 2017.
57. Li, Y.; Li, Q.; Zhou, K.; Sun, X. L.; Zhao, L. R.; Zhang, Y. B.;
Chemosphere2016, 147, 25.
58. Vieno, N. M.; Tuhkanen, T.; Kronberg, L.; J. Chromatogr. A
2006, 1134, 101.
59. Pereira, J. C.; Guimarães-Silva, A. K.; Nalini Júnior, H. A.; Pacheco-Silva, E.; Lena, J. C.; Quim. Nova 2007, 30, 1249.
60. Wenhui, L.; Yali, S.; Lihong, G.; Jiemin, L.; Yaqi, C.;
Chemosphere 2012, 89, 1307.
Submitted: February 23, 2017
Published online: June 13, 2017