Iranian Journal of Basic Medical Sciences
ijbms.mums.ac.ir
Evaluation, prediction and optimization the
ultrasound-assisted
extraction
method
using
response
surface
methodology: antioxidant and biological properties of
Stachys
parviflora
L.
Davoud Salar Bashi
1, 2, Samaneh Attaran Dowom
3, Bibi Sedigheh Fazly Bazzaz
4,
Farhad
Khanzadeh
5*, Vahid Soheili
6, Ali Mohammadpour
71 School of Medicine, Gonabad University of Medical Sciences, Gonabad, Iran
2 Ferdowsi University of Mashhad, International campus, Department of Food Science and Technology, Mashhad, Iran 3 Department of Biology, Faculty of Sciences, Ferdowsi University of Mashhad, Mashhad, Iran
4 School of Pharmacy; Biotechnology Research Center; Mashhad University of Medical Sciences, Mashhad, Iran 5 Department of Food Science and Technology, Sabzevar Branch, Islamic Azad University, Sabzevar, Iran
6 Department of Food and Drug Control, School of Pharmacy, Mashhad University of Medical Sciences, Mashhad, Iran 7 Medical Surgical Nursing, Social Determinant of Health Center, Gonabad University of Medical Sciences, Gonabad, Iran
A R T I C L E I N F O A B S T R A C T
Article type: Original article
Objective(s):To optimize the extraction method using response surface methodology, extract the phenolic compounds, and identify the antioxidant and biological properties of Stachys parviflora L. extracts.
Materials and Methods: Maceration and ultrasound-assisted extraction (UAE) (4, 7, 10 min treatment time, 40, 70, 100 % high-intensity and 60, 80, 100 % (v v-1) methanol purity) were applied to obtain the extracts. SEM was conducted to provide the microstructure of the extracted plant. MICs (colorimetric assay), MFCs (colony diameter), total phenolic content, total flavonoid content, radical scavenging capacity and extraction efficiency were determined. HPLC analysis was applied to measure the existent phenolic compounds.
Results:A quadratic model (4 min treatment time, 74.5 % high-intensity and 74.2 % solvent purity) was suggested as the best (TPC: 20.89 mg GAE g-1 d.m., TFC: 6.22 mg QEs g-1 d.m., DPPH IC50: 21.86 µg ml-1 and EE: 113.65 mg g-1 d.m.) UAE extraction model. The optimized UAE extract was generally more effective against Gram-positive microorganisms (MIC: 10-20; MBC: 10-40 (mg ml-1)) than Gram-negative ones (MIC: 40; MBC: >40 (mg ml-1)). Moreover, it (MGI: 2.32-100 %) revealed more anti-mold activity than maceration (MGI: <28.77 %). Explosive disruption of the cell walls, therefore, enhanced extraction yield by acoustic cavitation, was elucidated using SEM. Caffeic acid, tannic acid, quercetin, trans ferulic acid and rosmarinic acid were determined as the phenolic compounds in the optimized extract.
Conclusion:RSM optimization was successfully applied for UAE from S. parviflora. The considerable antioxidant and biological properties were attributed to the phenolic compounds.
Article history: Received: Oct 2, 2015 Accepted: Mar 3, 2016
Keywords: Antioxidant Biological properties HPLC
RSM
Stachys parviflora L., Ultrasound-assisted extraction
►
Please cite this article as:Salar Bashi D, Attaran Dowom S, Fazly Bazzaz BS, Khanzadeh F, Soheili V, Mohammadpour A. Evaluation, prediction and optimization the ultrasound-assisted extraction method using response surface methodology: antioxidant and biological properties of Stachys Parviflora L. Iran J Basic Med Sci 2016; 19:529-541.
Introduction
Stachysis a large genus of perennial and annual herb that belongs to Lamiaceae (previously called Labiateae). This genus, which comprises about 300 species, is one of the largest genera of Lamiaceae. Thirty-five species and four hybrids of the genus are found in Iran, including Stachys species (which is widely distributed throughout Iran, India and Turkey) (1). Phenolic compounds are major plant secondary metabolites with several beneficial properties (2, 3). Thus extraction methods to isolate these components with high output are of industrial
importance. Many beneficial effects have been reported for Stachys species, such as anti-nephritic, inflammatory, radical-scavenging and anti-microbial properties (4, 5). Stachys parviflora L.,
commonly known as Baggibuti , is found in
temperate and tropical regions of Pakistan and in Iran, and is common across South Khorasan province, Iran (1).
Different extraction techniques have been employed to identify the phenolic compounds in plant materials. Conventionally, phenolic compounds are extracted by refluxing, boiling, heating and
Salar Bashi et al UAE optimization for S. Parviflora L.
Soxhlet techniques. However, these methods have disadvantages such as loss of phenols due to oxidation, hydrolysis and ionization during extraction, as well as long extraction time (6). Furthermore, due to the high sensitivity of these compounds to light, heat and oxygen, efficient extraction methods are necessary to maintain the stability of phenolic compounds (7).
Advanced extraction methods have recently been developed and adopted for extracting bioactive compounds from natural plants. These include microwave-assisted extraction (MAE), ultrasound-assisted extraction (UAE), accelerated solvent extraction (ASE) and supercritical fluid extraction (SFE). In comparison with conventional extraction, UAE is an economical, simple, efficient and environmentally friendly alternative. The mechanism of UAE is attributed to cavitation efficacy, which can result in the disruption of cell walls, reductions of particle size and enhancement of mass transfer across cell membranes (6).
Response surface methodology (RSM) is a combination of statistical and mathematical techniques (8) for identifying the effect of individual process variables and efficiently locating optimum process-variable combinations for a multivariable system. As it requires less experimental data, it offers economy of experimental points (9). This method is widely employed for optimizing the extraction of phenolic compounds from different plant materials (6, 10-13). However, a survey of the literature has
shown that extraction of phenolic compounds for
S. parviflora has not yet been optimized using RSM.
On the other hand, Ahmad et al (2008) have
isolated the flavonoid from S. parviflora (14).
However, to our knowledge, no study has been
conducted on this species in terms of its antioxidant and antimicrobial properties, whereas, some researchers have examined the antioxidant activity of other species of this plant growing in Iran (15-18). Nevertheless, other aspects such as essential-oil composition of the aerial parts of S. parviflora have already been studied (19).
The present study aims to optimize the phenolic compounds' extraction factors (solvent
purity, ultrasound intensity and extraction time) for S. parviflora using RSM and employing a central composite rotatable design (CCDR) in
conjunction with UAE. Scanning electron
microscopy (SEM) is employed to examine the results of each extraction method. This study also aims to determine the antioxidant activity, antibacterial activity and antifungal properties of
S. parviflora.
Materials and Methods
Plant materialsThe aerial parts (the flowering stage) of S.
parviflora were collected from South Khorasan
Province (East of Iran) during April 2011. A
voucher specimen (12579) was deposited in the Herbarium of the School of Pharmacy, Mashhad
University of Medical Sciences, Mashhad, Iran.The
plant was dried while shaded at ambient temperature and subsequently ground using an
electrical mill. Particle size less than 9 m
distributor (sieve No.:100) were used to classify the powder (20). The powder was stored in a dim, cool and low-humid place until the test day.
Chemicals
Caffeic acid, tannic acid, rosmarinic acid, trans
ferulic, 2,2-diphenyl-1-picrylhydrazil (DPPH), catechin, quercetin, gentamicin and amikacin were Sigma-Aldrich Co. (St. Louis, MO, USA) products. Folin-Ciocalteu reagent, sodium carbonate, sodium nitrite, aluminium chloride, sodium hydroxide, gallic acid, BHA and methanol from Merck Co
(Darmstadt, Germany), tryptone soy agar,
tryptone soy broth, Mueller Hinton broth, Sabouraud dextrose agar from HiMedia (Mumbai, India) and gold conjugates from Agar scientific (Essex, UK), were used in the experiments. Redistilled water was used throughout the experiments.
Extraction of plant materials
Both maceration and ultrasound-assisted extraction (UAE) methods were employed to obtain the extracts. Extraction efficiency was determined gravimetrically.
Maceration extraction
A previously described extraction method was applied to extract the plant powder (21).
Ultrasound-assisted extraction (UAE)
UAE was applied (200 W, 26 kHz) at 40, 70 and 100 % high-intensity (UP 200Ht, Dr Hielscher GmbH, Germany). Acoustic power and intensity of ultrasonic vibrations were 0.171402 W and 21.8346 Wcm-2 corresponding to 100 %
high-intensity. The extraction was performed in accordance with the previously described method (21), at temperature of 35 °C, natural pH (20),
using methanol (60, 80 and 100 % (v v-1)) as
solvent for 4, 7 and 10 min time intervals. Insoluble part was removed from solvent by a
centrifuge (model 2-16 KC, Sigma,
Laborzentrigugen GmbH, Germany) then the solvent was evaporated at 35 °C using a rotary
evaporator. Nonetheless, the soluble part was dried using a vacuum oven at 35 °C and 60 cm-Hg.
The dried samples were stored in desiccator up to the test time.
Total phenolic content (TPC)
expressed as mg gallic acid equivalent per g dried extract. All tests were carried out in triplicate.
Total flavonoid content (TFC)
TFC was measured using an aluminium chloride (AlCl3)-based colorimetric assay which
has been described before (20). Total flavonoid contents were expressed as mg quercetin equivalent (QEs) per g dried extract. All tests were carried out in triplicate.
DPPH assay
In order to determine the radical scavenging capacity (RSC) of the extracts, a slightly modified method was employed (14, 20). Briefly, methanol was added to 100-1000 µl of the extracts (0.020 g 100 ml-1) to reach a total volume of 4 ml.
Subsequently, DPPH solution (1000 µl, 0.012 g 100 ml-1) was added and stirred for 30 sec. The
solution was then kept in dim light for 115 min.
Thereafter, the absorbance at max=517 nm was
checked using a spectrophotometer (Shimadzu UV-VIS 1601, Japan). Pure methanol was used as blank and BHA was considered as positive control. DPPH scavenging activity was calculated according to the following formula:
%DPPH scavenging = [Ablank-AsampleAblank-1]×100 Eq. (A.1)
where, Ablank is the absorbance of the control
(containing all reagents except the test compound), and Asample is the absorbance of the
sample.
Extract concentration providing 50% DPPH inhibition (IC50) was calculated by plotting the
inhibition (%) against the extract concentrations (22). All tests were carried out in triplicate.
Analysis of phenolic acids
The HPLC apparatus (Model k-1500, Knauer, Germany) equipped with a HPLC pump system (model k_1001, knauer, Germany), a C18: EC 25014_6 column (250× 4.6 mm, 5 µm; Nucleodur; 100_5 C18c) and an UV detector (model k_2600, Knauer, Germany) at the wavelength of 254 and 320 nm was employed. The flow rate and the injection volume were 1.0 ml min-1 and 20 µl
respectively; where a gradient solvent system consists of methanol-water was used. Briefly, a gradient elution was started with 100 % water and reached to 100% methanol within 20 min, while it continued for 5 min at 100% methanol. The condition was returned to 100% water during another 5 min. The internal standards include caffeic acid, tannic acid, rosmarinic acid, quercetin and trans ferulic were utilized (10, 50, 100 and 200 µg ml-1).
Antimicrobial activities Antibacterial activity
Four microorganisms including Escherichia coli
(PTCC 1330, Persian Type Culture Collection or ATTC 8739, American Type Culture Collection) and Pseudomonas aeruginosa (PTCC 1074 or ATCC 9027) as Gram-negative bacteria as well as
Staphylococcus aureus (PTCC 1337, 1112 or ATCC
29737, 6538 respectively), Staphylococcus
epidermidis (PTCC 1114 or ATCC 12228 and ATCC
700576) as Gram-positive bacteria were
employed. In vitro antibacterial screening tests were performed using 24 hr growth culture at 37 °C on tryptone soy agar. Briefly, a suspension of each bacterium was prepared in sterile normal saline from its fresh colonies. The turbidity was compared to 0.5 Mcfarland as standard to achieve 108 CFU ml-1. Then the suspension was adjusted to
106 CFU ml-1 by 10-fold serial dilution method. In
order to achieve and examine the desired concentrations, 200 mg dried extracts were dissolved in 250 µl methanol as co-solvent. The volume was adjusted to 5 ml by Muller Hinton broth to achieve final concentration (40 mg ml-1).
Other concentrations were prepared according to the two-fold serial dilution method. Wells of a cell culture plate (96-well) were filled with both
l of each concentration and l of 6 CFU
ml-1 cell suspension.
Culture media as negative control (to show the sterility of media), gentamicin g ml-1) and
amikacin g ml-1) as positive control for bacteria
also were used. Thereafter, the plates were incubated (24 hr, 37 °C). The microorganisms were assessed by 2,3,5-triphenyltetrazolium chloride (TTC) assay as a colorimetric indicator for bacterial
growth. )n this method, l TTC mg ml-1) was
added to each well and plates were incubated once again at 37 °C for almost 1 hr. The minimum inhibitory concentration (MIC) (defined as the lowest concentration of the extracts against the test microorganisms) were determined as inhibition the color change to pink-red. This change indicates the bacterial growth (20). Minimum bactericidal concentration (MBC) (defined as the lowest concentration with no bacterial growth) was determined by inoculation of 50 µl of each well on the surface of the plates containing Mueller-Hinton agar. The plates were incubated at 37 °C for 24 hr.
Anti-mold activity
Salar Bashi et al UAE optimization for S. Parviflora L.
cut off from the periphery of 7-day-old-cultures and inoculated upside-down on the agar surface of the medium. Inoculated medium without the extracts was also used as positive control. Inoculated Petri dishes were incubated at 25±1 °C and the observations were recorded on the 7th day.
Mycelia growth inhibition (MGI) was calculated as follows:
MGI=(dc-dt) dc-1×100 Eq. (A.2)
Where, dc is fungal colony diameter in the positive control, dt is fungal colony diameter in the plates containing different concentrations of each extract.
The minimum fungicidal concentration (MFC) was established by re-inoculated the inhibited fungal discs at MIC on SDA medium. After 7 days of inoculation, all observations were documented. Fungal growth indicated a fungistatic nature, while its absence connoted fungicidal action of the extract.
Scanning electron microscopy (SEM)
SEM was applied to determine the
microstructure for untreated, classical extraction and optimized UAE treated samples. A Philips XL 30 scanning electron microscope (Eindhoven, The Netherlands) under high vacuum condition, an accelerating voltage of 20.0 kV and a working distance of 8-9 mm (24) was used. Each sample was fixed on the specimen holder with aluminum tape and then sputtered with gold in a sputter coater (BAL-TEC SCD 005, Balzers, Switzerland).
Experimental design
The highest yield of bioactive phenolic compounds from S. parviflora was obtained using central composite design (CCD) in order to optimize the extraction conditions. Three independent variables (time (X1, min), ultrasound
intensity (X2, %) and purity of the solvent (X3, %)),
six central points, eight factorial points and another six axis points at a distance of ±1.682 from the center were considered to generate CCD using Design Expert statistical package (version 9.0.2.0; Stat-Ease Inc., Minneapolis, MN, USA). This experiment, lead to 20 sets of run. To avoid the degradation of temperature-sensitive compounds, the samples were kept at room temperature. Therefore, the effect of temperature was not considered in this study. Dependent responses were TPC, TFC, DPPH IC50 and extract efficiency
(EE).
The variables were coded according to Eq. (A.3).
xi=(Xi−X0) ΔX-1 Eq. (A.3)
where, xi is the coded value of the variable, Xi is the
actual value for the independent variable, X0 is the
actual value of Xi at the center point and ΔXi is the
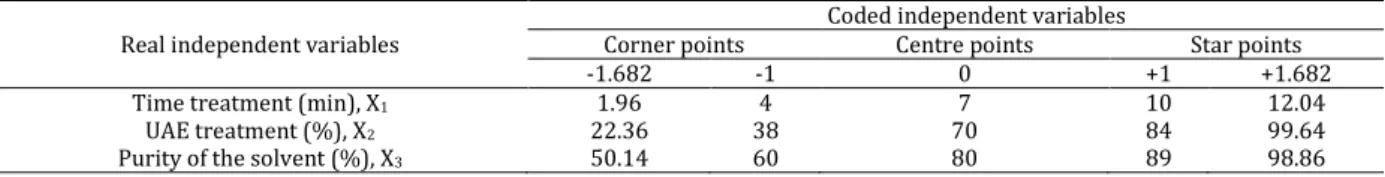
step change value. The independent variables in coded and natural values are tabulated in Table 1.
To predict the optimal point, the following equation as a second-order polynomial model was used.
Eq. (A.4)
Where, β0, βi, βii, and βij are the regression
coefficients for intercept, linear, quadratic, and interaction terms, respectively while Xi and Xj are
the independent variables. The larger R2
(goodness-of-fit) and smaller P-value, the more significant corresponding coefficient (25).
Correlation between the response and
independent variables could be found out from 3D response surface and 2D contour plots, which are simultaneously representing the interaction of three factors on the responses and finding the location of optimum experimental variables (26). Statistical significance of the coefficients in the regression equation was checked by analysis of variance (ANOVA). The fitness of the polynomial model equation to the responses was evaluated by the coefficient of R2 as well as the lack of fit, using
F-test. For this study, 20 treatments were prepared based on the CCD, with three independent variables at five levels for each variable (Table 2).
Results
Model fittingThe most frequently used model, which was implemented for the optimization in this study, is an empirical second-order polynomial model. The accuracy of the generated model was assessed by analysis of variance (ANOVA), R2 and lack of fit.
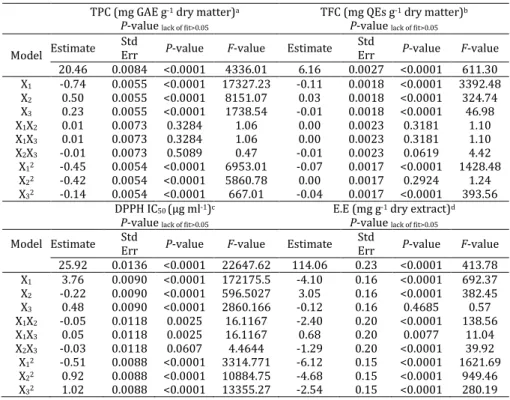
The ANOVA results in Table 3 suggest that the model has very high F-values and very low P-value (0.0001) for all four responses.
In addition, high R2 values and insignificance lack
of fit (P>0.05) indicate that the implementation of the quadratic model was highly significant for the obtained data. This suggests that the model can describe the relationship between the extraction conditions and responses during UAE. The fitted quadratic models for TPC, TFC, DPPH IC50 and EE all
Table 1. Independent variables and coded values employed for optimization of the extraction procedure
Real independent variables
Coded independent variables
Corner points Centre points Star points
-1.682 -1 0 +1 +1.682
Time treatment (min), X1 1.96 4 7 10 12.04
UAE treatment (%), X2 22.36 38 70 84 99.64
Purity of the solvent (%), X3 50.14 60 80 89 98.86
Table 2. Coded central composite design (CCD) matrices with observed and predicted values for dependent responses of total
phenolic content (TPC), total flavonoid content (TFC), inhibition capacity (IC50) and extraction efficiency (EE)
Test runs
Independent factors levels Dependent responses
Time treatment (min)
UAE treatment
(%)
Purity of the solvent (%)
TPC (mg GAE g-1
dry matter)
TFC (mg QEs g-1
dry matter)
DPPH IC50
(µg ml-1)
EE (mg g-1 dry
extract)
13 4.00 (-1) 38.00 (-1) 60.00 (-1) 19.45 6.15 23.28 99.32
6 4.00 (-1) 38.00 (-1) 89.00 (1) 19.94 6.12 24.25 99.48
3 4.00 (-1) 84.00 (1) 60.00 (-1) 20.48 6.23 22.99 112.64
15 4.00 (-1) 84.00 (1) 89.00 (1) 20.92 6.19 23.80 108.73
17 10.00 (1) 38.00 (-1) 60.00 (-1) 17.95 5.93 30.85 93.62
10 10.00 (1) 38.00 (-1) 89.00 (1) 18.44 5.92 31.95 97.56
5 10.00 (1) 84.00 (1) 60.00 (-1) 18.98 6.01 30.31 98.43
1 10.00 (1) 84.00 (1) 89.00 (1) 19.48 5.97 31.37 96.15
12 12.05 (+1.682) 61.00 (0) 74.50 (0) 17.96 5.80 30.78 90.34
7 1.95 (-1.682) 61.00 (0) 74.50 (0) 20.40 6.15 18.20 103.17
4 7.00 (0) (+1.682) 99.68 74.50 (0) 20.12 6.22 28.18 105.46
9 7.00 (0) 22.32 (-1.682) 74.50 (0) 18.45 6.12 28.87 96.16
11 7.00 (0) 61.00 (0) 98.89 (+1.682) 20.44 6.05 29.60 106.99
2 7.00 (0) 61.00 (0) 50.11 (-1.682) 19.69 6.08 28.01 106.70
8 7.00 (0) 61.00 (0) 74.50 (0) 20.47 6.16 25.96 113.32
14 7.00 (0) 61.00 (0) 74.50 (0) 20.47 6.17 25.94 114.12
16 7.00 (0) 61.00 (0) 74.50 (0) 20.48 6.17 25.90 113.98
18 7.00 (0) 61.00 (0) 74.50 (0) 20.48 6.16 25.92 114.45
19 7.00 (0) 61.00 (0) 74.50 (0) 20.44 6.16 25.90 114.14
20 7.00 (0) 61.00 (0) 74.50 (0) 20.45 6.17 25.90 114.34
All the observed and predicted values were identical. TPC ranged from 17.95 to 20.92 mg GAE g-1
dry matter; TFC from 5.80 to 6.23 mg QEs g-1 dry
matter; extraction efficiency from 90.34 to 114.45 mg g-1 dry extract; and radical scavenging capacity
from 18.20 to 311.95 µg ml-1 (Table 2).
The results of the 20 runs related to CCD, which include the coded matrices for design conditions, observed responses and corresponding predicted values, are tabulated in Table 2.
Optimization of process variables and verification of the model
The reliability of the fitted model for all four responses (based on the ANOVA results) was supported as the maximal points of the responses were inside the experimental region. As per the response surface plots, a simultaneous optimization for all responses was carried out. The optimal conditions were treatment time of 4 min, 74.5%
high-intensity and solvent purity of 74.2%, which give estimated maximal values of 20.89 mg GAE g-1
dry matter for TPC, 6.22 mg QEs g-1 dry matter for
TFC, 21.86 µg ml-1 for DPPH IC50 and 113.65 mg g-1
dry extract for EE.
SEM
Figure 2 shows the microstructure of the optimized UAE extract (4 min treatment time, 74.5 % high-intensity and 74.2% solvent purity), maceration extract and untreated sample of S. parviflora. SEM images clearly show that the untreated sample contained no fractured cells (Figure 2 (a)), whereas both treated samples underwent fractural changes. These changes were more obvious for optimized UAE extraction than the sample obtained using the maceration method (Figure 2 (b, c)): the maceration sample contained shrunken cells, while the cells in the optimized UAE sample were shredded.
YTPC= 20.46 – 0.74x1 + 0.5x2 + 0.23x3– 0.45x12– 0.42x22– 0.14x32 Eq. (A.5)
YTFC= 6.16 – 0.11x1 + 0.033x2– 0.012x3– 0.067x12– 0.035x32 Eq. (A.6)
YDPPH = 25.92 + 3.76x1 – 0.22x2 +0.48x3 – 0.51x12 + 0.92x22 + 1.02x32 – 0.047x1.x2 +
0.048x1.x3 Eq. (A.7)
Salar Bashi et al UAE optimization for S. Parviflora L.
Table 3. Analysis of variance of the quadratic regression model fitted for total phenolic content (TPC), total flavonoid content (TFC),
inhibition capacity (IC50) and extraction efficiency (EE)
TPC (mg GAE g-1 dry matter)a P-value lack of fit>0.05
TFC (mg QEs g-1 dry matter)b P-value lack of fit>0.05
Model Estimate Std
Err P-value F-value Estimate Std
Err P-value F-value 20.46 0.0084 <0.0001 4336.01 6.16 0.0027 <0.0001 611.30 X1 -0.74 0.0055 <0.0001 17327.23 -0.11 0.0018 <0.0001 3392.48
X2 0.50 0.0055 <0.0001 8151.07 0.03 0.0018 <0.0001 324.74
X3 0.23 0.0055 <0.0001 1738.54 -0.01 0.0018 <0.0001 46.98
X1X2 0.01 0.0073 0.3284 1.06 0.00 0.0023 0.3181 1.10
X1X3 0.01 0.0073 0.3284 1.06 0.00 0.0023 0.3181 1.10
X2X3 -0.01 0.0073 0.5089 0.47 -0.01 0.0023 0.0619 4.42
X12 -0.45 0.0054 <0.0001 6953.01 -0.07 0.0017 <0.0001 1428.48
X22 -0.42 0.0054 <0.0001 5860.78 0.00 0.0017 0.2924 1.24
X32 -0.14 0.0054 <0.0001 667.01 -0.04 0.0017 <0.0001 393.56
DPPH IC50 (µg ml-1)c P-value lack of fit>0.05
E.E (mg g-1 dry extract)d P-value lack of fit>0.05
Model Estimate Std
Err P-value F-value Estimate Std
Err P-value F-value 25.92 0.0136 <0.0001 22647.62 114.06 0.23 <0.0001 413.78 X1 3.76 0.0090 <0.0001 172175.5 -4.10 0.16 <0.0001 692.37
X2 -0.22 0.0090 <0.0001 596.5027 3.05 0.16 <0.0001 382.45
X3 0.48 0.0090 <0.0001 2860.166 -0.12 0.16 0.4685 0.57
X1X2 -0.05 0.0118 0.0025 16.1167 -2.40 0.20 <0.0001 138.56
X1X3 0.05 0.0118 0.0025 16.1167 0.68 0.20 0.0077 11.04
X2X3 -0.03 0.0118 0.0607 4.4644 -1.29 0.20 <0.0001 39.92
X12 -0.51 0.0088 <0.0001 3314.771 -6.12 0.15 <0.0001 1621.69
X22 0.92 0.0088 <0.0001 10884.75 -4.68 0.15 <0.0001 949.46
X32 1.02 0.0088 <0.0001 13355.27 -2.54 0.15 <0.0001 280.19
a The R square obtained in fit statistics for the response model of total phenolic content (TPC) was 0.9997 b The R square obtained in fit statistics for the response model of total flavonoid content (TFC) was 0.9982 c The R square obtained in fit statistics for the response model of 2,2-diphenyl-1-picrylhydrazil (DPPH) was 1.000 d The R square obtained in fit statistics for the response model of extraction efficiency (EE) was 0.9973
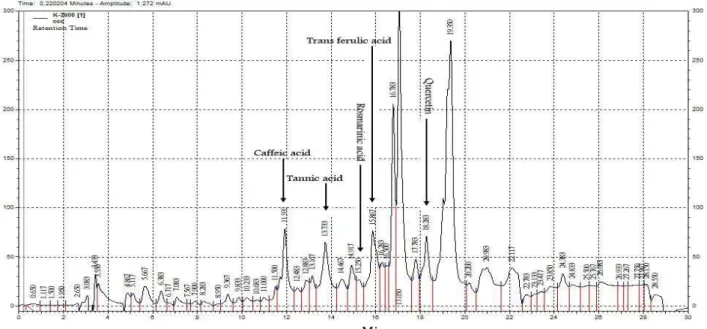
HPLC
The only study indicating the HPLC analysis of
S. parviflora was reported by Acikara et al (2013) (27). They revealed that chlorogenic acid was just the phenolic acid in both the aerial part (444.77±2.78 µg mg-1) and root (509.96±6.64 µg mg-1). The HPLC
chromatogram from S. parviflora optimized UAE extract indicated that this extract abound caffeic acid (3.88 mg g-1) followed by tannic acid (1.24 mg g-1),
quercetin (0.49 mg g-1), trans ferulic acid (0.39 mg
g-1) and rosmarinic acid (trace) (Figure 3).
Figure 2. Scanning electron micrographs (SEM) from Stachys parviflora surface, (a) untreated sample, (b) maceration, (c) optimized
mAU
Min
Figure 3. High performance liquid chromatography (HPLC) chromatogram from Stachys parviflora optimized UAEextract
Antimicrobial activities Antibacterial activity
Many studies have demonstrated the
antibacterial activity of the Stachys genus (28- 30). To our knowledge however, there is no study focusing on the antibacterial activity of S. parviflora specifically. Skaltsa et al (2003) declared that sesquiterpene hydrocarbons were the main group of constituents of all studied Stachys species from Greece responsible for antimicrobial activity. They meanwhile found out a better activity there is in studied species against bacteria than fungi (31). Likewise, the composition and antibacterial activity of Stachys inflata Benth. essential oil were determined by Ebrahimabadi
et al (2010) (30 . Linalool, α-terpineol, spathulenol and (2E)-hexenal (in descending order of quantity) were determined as the major components while the two earlier compounds appeared as the most considerable antibacterial
agent. Investigation of the essential oil composition of S. parviflora (5) revealed that three oxygenated sesquiterpenes – muurolol <epi-α> 2, 33), caryophyllene <(z)->and caryophyllene oxide (34)
– have antimicrobial activities. Phytochemical analyses of Stachys species have confirmed the occurrence of diterpenes, phenyl ethanoid glycosides, flavonoids and saponines. Flavonoids are a class of phytochemicals that may be responsible for antimicrobial activity (29, 35, 36).
Table 4 shows the MICs and MBCs of S. parviflora on the tested bacterial strains. The MIC values range from 10 to 40 mg ml-1 for both
maceration and optimized UAE, while the MBC values range from 20 to >40 mg ml-1 for
maceration and 10 to >40 mg ml-1 for optimized
UAE. The findings indicate that S. parviflora was generally more effective against Gram-positive microorganisms than Gram-negative ones.
Table 4. Antibacterial activity of Stachys parviflora extracts
a MIC:Minimum inhibitory concentration,bMBC: Minimum bactericidal concentration
Microorganism
MICa (mg ml-1) extract MBCb (mg ml-1) extract
Positive control MIC (mg ml-1)
Maceration Optimized
UAE Maceration Optimized UAE
Escherichia coli
(PTCC 1330 or ATCC 8739) 20 40 >40 >40 Gentamicin 0.005
Staphylococcus aureus
(PTCC 1112 or ATCC 6538) 20 20 >40 40
Amikacin 0.004
Staphylococcus aureus
(PTCC 1337 or ATCC 29737) 10 20 40 20
Staphylococcus epidermidis
(PTCC 1114 or ATCC 12228) 20 10 20 10
Staphylococcus epidermidis
(ATCC 700576) 20 10 40 10
Pseudomonas aeruginosa
Salarbashi et al UAE optimization for S. Parviflora L.
Figure 4. Anti-mold activity of Stachys parviflora . blank (A), extract (optimized UAE) concentration less than minimum inhibitory
concentration (MIC) (B), extract (optimized UAE) concentration at minimum inhibitory concentration (MIC) (C)
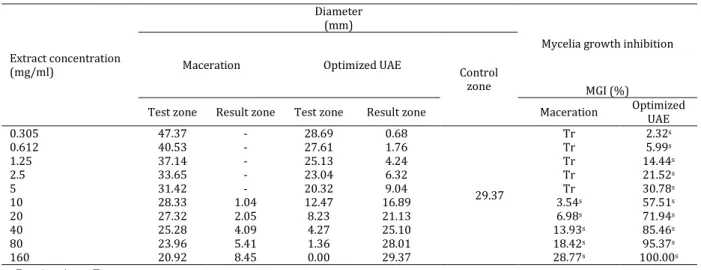
Anti-mold activity
Table 5 summarizes the anti-mold activity of both maceration and optimized UAE extracts. According to the results, the maceration extract at the extract concentration of 0.305 to 5 mg ml-1, did
not inhibit the mycelia growth, whereas optimized UAE extract showed an MGI% of 2.32 to 30.78 at the same range of concentration. It also showed that the MGI% of maceration extract was only 28.77%, in contrast to 100% for optimized UAE at the final concentration of 160 mg ml-1. These
results indicate that optimized UAE extract of S. parviflora possesses the stronger activity against
P. expansum than maceration extract.
Discussion
The effects of three independent process variables – treatment time (X1: 1.95-12.04 min),
UAE treatment (X2: 22.31-99.68%) and purity of
the solvent (X3: 50.11-98.88%) – were
investigated during ultrasonic extraction of S. parviflora aerial parts. A quadratic model has
been suggested as the best model for all independent variables (Table 6).
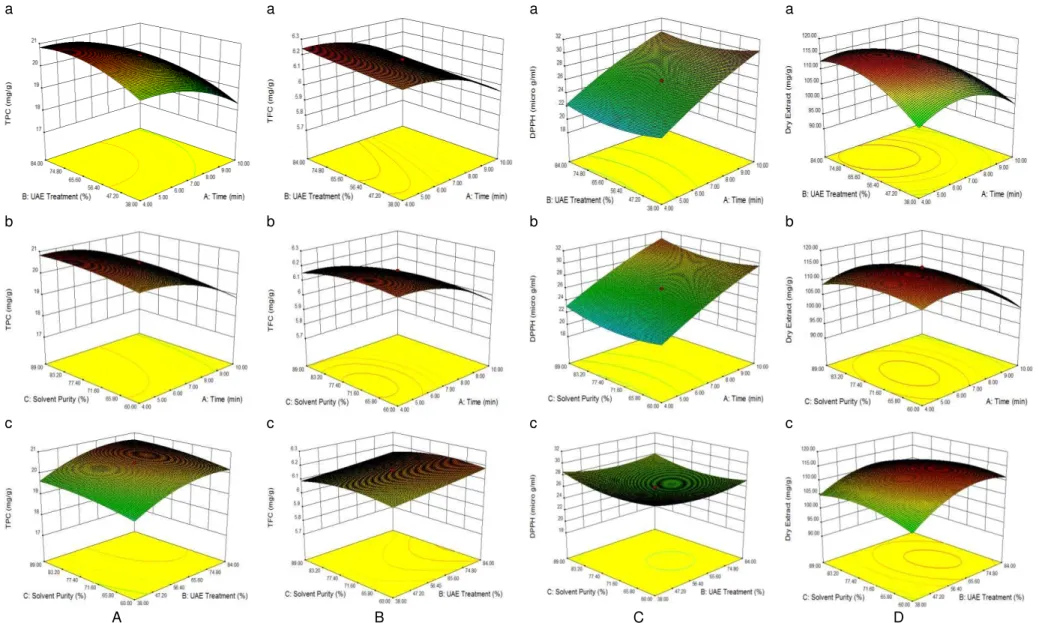
Figure 1 represents the relationship between each pair of process variables in each response. As shown in Table 3, the term of the extraction time (X1) was the most effective factor on TPC,
while the quadratic term of the solvent purity (X3)
had the smallest effect. The results indicated that none of the interactions of the treatment time and UAE (X2), the treatment time and the solvent
purity and UAE and the solvent purity had a significant effect on TPC (P>0.05). The fitness of the predicted TPC model was defined by its R2
(0.9997) and insignificant lack of fit (0.2093), as shown in Table 3. Figure 1A shows the 3D response surface and the contour plots.
The most effective factor in extracting TFC was extraction time (X1), followed by its quadratic term, while the interaction terms between all parameters – the extraction time, UAE (X2) and the solvent purity (X3) – as well as the quadratic term of UAE had no significant effect on TFC (P>0.05). Furthermore, the solvent purity had the lowest effect on the flavonoid compounds extracted from S. parviflora (Table 3). The coefficient of R2 of the predicted TFC model was 0.9982, and P-value for the lack of fit was 0.2294.
Three-dimensional surface and contour plots shown in Figure 1B were generated according to Eq. A.6. Figure 1B (a) shows the effects of for TPC as a function of the process variables. TPC was greatly increased with an increase in the extraction time, reaching to 20.47 mg GAE g-1 dry matter, with the lowest residual value at t = 7 min. Thereafter, it started to decrease until the 10 th
min. Figure 1A (b) confirms that the solvent purity
Table 5. Mycelial growth inhibition (MGI) of different Stachys parviflora extracts against Penicillium expansum
Extract concentration (mg/ml)
Diameter (mm)
Mycelia growth inhibition
Maceration Optimized UAE
Control
zone MGI (%)
Test zone Result zone Test zone Result zone Maceration Optimized
UAE
0.305 47.37 - 28.69 0.68
29.37
Tr 2.32s
0.612 40.53 - 27.61 1.76 Tr 5.99s
1.25 37.14 - 25.13 4.24 Tr 14.44s
2.5 33.65 - 23.04 6.32 Tr 21.52s
5 31.42 - 20.32 9.04 Tr 30.78s
10 28.33 1.04 12.47 16.89 3.54s 57.51s
20 27.32 2.05 8.23 21.13 6.98s 71.94s
40 25.28 4.09 4.27 25.10 13.93s 85.46s
80 23.96 5.41 1.36 28.01 18.42s 95.37s
160 20.92 8.45 0.00 29.37 28.77s 100.00s
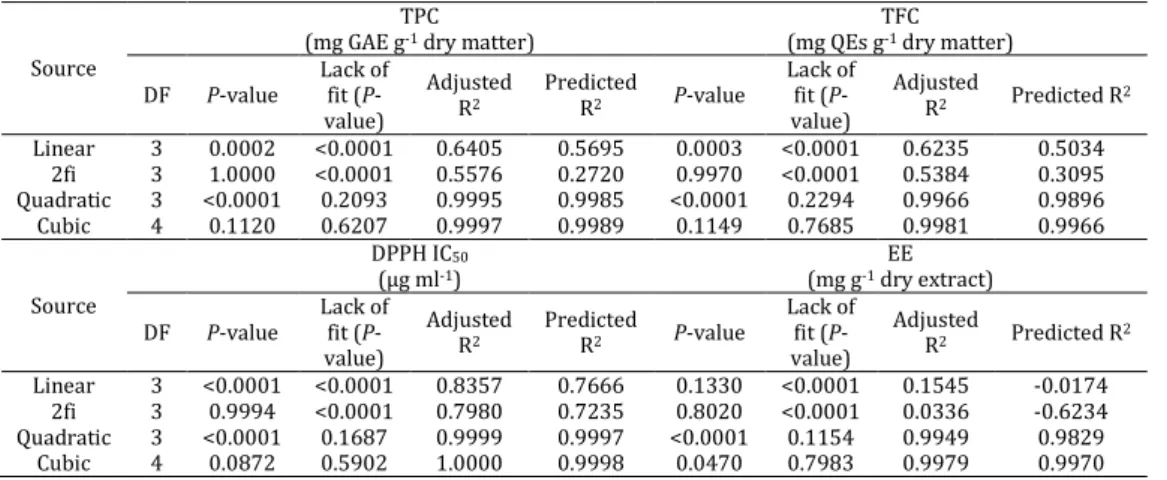
Table 6. Choosing the best model for total phenolic content (TPC), total flavonoid content (TFC), inhibition capacity (IC50) and
extraction efficiency (EE)
Source
TPC (mg GAE g-1 dry matter)
TFC (mg QEs g-1 dry matter)
DF P-value
Lack of fit (P -value)
Adjusted R2
Predicted
R2 P-value
Lack of fit (P -value)
Adjusted
R2 Predicted R2
Linear 3 0.0002 <0.0001 0.6405 0.5695 0.0003 <0.0001 0.6235 0.5034 2fi 3 1.0000 <0.0001 0.5576 0.2720 0.9970 <0.0001 0.5384 0.3095 Quadratic 3 <0.0001 0.2093 0.9995 0.9985 <0.0001 0.2294 0.9966 0.9896 Cubic 4 0.1120 0.6207 0.9997 0.9989 0.1149 0.7685 0.9981 0.9966 Source
DPPH IC50
(µg ml-1)
EE (mg g-1 dry extract)
DF P-value
Lack of fit (P -value)
Adjusted R2
Predicted
R2 P-value
Lack of fit (P -value)
Adjusted
R2 Predicted R2
Linear 3 <0.0001 <0.0001 0.8357 0.7666 0.1330 <0.0001 0.1545 -0.0174 2fi 3 0.9994 <0.0001 0.7980 0.7235 0.8020 <0.0001 0.0336 -0.6234 Quadratic 3 <0.0001 0.1687 0.9999 0.9997 <0.0001 0.1154 0.9949 0.9829 Cubic 4 0.0872 0.5902 1.0000 0.9998 0.0470 0.7983 0.9979 0.9970
had no significant effect on TPC. The linear increase in TPC shown in Figure 1A (c) also demonstrates that UAE had a significant effect on TPC, whereas the effect of the solvent purity was not significant.
The most effective factor in extracting TFC was extraction time (X1), followed by its quadratic term, while the interaction terms between all parameters – the extraction time, UAE (X2) and the solvent purity (X3) – as well as the quadratic term of UAE had no significant effect on TFC (P>0.05). Furthermore, the solvent purity had the lowest effect on the flavonoid compounds extracted from S. parviflora (Table 3). The coefficient of R2 of the predicted TFC model was 0.9982, and P-value for the lack of fit was 0.2294. Three-dimensional surface and contour plots shown in Figure 1B were generated according to Eq. A.6. Figure 1B (a) shows the effects of the extraction time and UAE on TFC.
Total flavonoid content of the extracts increased linearly with UAE, whereas the extraction time had the opposite effect on TFC; and the highest TFC was obtained at t = 4 min. A similar linear decrease in TFC was observed as shown in Figure 1B (b), where TFC decreased with the solvent purity. Figure 1B (c) shows the positive effects of UAE and negative effects of the solvent purity on TFC.
Except the interaction effect of the solvent purity (X3) and UAE (X2) (P>0.05), all other
parameters effected the free radical scavenging activity of the extracts significantly (P<0.05).
Meanwhile, the interaction effects of the extraction time (X1) and the solvent purity as well
as the extraction time and UAE were in the lowest when compared with other parameters. R2 for
DPPH scavenging capacity was obtained 1.000,
and the lack of fit was not significant (0.1687). As shown in Figurs 1C (a) and (b), which give 3D response surface and contour plot for DPPH
scavenging capacity, the extraction time had a
linear effect on IC50, and an increase in
IC50 corresponded to lower antiradical scavenging
capacity. These figures also showed the opposite effect of UAE and linear effect of the solvent purity on DPPH scavenging capacity. Furthermore, as Figure 1C (c) shows, the interaction effects of the solvent purity and UAE were extremely low and insignificant (P>0.05).
All terms except the linear term of the solvent purity (X3) (P>0.05) had significant effect on EE
(P<0.05). Nevertheless, the quadratic term of the extraction time (X1) was the most significant
parameter among all effective parameters. R2 was
0.9973 for EE, and the lack of fit was insignificant (0.1154). Figure 1D (a), 3D response surface and contour plot for extraction efficiency, shows the linear effect of the extraction time, which led to a reduction in EE; the highest extraction yield was obtained at t = 7 min. In contrast, the linear effect of UAE positively agreed with an increase in EE; the highest extraction yield occurred at 61% high-intensity. However, as Figure 1D (b) shows, the solvent purity had an insignificant effect on EE; the interaction effects of the solvent purity and UAE are shown in Figure 1D (c). To determine the accuracy and reliability of the predicted model, also inspection the deviation between actual and estimated values under the suggested optimal conditions, a verification experiment was carried out. The test was conducted at a treatment time of 4 min, 74% high-intensity and the solvent purity of 74%. The observed response values were 20.888 mg GAE g-1 dry matter for TPC, 6.226 mg
QEs g-1 dry matter for TFC, IC50 of 21.849 µg ml-1
for DPPH and 113.667 mg g-1 dry extract for EE.
No significant differences were perceived between the observed and estimated values, confirming that the fitted model for each response was valid and reliable for simulating the UAE extraction of
phenolic and flavonoid compounds from
a a a a
b b b b
c c c c
A B C D
Figure 1. Response surface plots and contour plots show the effect of (a) ultrasound-assisted extraction (UAE) and time, (b) time and the purity of the solvent, and (c) UAE and the purity of the solvent on
Based on the SEM images, sonication definitely had an important role in the explosive disruption of the physical structure of vegetal cell walls, and enhanced the extraction yield by the acoustic cavitation (37). Similar results have reported the effect of ultrasonic vibration on the physical structure of Achillea biebersteinii Afan. (21) and
Euonymus alatus (Thunb.) Sieb. (38). The hydration process followed by the swelling process, also mass transfer of the soluble compounds from the plant matrices to the solvent by osmotic and diffusion processes are two stages of the classical extraction process (21). In contrast, the UAE method enhances the swelling and softening process of cell walls via the hydration of pectinous material from the middle lamella. Consequently, it may lead to the breakup of the vegetal tissue during sonication (39) which means, UAE is much faster and more efficient than the classical extraction method. SEM images revealed that the efficiency of UAE for the extraction of phenolic compounds, and
consequently the enhancement of their
antioxidant and antimicrobial activities could reasonably be considered superior to that of the classical extraction method.
As per the microbial tests, S. parviflora extracts was generally more effective against Gram-positive microorganisms than Gram-negative ones. With respect to the antimicrobial properties of phenolics (40, 41) and flavonoids (28), the observations could be partially attributed to the higher phenol and flavonoid content of the obtained extracts. A similar effect of the plant extracts on S. epidermidis and S. aureus, noted by
Salarbashi et al (2014), is also remarkable for
S. parviflora optimized UAE extract (21).
High anti-mold activity of the optimized UAE extract could be attributed to its higher extraction efficiency when compared with the maceration. A number of studies were conducted to prove the lower MIC of different bacteria is related to the higher extraction of phenolic and flavonoid compounds (20, 21, 26). Therefore, the higher MGI% of UAE can be a consequence of higher concentration of these compounds. Hence, at a concentration of 160 mg ml-1, optimized UAE
showed a mold-static effect on P. expansum; in contrast, no moldicide effect on P. expansum was achieved, based on the growing the mold on all discs after incubation for a week.
Conclusion
RSM was successfully optimized the
ultrasound extraction from S. parviflora., as a quadratic model was suggested as the best model for the extraction conditions. The obtained extractswere found to be generally more effective against Gram-positive microorganisms than Gram-negative ones; while they were actively
against P. expansum. Meanwhile, the optimized UAE appeared more active against the test microorganisms than the classical method. SEM micrographs confirmed the efficiency of UAE in the extraction of active components. Caffeic acid was found abundantly than other phenolic acids in the S. parviflora extract and may consider as a responsible antimicrobial agent.
Acknowledgment
The authors would like to express their sincere thanks to Dr Javad Asili & Dr Mehrdad Iranshahi for the partial financial assistance and Dr Ebrahim Shahraeeni for critical reading of this study. The authors acknowledge the Faculty and staff of the Pharmaceutical Research Center, School of
Pharmacy, Mashhad University of Medical Sciences, Mashhad, Iran, for their supports. Special thanks to Dr Akram Taleghani fromChemistry Depart-ment, Birjand University, Birjand, Iran, for HPLC technical supports.
References
1. Rechinger KH. Flora Iranica. No.150; 1982.
2. Said A, Abuotabl EA, Abdel Raoof GF, Huefner
A, Nada SA. Phenolic contents and bioactivities of
pericarp and seeds of Pleiogynium solandri
(Benth.) Engl. (Anacardiaceae). Iran J Basic Med Sci 2015; 18:164-171.
3. Geng-Ruei Chang GR, Chen PL, Hou PH,
Mao FC. Resveratrol protects against diet-induced atherosclerosis by reducing low-density lipoprotein
cholesterol and inhibiting inflammation in
apolipoprotein E-deficient mice. Iran J Basic Med Sci 2015; 18:1063-1071.
4. Laggoune S, Zeghib A, Kabouche A, Kabouche
Z, Maklad YA, Leon F, et al. Components and
antioxidant, anti-inflammatory, anti-ulcer and antinociceptive activities of the endemic species
Stachys mialheside Noé. Arab J Chem 2011; 1-7.
5. Khanavi M, Manayi A, Lotfi M, Abbasi R,
Majdzadeh M, Ostad SN. Investigation of cytotoxic
activity in four Stachys species from Iran. Iran J
Pharm Res 2012; 11:589-593.
6. Wang X, Wu Y, Chen G, Yue W, Liang Q, Wu Q.
Optimisation of ultrasound assisted extraction of
phenolic compounds from sparganii rhizoma with
response surface methodology. Ultrason Sonochem 2012; 20:846-854.
7. Ma Y-Q, Chen J-C, Liu D-H, Ye X-Q.
Simultaneous extraction of phenolic compounds of citrus peel extracts: Effect of ultrasound. Ultrason
Sonochem 2009; 16:57–62.
8. Salar Bashi D, Mortazavi SA, Rezaei K, Rajaei A,
Karimkhani MM. Optimization of ultrasound-assisted extraction of Phenolic Compounds from Yarrow
(Achillea beibrestinii) by Response Surface
Methodology. Food Sci Biotech 2012;21:1005-1011.
9. Nwabueze TU. Basic steps in adapting
response surface methodology as mathematical modeling for bioprocess optimisation in the food
systems. Int J Food Sci Tech 2010; 45:1768–1776.
10.Rodrigues S, Pinto GAS, Fernandes FAN.
Salarbashi et al UAE optimization for S. Parviflora L.
540
compounds from coconut (Cocos nucifera) shell
powder by response surface methodology.
Ultrason Sonochem2008; 15:95–100.
11.Morelli LLL, Prado MA. Extraction
optimization for antioxidant phenolic compounds in red grape jam using ultrasound with a response
surface methodology. Ultrason Sonochem 2012;
19:1144–1149.
12.Muniz-Marquez DB, Martinez-Avila GC,
Wong-Paz JE, Belmares-Cerda R, Rodriguez-Herrera R, Aguilar CN. Ultrasound-assisted extraction of
phenolic compounds from Laurus nobilis L. and
their antioxidant activity. Ultrason Sonochem 2013; 20:1149-1154.
13.Teng H, Choi YH. Analytical Methods,
Optimization of ultrasonic-assisted extraction of
bioactive alkaloid compounds from rhizoma coptidis
(Coptis chinensis Franch.) using response surface
methodology. Food Chem 2014; 142:299–305.
14.Ahmad VU, Arshad S, Bader S, Iqbal S, Khan A,
Suleman Khan S, et al. New terpenoids from
Stachys parviflora Benth. Magn Reson Chem 2008;
46:986-989.
15.Hajdari A, Novak J, Mustafa B, Franz C. Essential
oil composition and antioxidant activity of Stachys
sylvatica L. (Lamiaceae) from different wild
populations in Kosovo. Nat Prod Res 2012; 26:1676–
1681.
16.Lakhal H, Boudiar T, Kabouche A, Laggoune S,
Kabouche Z, Topcu G. Antioxidant Activity and
Flavonoids of Stachys ocymastrum. Chem Nat
Compd 2011;46:964-965.
17.Hashemi Sohi SM, Eghdami A, Sadeghi F.
Antioxidant activity and high performance liquid chromatography analyzation of methanolic and
aqueous extract of Stachys inflata. Org Chem J
2011; 1:36-43.
18.Eghdami A, Sadeghi F, Eradatmand Asli D,
Houshmandfar A. Antioxidant activity of
methanolic and aqueous extract of Stachys Inflate.
Adv. Environ Biol2011; 5:1256-1259.
19.Salar Bashi D, Emami SA, Iranshahy M, Asili J.
Essential Oil Composition of Aerial Parts of
Stachys parviflora L. from Iran. J Ess Oil Bear
Plants2013; 16:261-264.
20.Salar Bashi D, Fazly Bazzaz BS, Sahebkar AH,
Karimkhani MM, Ahmadi A. Investigation of optimal extraction, antioxidant, and antimicrobial
activities of Achillea biebersteinii and A. wilhelmsii.
Pharm Biol 2012b; 50:1168-1176.
21.Salarbashi D, Fazly Bazzaz BS, Karimkhani
MM, Sabeti Noghabi Z, Khanzadeh F, Sahebkar AH. Oil stability index and biological activities of
Achillea biebersteinii and A. wilhelmsii extracts as
influenced by various ultrasound intensities. Ind Crop Prod 2014; 55:163-172.
22.Siger A, Nogala-Kalucka M, Lampart-Szczapa E.
The content and antioxidant activity of phenolic compounds in cold-pressed plant oils. J Food
Lipids 2007; 15:137–149.
23.Patra M, Shahi SK, Midgely G, Dikshit A.
Utilization of essential oil as natural antifungal against nail-infective fungi. Flavour Frag J 2002; 17:91-94.
24.Chemat S, Lagha A, AitAmar HV, Bartels P,
Chemat F. Comparison of conventional and ultrasound-assisted extraction of carvone and
limonene from caraway seeds. Flavour Frag J 2004; 19:188-195.
25.Myers RH, Montgomery DC. Response Surface
Methodology: Process and product optimization
using design experiments, 2nd ed. John Wiley &
Sons, New York, 2002. pp. 235–377.
26.Heydari Majd M, Rajaei A, Salar Bashi D,
Mortazavi SA, Bolourian S. Optimization of
ultrasonic-assisted extraction of phenolic
compounds from bovine pennyroyal
(Phlomidoschema parviflorum) leaves using
response surface methodology. Ind Crop Prod
2014;57:195-202.
27.Acikara OB, Çitoğlu GS, Çoban T.
Phytochemical Screening and Antioxidant
Activities of Selected Scorzonera Species. Turk J Pharm Sci 2013; 10:453-462.
28.Saeedi M, Morteza-Semnani K, Mahdavi MR,
Rahimi F, Antimicrobial studies on extracts of four
species of Stachys. Indian J Pharm Sci 2008;
70:403-406.
29.Dulger G, Aki C. Antimicrobial activity of the
leaves of endemic Stachys pseudopinardii in
Turkey. Trop J Pharm Res 2009; 8:371-375.
30.Ebrahimabadi AH, Ebrahimabadi EH,
Djafari-Bidgoli Z, Jookar Kashi F, Mazoochi A, Batooli H. Composition and antioxidant and antimicrobial
activity of the essential oil and extracts of Stachys
inflata Benth from Iran. Food Chem 2010;
119:452–458.
31.Skaltsa HD, Demetzos C, Lazari D, Sokovic M.
Essential oil analysis and antimicrobial activity of eight Stachys species from Greece. Phytochemistry
2003; 64:743–752.
32.Cuca LE, Bernal FA, Coy CA, Coy ED. Essential
oil composition and antimicrobial activity of fruits
of Iryanthera ulei W. from Colombia. J Chil Chem
Soc2009; 54:363-365.
33.Cheng SS, Wu CL, Chang HT, Kao YT, Chang ST.
Antitermitic and antifungal activities of essential
oil of Calocedrus formosana leaf and its
composition. J Chem Ecol 2004; 30:1957-67.
34.Bougatsos C, Ngassapa O, Runyoro DKB,
Chinou IB. Chemical composition and in vitro
antimicrobial activity of the essential oils of two
Helichrysum species from Tanzania. Z.
Naturforsch. C 2004; 59:368-372.
35.Aljancić I, Vajs V, Menković N, Karadzić I,
Juranić N, Milosavljević S, et al. Flavones and
sesquiterpene lactones from Achillea atrata subsp.
multifida: Antimicrobial activity. J Nat Prod1999;
62:909-11.
36.Cushnie TP, Lamb AJ. Antimicrobial activity of
flavonoids. Int J Antimicrob Agents 2006; 26:343-356.
37.Chen F, Sun Y, Zhao G, Liao X, Hu X, Wu J, et al.
Optimization of ultrasound-assisted extraction of anthocyanins in red raspberries and identification of anthocyanins in extract using high-performance
liquid chromatography–mass spectrometry.
Ultrason. Sonochem 2007; 14:767–778.
38.Yang Y, Zhang F. Ultrasound-assisted
extraction of rutin and quercetin from Euonymus
alatus (Thunb.) Sieb. Ultrason. Sonochem 2008;
15:308–313.
39.Maricela T, Vinatoru M, Paniwnyk L, Mason TJ.
vegetal tissues during solvent extraction. Ultrason. Sonochem 2001; 8:137-142.
40.Sousa A, Ferreira ICFR, Calhelha R, Andrade
PB, Valent P, Seabra R, et al. Phenolics and
antimicrobial activity of traditional stoned table
olives alcaparra . Bioorgan. Med Chem 2006; 14:8533-8538.
41.Pereira JA, Oliveira I, Sousa A, Valento P,
Andrade PB, Ferreira ICFR, et al. Walnut
(Juglans regia L.) leaves: Phenolic compounds,