PaPer
Keywords: “águamel”, honey, chemical characterization, microbiological quality
-HONEY-BASED “áGUA-MEL”
CHEMICAL CHARACTERIZATION
AND MICROBIOLOGICAL qUALITY
M. GRAçA MIGUEL1*, M. DULCE ANTUNES1, SMAIL AAZZA1, JOANA DUARTE2 and M. LEONOR FALEIRO2
1Universidade do Algarve, Faculdade de Ciências e Tecnologia, Edifício 8, Instituto de Biotecnologia e Bioengenharia, Centro de Biotecnologia Vegetal,
Campus de Gambelas, 8005-139 Faro, Portugal
2Universidade do Algarve, Faculdade de Ciências e Tecnologia, Edifício 8, Instituto de Biotecnologia e Bioengenharia, Centro de Biomedicina Molecular e Estrutural,
Campus de Gambelas, 8005-139 Faro, Portugal
*Corresponding author: Tel. +351 289 800900, email: [email protected]
AbStrAct
In Mediterranean countries such as Italy and Portugal an ancient practice among beekepers is the production of a honey-based product that is called “água-mel” (Portuguese designation) or “abbamele” (Italian designation) that have not only food applications but also medicinal purposes. However, the characterization of such foodstuff is completely absent in Portugal. In our study the main goal was to provide the general chemical characterization and the microbiological quality of samples of “água-mel”. the chemical characterization showed a great variability of the ash per-centage (0.167-0.474); electrical conductivity (407-1067 mS/cm); free acidity (33.2-91.2 meq/kg); lactone acidity (14.60-20.50 meq/kg); total acidity (53.7-122.72 meq/kg); glucose (185.57-258.52 g/kg); fructose (218.49-315.36 g/kg); total polyphenols (1780.0-4963.8 mg/kg); flavonoids (188.8-1702.4 mg/kg) and 5-(hydroxymethyl)-2-furaldehyde (HMF) (1812.6-8428.9 mg/kg), depending on the beekeeper and production year. the microbiological quality included the counts of aerobic mesophilic bacteria, yeasts and moulds, Enterobacteriaceae, sulphite-reducing Clostridium spp. and the presence of Salmonella spp. the results showed that from all “água-mel” samples analyzed only one sample was contaminated with Clostridium spp. and aerobic mesophilic bacteria. tak-en together both chemical and microbiological data indicates a safe consumption of “água-mel”.
INtrODUctION
For a long time beekeepers from Portugal, mainly in the South (Algarve and Alentejo re-gions), obtain a honey-based product known as “água-mel”. Such product is obtained according to that already reported for a traditional hon-ey-based Sardinian product called “abbamele” (SPANO et al., 2008) with little differences. For “abbamele”, after the extraction of honey from the honeycombs, the latter are crumbled and dipped into warm water (40ºc). the emerging wax separates and the remaining liquid (water, some honey and pollen) is heat-treated (up to 100ºc) until a brown, honey-like product. In Portugal, honeycombs are also crumbled and dipped into warm water but at 70ºc. the re-maining liquid constituted by washing water, some honey, propolis and pollen is, then, heat-treated until a brown, honey-like product with 70°-77º brix (Fig. 1). this procedure is time-consuming (9-12 hours).
Since ancient times, “água-mel” is used in Por-tugal as sweetener in cakes, tea, and of great im-portance as natural medicine on the alleviation of simple symptoms of upper respiratory tract. More recently, the haute cuisine started to use this product in salads and cakes.
In Portugal no information about the phys-ico-chemical characteristics of “água-mel” exists, in contrast to the Italian “abbamele” which has been under research since a few years ago (SPANO et al., 2008; JErKOVIc´ et
al., 2011). thus, the general characterization of the “água-mel” from the South of Portugal is our main goal.
MAtErIAL AND MEtHODS Samples
Samples of “água-mel” were given by the fol-lowing producers; through the beekeepers As-sociation “Associação dos Apicultores do Su-doeste Alentejano e costa Vicentina” (AASAcV), Portugal:
- 1A/2008: Producer 1A/year of production 2008; - 1A/2010: Producer 1A/year of production 2010; - 1A/2011: Producer 1A/year of production 2011; - 1b/2010: Producer 1b/year of production 2010; - 1b/2011: Producer 1b/year of production 2011; - 1H/2011: Producer 1H/year of production 2011; - 1I/2011: Producer 1I/year of production 2011; - 1M/2011: Producer 1M/year of production 2011; - 2A/2011: Producer 2A/year of production 2011; - 2b/2011: Producer 2b/year of production 2011. Samples were kept at room temperature and flasks were opened at aseptic conditions, in a laminar flow chamber (bIOHAZArD, bio II A, tel-star, Madrid, Spain). For each sample of “água-mel”, the producers provided 3 bottles. For each bottle, 3 determinations were done. thus, data are the mean of 9 determinations (n=9).
Microbiological analysis
to evaluate the microbiological quality of “água-mel”, counts of aerobic mesophilic bac-teria (NP-4405:2002), yeasts and moulds (ISO 21527-2:2008), Enterobacteriaceae (ISO 21528-2:2004) and sulphite-reducing Clostridium spp. (ISO 15213:2003) were determined. culture me-dia were purchased from Oxoid (basingstoke, Hampshire, UK) and biokar (Paris, France). ten gram of “água-mel” samples were transferred to 90 mL of peptone water (Oxoid) and homog-enized. Decimal dilutions were prepared using the same diluent. the detection procedure for
Salmonella spp. was done according to the inter-national standard ISO 6579:2002. the microbi-ological determinations were done in triplicate. Microbial counts were expressed in Log10 cFU/g.
Ash
the samples were submitted to 550°c in an electric furnace (cassel, Portugal) and the resi-due weighed in an analytical balance (Shimad-zu, Aux 220, Philippines), after cooling in a des-iccator, according to the harmonized method for honey developed by the International Honey commission IHc (2002).
Electrical conductivity
Electrical conductivity was measured ac-cording to the International Honey commission IHc (2002) and using a (thermo Electron cor-poration, Orion 3 StAr, USA) conductivity me-ter equipped with a conductivity probe (Orion, 013005MD, USA). the sample solution was pre-pared using MilliQ water (MQ Integral 5, 2rXP-005tO, Portugal). the cell constant value was checked with 0.1 M aqueous solution of Kcl (bHD Prolabo, Leuven, belgium).
Water content
the water content of the samples was deter-mined by measuring the refractive index at 20ºc according to the International Honey commis-sion IHc (2002) for honey. this determination was conducted using an Abbe refractometer (HANNA, HI968601, romania).
pH, free acidity, lactone acidity and total acidity
the measurement of pH and determination of free acidity was performed according to the In-ternational Honey commission IHc (2002), after obtaining a solution of 10 g of sample dissolved in 75 mL of carbon dioxide-free water. the pH was measured using a potentiometer combined with glass electrode (thermo Electron corpora-tion, Orion 3 StAr, USA). After the measure-ment of pH, free acidity was determined by
ti-tration with 0.1 M NaOH (Pronalab, Madalena, Portugal) to pH 8.30 (free acidity). Immediate-ly a volume of 10 mL 0.05 M NaOH was added and, without delay, back-titrated with 0.05 M Hcl (Fisher Scientific UK Ltd, Loughborough, UK) to pH 8.30 (lactone acidity).
HMF content
the HMF concentration was determined ac-cording to the harmonized method for honey. One gram of “água-mel” samples was diluted up to 50 mL with distilled water, filtered on 0.45 µm filter and immediately injected in a HPLc (Hi-tachi, Lachrom Elite, Japan) equipped with a Diode Array Detector 2455), Autosampler (L-2200) and Pump (2100/2130). the HPLc column was a Merck KGaA, Lichrosorb rP-18, 10 µm, Hibar 250-4. the HPLc conditions were the fol-lowing: isocratic mobile phase, 90% water and 10% methanol HPLc grade (Labscan, Dublin, Ireland); flow rate, 1 mL/min; injection volume, 20 µL. the wavelength was 285 nm. HMF was identified by splitting the peak in “água-mel” with a standard HMF (Acros Organis, New Jer-sey, USA), and by comparison of the spectra of the HMF standard with that of an “água-mel” sample. the amount of HMF was determined us-ing an external calibration curve (8-500 mg/L). Data were elaborated using EZchrom Elite (VWr International, carnaxide, Portugal). Each sam-ple was analyzed in triplicate.
Fructose and glucose
Fructose and glucose were determined accord-ing to the International Honey commission IHc (2002). About 0.5 g of “água-mel” was weighed directly into polypropylene tubes and mixed with 10 mL 25% methanol. Afterwards, 1 mL of the solution was filtered through a 0.45 µm filter (VWr International, USA) prior to HPLc analy-sis. the determination of sugars was performed with the same high-performance liquid chroma-tograph equipped with a refractive index (rI) de-tector (Hitachi model L-2490, Japan). the sep-aration was performed by using a Merck NH2 -bonded column for carbohydrate Analysis (Li-chrocArt 250-4) with a particle size diameter of 5 µm, equipped with a guard column (Merck LichrocArt 4-4).
the column was kept at 30ºc throughout the analysis. the HPLc pumps, autosampler, col-umn oven and rI detector were monitored and controlled using EZchrom Elite system. the mobile phase was composed of 80% acetonitrile HPLc Grade (Panreac, barcelona, Spain) in wa-ter. the injection volumes of the samples were 20 µL, with a flow rate of 1 mL/min.
the HPLc sample peaks were identified by comparing the retention times obtained from standards. the “água-mel” samples were also spiked with standards in order to verify the
iden-tity of the chromatographic peaks. triplicate in-jections were performed and average peak are-as were used for the peak quantification. the standard of fructose (3-20 g/L) and glucose (4-20 g/L) were from Sigma (S. Louis, MO, USA). the amount of the monosaccharides was deter-mined using an external calibration curve.
Estimation of total polyphenols
the total polyphenol content was determined by a modification of the Folin-ciocalteu meth-od and the results are expressed as mg gal-lic acid (Acros Organics, New Jersey, USA)/kg. the method was that followed by some authors for honey (AL et al., 2009). Five grams of “água-mel” were treated with 50 mL of distilled water, mixed and filtered using a qualitative filter. Five hundred microlitres of this solution was mixed with 2.5 mL Folin-ciocalteu reagent (0.2 N) (Mer-ck KGaA, Darmstadt, Germany) for 5 min and then 2 mL of a Na2cO3 (PrONALAb, Lisboa, Por-tugal) solution were added (75 g/L). All samples were incubated at room temperature in the dark conditions for 2 h, and the absorbance was read at 760 nm.
the blank solution contained water instead of “água-mel”. For calibration curve, a stock solu-tion of gallic acid (1 g/L) was prepared for fur-ther dilutions (4-500 mg/L).
Estimation of total flavonoids
A method described by ISLA et al. (2011) was used for total flavonoids determination. briefly, 0.5 mL Alcl3 (carlo ErbA reagents, Val de re-uil, France) (20 g/100 mL) was added to 0.5 mL of “água-mel” samples. After 1 h at room tem-perature, absorbance was measured. total fla-vonoid contents were expressed as mg querce-tin (Alfa Aesar GmbH & coKG, carsluhe, Ger-many)/kg of “água-mel” (mg/kg of ”água-mel”), us-ing a calibration curve over the range of 15.6-125 mg quercetin/L.
Estimation of proline content
the proline content was determined by using a colour comparison after applying ninhydrin, with a proline standard. the content was expressed as a proportion to the mass of “água-mel” test-ed. the proline content was determined accord-ing to the harmonized method for honey devel-oped by the International Honey commission IHc (2002). A solution (0.5 mL) of “água-mel” (0.05 g/mL) was mixed with 1 mL of formic acid (80%) (Acros Organis, New Jersey, USA), 1 mL of ninhydrin (Acros Organis, New Jersey, USA) so-lution [3% in ethylene glycol monomethylether, from (Panreac Quimica, barcelona, Spain)] and shaken vigorously for 15 min. the mixture was placed in a boiling water bath for 15 min and transferred to a 70ºc bath for 10 min. Five mL
of 50% 2-propanol (riedel-de-Haën, Seelze, Ger-many) in water was then added to the mixture and was left to cool. the absorbance was read at 510 nm, 45 min after removal from the 70ºc water bath. Water was used as blank and 0.032 mg/mL solution of proline (Acros Organis, New Jersey, USA) was used as standard solution.
Proline concentration in mg/kg of honey was calculated as follows:
Proline (mg/kg) = (Es/Ea) x (E1/E2) x 80, where Es is the absorbance of the sample solu-tion; Ea is the absorbance of the proline stand-ard solution (average of 3 readings); E1 is the mg of proline used for the standard solution; E2 is the weight of “água-mel” in grams; 80 is the dilu-tion factor. the mean of three readings was used.
Diastase activity
two different methods are used to determine honey diastase. the traditional Schade meth-od uses starch as a substrate. the diastase ac-tivity of “água-mel” was evaluated by the meth-odology previously reported in the Internation-al Honey commission IHc (2002).
rESULtS AND DIScUSSION
All tested samples were negative for all micro-biological indicators, except sample 1M/2011 that was contaminated with 3,41±0,09 Log10 cFU/g of aerobic mesophilic bacteria and 4,05±0,11 Log10 cFU/g of sulphite-reducing
Clostridium spp.
the consumption of the tested “água-mel” samples poses no risk to human health, except sample 1M/2011 that evidences a contamina-tion with Clostridium spp. the consumpcontamina-tion of honey or honey derivatives contaminated with
C. botulinum poses a particular risk to children, elderly and immunocompromised individuals (EUrOPEAN cOMMISSION, 2002; ANONYMOUS, 2005). the sources of contamination of honey or its derivatives with Clostridium spp. may occur through bee’s digestive tract, pollen, soil, dust and from not properly cleaned equipment and processing areas (NEVAS et al., 2006). In Por-tugal botulism cases are rare: between 2003-2006 the mean of notified cases were 8 cases (Direcção Geral de Saúde, 2007) and the first in-fant botulism case was just reported ( SArAI-VA et al., 2012). the case involved a 1-month-old infant that was breastfed but his parents used to give him chamomile tea and occasion-ally honey (chamomile tea and honey brought from Moldavia). In the case reported C.
botu-linum type b was isolated from infant faeces sample and as well from chamomile tea herbs and honey (SArAIVA et al., 2012). In what con-cerns “água-mel” sample 1M/2011, the identi-fication of the Clostridium spp. contamination source is under investigation and the
produc-table 1 - Physico-chemical results obtained from “água-mel” samples of Portugal.
Beekeeper/ Ash Electrical Water pH±SD Free Lactone Total Year (%, w/w) conductivity content acidity acidity acidity
(μS/cm±SD) (%, ±SD) (meq/kg ±SD) (meq/kg ±SD) (meq/kg ±SD)
1A/2010 0.185±0.005 407.89±0.32 22.0±0.1 3.25±0.00 53.6±0.6 19.84±1.14 73.45±1,35 1A/2011 0.425±0.022 715.22±3.05 23.0±0.0 3.35±0.00 83.3±1.6 17.22±1.14 100.51±2.68 1B/2008 0.202±0.019 487.89±3.87 24.2±0.0 3.44±0.01 52.6±0.5 18.53±3.41 71.15±3.08 1B/2010 0.284±0.008 563.33±2.64 25.0±0.0 3.49±0.00 57.3±0.6 18.53±1.97 75.81±2.24 1B/2011 0.425±0.022 751.89±0.27 19.2±0.0 3.35±0.00 102.2±0.5 20.50±0.00 122.72±3.64 1H/2011 0.209±0.013 418.44±0.43 18.3±0.1 3.56±0.01 40.7±0.5 14.60±0.00 55.27±3.67 1i/2011 0.167±0.017 439.44±2.12 22.8±0.0 3.49±0.01 33.2±0.6 20.50±0.00 53.72±0.51 1M/2011 0.474±0.093 1067.00±1.68 >25.0 3.91±0.01 74.8±0.7 15.26±1.14 90.03±1.15 2A/2011 0.442±0.013 765.56±3.20 20.1±0.1 3.35±0.00 91.2±0.2 18.53±3.41 109.76±0.79 2B/2011 0.392±0.013 696.44±3.15 23.4±0.1 3.35±0.00 77.5±0.9 15.91±1.14 93.42±2.07
er will be instructed with actions to eliminate the source of contamination.
the physicochemical parameters of “água-mel” of beekeepers from Portugal are depicted in tables 1 and 2. the values found for ash (%) ranged from a minimal 0.167% to a maximal of 0.474%. A great variability was even detected for “água-mel” produced by the same beekeeper but in different years, such as observed for 1A/2010 and 1A/2011, and 1b/2008 and 1b/2011 (ta-ble 1). Ash represents the direct measure of in-organic residues after “água-mel” carbonization. In honey, the ash percentage expresses its rich-ness in mineral content and constitutes a qual-ity parameter, which depends mainly from flo-ral origin of honey (MArcHINI et al., 2007; bOG-DANOV et al., 2009; ALOISI, 2010). the diversi-ty of ash percentages found in “água-mel” sam-ples in the same producer but in different years may reveal the utilization of honeys from differ-ent floral origins.
Electric conductivity is a quality parameter which is closely related to the concentration of mineral salts, organic acids and proteins and shows a great variability according to the flo-ral origin (AcQUArONE et al., 2007; ZErrOUK
et al., 2011). the values of electric conductivity found are within the range reported by SPANO
et al. (2008) for “abbamele” samples from
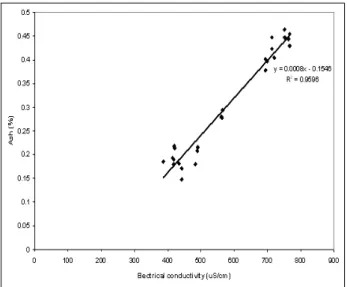
Sar-dinia. the sample 1M/2011 (1,067 mS/cm) was the sole exception which may be partly explained by the presence of aerobic mesophilic bacteria and Clostridium spp.. A linear relationship has been reported between ash and electric conduc-tivity of different types of honey (SANcHO et al., 1991; MALIKA et al., 2005), although some au-thors consider that such relationship may de-pend on the floral origin of honeys ( tHrASY-VOULOU and MANIKIS, 1995). In our samples of “água-mel” a direct correlation was found be-tween those two parameters (r=0.980, P<0.01). Fig. 2 depicts such correlation.
the water content found in one sample of “água-mel” (1M/2011) exceeded the maximum moisture content of 25% established by Euro-pean legislation (EU council, 2002) for water content in honey. the remaining samples had lower levels, nevertheless the majority showed percentages superior to 20%, which is generally found in unifloral honeys from Europe (MAtEO
and bOScH-rEIG, 1998; PErSANO and PIrO, 2004), and our sample values are within the range found for “abbamele” from Sardinia ( SPA-NO et al., 2008). the only exclusion was sam-ples 1b/2011 and 1H/2011 that showed low-er 20% watlow-er content. this variability of watlow-er content in “água-mel” samples may be attribut-ed to three main factors: the residual moisture
table 2 - Monosaccharide, phenols and HMF results obtained from “água-mel”samples of Portugal.
Sample Glucose Fructose Total polyphenols Flavonoids HMF (g/kg±SD) (g/kg±SD) (mg/kg±SD) (mg/kg±SD) (mg/kg±SD) 1A/2010 241.16±1.20 306.15±2.03 2718.7±75.45 603.2±6.92 4370.7±71.0 1A/2011 258.52±3.05 266.34±3.79 4508.5±116.36 1316.6±16,14 6620.0±79.8 1B/2008 241.01±3.88 299.19±5,01 2403.1±67.51 582.6±6.57 3327.9±29.9 1B/2010 229.63±6.11 288.02±1.72 2733.9±46,71 698.6±5.04 3938.6±128.2 1B/2011 250.65±0.64 269.22±0.96 4963.8±93.96 1702.4±13.89 6884.2±57.4 1H/2011 252.41±14.76 315.36±20.01 4125.8±96.21 355.6±9.34 1812.6±13.6 1i/2011 243.46±3.24 289.75±3.87 1780.0±40.48 188.8±6.47 1969.5±4.5 1M/2011 185.57±0.33 218.49±0.72 2777.9±23.32 278.3±2.53 4352.9±157.8 2A/2011 246.12±14.53 252.92±0.93 2718.7±81.97 1579.7±11.97 8428.9±42.9 2B/2011 237.94±8.33 271.94±11.45 2611.0±20.42 1155.7±24.98 6506.5±31.1
in the honeycombs, the amount of water initial-ly added for treating honeycombs, the tempera-ture used and the length of the heating process (SPANO et al., 2008).
the parameter pH is within the ranges re-ported for honey (3.5-5.5) and “abbamel” from Sardinia (Italy) (3.21-3.92) (SPANO et al., 2008). Nevertheless the free acidity parameter of some samples was superior to that reported for hon-ey (not more than 80 meq/kg for baker’s honhon-ey) (EU council, 2002). In our case, a great range of values was found: 33.2 meq/kg for sample 1I/2011 and 102.2 meq/kg for Ib/2011 (ta-ble 1).
the acid content of honey is due to the acids added by the bees, being the main one gluconic acid, a product of glucose oxidation by glucose oxidase. this acid is generally present in honey as its internal ester, a lactone, which does not contribute to honey’s active acidity (bOGDANOV
et al., 2004). Lactone acidity is determined by adding an excess of alkali to a neutralized hon-ey and back-titrating with acid (WHItE et al., 1958). the sum of free acidity and lactone acid-ity gives the total acidacid-ity of honey samples. Lac-tone acidity in “água-mel” ranged from 14.60 to 20.50 meq/kg. total acidity exceeding 100 meq/ kg were found in samples 1A/2011, 2A/2011 and 1b/2011 (table 1).
Glucose and fructose were the main sugars present in “água-mel”, predominating fruc-tose in all samples. the amounts found in our samples were similar to those already report-ed for some “abbamele” samples from Sardinia (JErKOVIc´ et al., 2011). the variability found and according to the same authors may be at-tributed to the preparation procedure, rath-er than with diffrath-erent types of honey used. In our samples such is not so evident because for the same producer but in different years of production the amounts of the two
mono-saccharides changed (table 2). It is our opin-ion that both factors may be responsible for the observed differences.
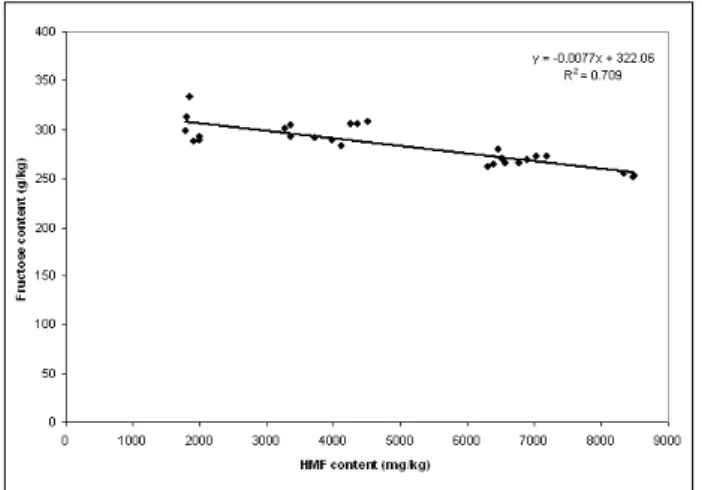
the absence of diastase activity in all samples is understandable since “água-mel” is a prod-uct obtained by heating the raw material for several hours, inactivating enzymes. the same would be expected for proline as also reported for Italian “abbamele” (SPANO et al., 2008). In fact, only one sample had a significant content of this amino acid (462.4 mg/kg): 1M/2011. this value may be associated to the presence of Clostridium ssp. which can synthesize this amino acid by the Stickland reaction (NISMAN, 1954). the absence of proline in all samples, ex-cepting 1M/2011, may be attributed to an in-creased rate of Maillard reaction, which is ini-tiated by the reaction of a carbohydrate with a compound possessing a free amino group ( PAÄt-ZOLD and brÜcKNEr, 2006; cZIPA, 2010). the levels of sugars slightly inferior to those report-ed for honey samples may also be attributreport-ed to their consumption in the Maillard reactions, as reported for OOStErVELD et al. (2003) in roast-ed Coffea arabica beans. these authors reportroast-ed that during roasting, oligosaccharides hydrolyse to monosaccharides and both are able to react with protein/peptides/amino acids originating Maillard products which are responsible for the formation of volatile compounds and organic ac-ids (OOStErVELD et al., 2003). the relative high free and total acidity found in “água-mel” sam-ples may be, therefore, endorsed to the libera-tion of organic acids. Such may explain the in-verse correlation obtained between fructose and total acidity (r=-0.796; p<0.01). Fig. 3 represents this inverse relation between fructose and to-tal acidity, which was not detected for glucose. At same time, the thermal treatment is also responsible for the degradation of monosac-charides to hydroxymethylfurfural (HMF), and therefore to the decrease of sugars, particularly fructose, because an inverse correlation was ob-tained between the fructose concentration and
Fig. 2 - correlation found between ash and electrical con-ductivity in “água-mel” samples.
Fig. 3 - correlation found between total acidity and fructose content in “água-mel” samples.
HMF content (r=-0.842, p<0.01) as can be seen in the Fig. 4.
As expected, HMF content (table 2) is largely superior to that of honey samples, nevertheless comparable to those found for “abbamele” ( SPA-NO et al., 2008; JErKOVIc´ et al., 2011). Never-theless some samples (2A/2011) showed high-er concentrations (8428.9 mg/kg) in compari-son to the sample with the highest concentra-tion reported by SPANO et al. (2008) (4,476 mg/ kg), still within the ranges found for liquid car-amel as reported by those authors. In order to have reference HMF values from thermally treat-ed foodstuffs the HMF value of liquid caramel, instant coffee powder and coffee substitutes was determined. these foodstuffs showed high-er HMF values in comparison to our “água-mel” samples: liquid caramel (9,700 mg/kg), instant coffee powder (11,500 mg/kg), and coffee sub-stitutes (9,700 mg/kg).
Polyphenol concentration ranged from 1780.0 mg/kg in sample 1I/2011 to 4963.8 mg/kg in sample 1b/2011 (table 2), amounts significantly superior to those reported by SPANO et al. (2008), but within the ranges reported by JErKOVIc´ et
Fig. 4 - correlation found between HMF content and fruc-tose content in “água-mel” samples.
al. (2011) As reported by these authors, such differences may be explained by different sam-ple preparation and data expression.
It is remarkable the great variability of fla-vonoid content in “água-mel” samples, even in the same producer but in different years of pro-duction. For example, for samples 1A (2010 and 2011) and 1b (2008, 2010 and 2011) a large vari-ability in flavonoids content was observed (ta-ble 2). this variability may result from diverse floral origin of honeys used in different years for the production of “água-mel”. the levels of flavo-noids go along with the amounts of total polype-henols, there is even a significant correlation be-tween these two parameters (r=0.960, p<0.01) as can be observed in the Fig. 5.
Our study shows that “água-mel” obtained from honey after thermal treatment continue to possess some of the parameters similar to those of honey, including pH, glucose and fruc-tose as main constituents, but generally rela-tive higher percentages of water content, free acidity and HMF, and low levels or even ab-sence of proline and diastase activity, as expect-ed due to the thermal processing, but the val-ues of HMF in our samples are comparable to other foodstuffs. the presence of phenols and flavonoids in “água-mel” was as predicted due to their invariable presence in honey. Never-theless higher quantities were detected which must be enlightened because some interference may be responsible for such data. the determi-nation of the microbiological quality of “água-mel” showed the presence of Clostridium spp. in one of the samples. this result shows that as for honey the use of “água-mel” is not rec-ommended for infant feed.
AcKNOWLEDGMENt
this study was funded by the Ministério da Agricultura, Mar, Ambiente e Ordenamento do território, Portugal, under the Program PAN2011/2013, Medida A (Portugal).
rEFErENcES
Acquarone c., buera P. and Elizalde b. 2007. Pattern of pH and electrical conductivity upon honey dilution as a com-plementary tool for discriminating geographical origin of honeys. Food chem. 101: 695.
Al M.L., Daniel D., Moise A., bobis O., Laslo L. and bog-danov S. 2009. Physico-chemical and bioactive proper-ties of different floral origin honeys from romania. Food chem. 112: 863.
Aloisi P.V. 2010. Determination of quality chemical parame-ters of honey from chubut (Argentinean Patagonia). chil. J. Agric. res. 70: 640.
Anonymous. 2005. Opinion of the Scientific Panel on biolog-ical Hazards on a request from the commission related to
Clostridium spp in foodstuffs. EFSA Journal. 199: 1-65. bogdanov S. 2002. Harmonized Methods of the Internation-al Honey commission. (http://www.apiculturacluj.com/ Apiculturacluj/italiano/Documents/IHcmethods_e.pdf) (most recent access date).
bogdanov S. 2009. Honey composition (http://fantastic-fla-Fig. 5 - correlation found between flavonoid content and
vour.com/yahoo_site_admin/assets/docs/composition-Honey.20105942.pdf) (most recent access date). bogdanov S., ruoff K. and Oddo L.P. 2004.
Physico-chemi-cal methods for the characterisation of unifloral honeys: a review. Apidologie 35: S4.
czipa N. 2010. comparative study of honeys with different origin, the effect of production-forming on the quality.
PhD thesis. University of Debrecen, Debrecen, Hungary. Direcção Geral da Saúde 2007. Doenças de Declaração
Obrigatória, 2002-2006, botulismo, pp 11.Portugal. EU council 2002. council Directive 2001/110/Ec of 20
December 2001 relating to honey. Official Journal of the European communities L10, 47-52.
European commission, Health and consumer Protection Directorate-General 2002. Honey and Microbiological Hazards, 1-40.
Isla M.I., craig A., Ordoñez r., Zampini c., Sayago J., be-dascarrasbure E., Alvarez A., Salomón V. and Maldona-do L. 2011. Physico chemical and bioactive properties of honeys from Northwestern Argentina. LWt-Food Sci. technol. 44: 1922.
ISO 15213:2003 2003. Microbiology of food and animal feeding stuffs-Horizontal method for the enumeration of sulfite-reducing bacteria growing under anaerobic condi-tions. International Standards Organization, Switzerland. ISO 21527-2:2008 2008. Microbiology of Food and Animal
Feeding Stuffs – Horizontal Method for the Enumeration of Yeasts and Moulds – Part 2: colony count technique in Products with Water Activity Less than or Equal to 0.95. International Standards Organization, Switzerland. ISO 21528-2:2004 (E) 2004. Microbiology of Food and An-imal Feeding Stuffs – Horizontal Method for the detec-tion and enumeradetec-tion of Enterobacteriaceae-Part 2: col-ony-count method.
ISO 6579:2002 (E) 2002. Microbiology of Food and Ani-mal Feeding Stuffs-Horizontal Method for the Detection of Salmonella spp. International Standars Organization, Switzerland.
Jerkovic´ I., Kasum A., Marijanovic´ Z. and tuberoso c.I.G. 2011. contribution of the characterization of honey-based Sardinian product abbamele: volatile aroma composition, honey marker compounds and antioxidant activity. Food chem. 124: 401.
Malika N., Mohamed F. and chakib El A. 2005. Microbiolog-ical and physico-chemMicrobiolog-ical properties of Moroccan honey. Int. J. Agric. biol. 7: 773.
Marchini P.V., Moreti A.c.c.c., Otsuk I.P. and Sodré G.S.
2007. Physicochemical composition of Apis mellifera honey samples from São Paulo, brazil. Quim. Nova 30: 1653.
Mateo r. and bosch-reig F. 1998. classification of Span-ish unifloral honeys by discriminant analysis of electri-cal conductivity, color, water content, sugars, and pH. J. Agric. Food chem. 46: 393.
Nevas M., Lindström M., Hörman A., Keto-timonen r. and Korkeala H. 2006. contamination routes of Clostridium
botulinum in the honey production environment. Envi-ron. Microbiol. 8: 1085.
Nisman b. 1954. the Stickland reaction. bacteriol. rev. 18: 16.
NP-4405:2002 2002. Microbiologia Alimentar - regras ge-rais para a contagem de microrganismos. contagem de colónias a 30ºc. Instituto Português da Qualidade, Lis-boa, Portugal.
Oosterveld A., Voragen A.G.J. and Schols H.A. 2003. Effect of roasting on the carbohydrate composition of Coffea
ar-abica beans. carbohyd. Polym. 54: 183.
Paätzold r. and brückner H. 2006. Gas chromatograph-ic detection of D-amino acids in natural and thermal-ly treated bee honeys and studies on the mechanism of their formation as result of the Maillard reaction. Europ. Food res. technol. 223: 347.
Persano Oddo L. and Piro r. 2004. Main European unifloral honeys: descriptive sheets. Apidologie 35: S38.
Sancho M.t., Muniategni S., Sánchez M.P., Huidobro J.F. and Simal J. 1991. relationships between electrical con-ductivity and total and sulphated ash contents in basque honeys. Apidologie 22: 487.
Saraiva M., cunha I.c., bonito c.c., Pena c., toscano M.M., Lopes t.t., Sousa I. and calhau M.A. 2012. First case of infant botulism in Portugal. Food control 26: 79. Spano N., ciulu M., Floris I., Panzanelli A., Pilo M.I., Piu
P.c., Scanu r. and Sanna G. 2008. chemical character-ization of a traditional honey-based Sardinian product: Abbamele. Food chem. 108: 81.
thrasyvoulou A. and Manikis J. 1995. Some physicochem-ical and microscopic characteristics of Greek unifloral honeys. Apidologie 26: 441.
White J.W., Petty J. and Hager r.b. 1958. the composition of honey. II. Lactone content. JAOAc 41: 194.
Zerrouk S.H., Fallico b.G., Arena E.N., ballistreri G.F. and boughediri L.A. 2011. Quality of evaluation of some hon-ey from the central region of Algeria. Jordan J. biol. Sci. 4: 243.