Implications of epigallocatechin-3-gallate in cultured human Sertoli cells
glycolytic and oxidative pro
file
Tânia R. Dias
a,b,c, Marco G. Alves
b, Joaquina Silva
d, Alberto Barros
d,e,f, Mário Sousa
b,d, Susana Casal
c,
Branca M. Silva
a,⁎
, Pedro F. Oliveira
b,e,f,⁎⁎
a
Centro de Investigação em Ciências da Saúde (CICS-UBI), Universidade da Beira Interior, 6201-001 Covilhã, Portugal
b
Department of Microscopy, Laboratory of Cell Biology, Institute of Biomedical Sciences Abel Salazar, Unit for Multidisciplinary Research in Biomedicine, University of Porto, 4050-313 Porto, Portugal
c
LAQV/REQUIMTE— Laboratory of Bromatology and Hydrology, Faculty of Pharmacy, University of Porto, 4150-755 Porto, Portugal
dCentre for Reproductive Genetics Prof. Alberto Barros, 4100-009, Porto, Portugal e
Department of Genetics, Faculty of Medicine, University of Porto, 4050-313 Porto, Portugal
f
i3S- Instituto de Investigação e Inovação em Saúde, Universidade do Porto, 4200-135 Porto, Portugal
a b s t r a c t
a r t i c l e i n f o
Article history:
Received 28 November 2016 Received in revised form 13 March 2017 Accepted 16 March 2017
Available online 18 March 2017
Sertoli cells are crucial for the success of spermatogenesis, which is the biological process that ensures male fer-tility. These cells present high metabolic rates, being often subjected to high oxidative stress levels that, if uncon-trolled, may compromise male fertility. Since the most abundant tea catechin, epigallocatechin-3-gallate (EGCG), has demonstrated a potent preventive activity against oxidative stress, we have evaluated its effect at concentra-tions of 5 and 50μM, on the metabolism, mitochondrial functionality and oxidative profile of human Sertoli cells (hSCs). While, the highest concentration of EGCG (50μM) increased glucose and pyruvate consumption, it de-creased the conversion of pyruvate to alanine to sustain a regular lactate production. However, despite maintain-ing Krebs cycle functionality, EGCG (50μM) decreased mitochondrial membrane potential of hSCs, which could compromise the normal rates of ATP production. Interestingly, oxidative damages to proteins and lipids de-creased in this experimental group, which may be valuable for the nutritional support of spermatogenesis.
© 2017 Published by Elsevier Ltd.
Keywords:
Epigallocatechin-3-gallate Glucose metabolism Human Sertoli cells Mitochondrial bioenergetics Oxidative profile Spermatogenesis
1. Introduction
Tea is one of the most widely consumed beverages worldwide. Al-though it is commonly drunk for pleasure, tea is well-known for its health-promoting properties. The main constituents of tea leaves in-clude proteins, polyphenols, methylxanthines, amino and organic
acids (Dias et al., 2014c). Epigallocatechin-3-gallate (EGCG) is the
most abundant and biologically active tea polyphenol, representing
50–80% of the total tea catechins (Khan and Mukhtar, 2007). Most of
the tea's medicinal properties are attributed to EGCG, which has dem-onstrated a potent preventive activity against oxidative stress (OS)
(Lombardo et al., 2011). Its ability to protect cells from reactive oxygen species (ROS)-induced damages has made EGCG a popular nutraceuti-cal. Tea and its constituents are currently receiving considerable atten-tion since they can be used as dietary supplements to prevent or even treat several diseases/dysfunctions. For instance, they have been
de-scribed as potential modulators of spermatogenesis (Dias et al.,
2014a), which is the process of sperm production. Sertoli cells (SCs) are the testicular cells responsible for the maintenance of spermatogen-esis. The resulting metabolites of the distinctive metabolism of these cells are essential for the survival of developing germ cells. Particularly, the lactate produced by SCs constitutes the preferred substrate of germ
cells for energy production (Dias et al., 2014b). When the metabolic
co-operation between SCs and germ cells is disrupted, fertility problems
may arise (Alves et al., 2014). The increasing incidence of male
subfertility/infertility highlighted the need for new therapies.
Interest-ingly, the consumption of tea seems to be a promising approach (Dias
et al., 2016b; Oliveira et al., 2015b). However, the underlying mecha-nisms remain unknown. We have previously demonstrated that a white tea extract was able to alter rat SCs metabolism, suggesting possi-ble implications for male fertility (Martins et al., 2014). Additionally, the exposure of human SCs (hSCs) to the most abundant methylxanthine of tea, caffeine, led to increased production of lactate and alanine, affecting
Abbreviations: EGCG, epigallocatechin-3-gallate; ETC, electron transport chain; GLUT1, glucose transporter 1; GLUT2, glucose transporter 2; GLUT3, glucose transporter 3; GLUTs, glucose transporters; hSCs, human Sertoli cells; LDH, lactate dehydrogenase; MCT4, monocarboxylate transporter 4; OS, oxidative stress; OXPHOS, oxidative phosphorylation; PFK1, phosphofructokinase 1; ROS, reactive oxygen species; SCs, Sertoli cells; SRB, sulforhodamine B.
⁎ Correspondence to: B.M. Silva, Health Sciences Research Centre, University of Beira Interior, Avenida Infante D. Henrique, 6200-506 Covilhã, Portugal.
⁎⁎ Correspondence to: P.F. Oliveira, Department of Microscopy, Laboratory of Cell Biology, Institute of Biomedical Sciences Abel Salazar (ICBAS), Rua de Jorge Viterbo Ferreira n°228, 4050-313 Porto, Portugal.
E-mail addresses:bmcms@ubi.pt(B.M. Silva),pfobox@gmail.com(P.F. Oliveira).
http://dx.doi.org/10.1016/j.tiv.2017.03.006
0887-2333/© 2017 Published by Elsevier Ltd.
Contents lists available atScienceDirect
Toxicology in Vitro
cells oxidative profile (Dias et al., 2015b). Tough, there is a lack of infor-mation concerning the effect of catechins on these testicular cells.
Here-in, we aimed to evaluate the effect of EGCG (5 and 50μM) on hSCs
metabolism, mitochondrial functionality and oxidative profile. We
hy-pothesize that EGCG can act as a relevant modulator of the nutritional support of spermatogenesis, being useful to counteract male reproduc-tive problems associated with hSCs dysfunction.
2. Material and methods 2.1. Chemicals
Dulbecco's Modified Eagle Medium (DMEM), Ham's F-12 (F12) and
Fetal Bovine Serum (FBS): Biochrom (Leonorenstr, Berlin, Germany); M-PER Mammalian Protein Extraction Reagent and LDH Enzymatic
Assay Kit: Thermo Scientific (Waltham, MA, USA); JC1: Molecular
Probes (Eugene, OR, USA); EGCG (CAS Number 989-51-5):
Sigma-Aldrich (St. Louis, MO, USA); Extracellular O2Consumption assay:
Abcam (Cambridge, UK); All other chemicals: Sigma-Aldrich (St. Louis,
MO, USA) unless specifically stated.
2.2. Human Sertoli cell primary culture
Testicular tissue processing was performed at Centre for Reproduc-tive Genetics Professor Alberto Barros (Porto, Portugal) according to local, national, and European ethical committees' guidelines and the Declaration of Helsinki. Six testicular biopsies were obtained from six different patients with conserved spermatogenesis, after informed writ-ten consent. hSCs were obtained from the cells left in tissue culture plates after each patient's treatment and isolated by our routine method (Oliveira et al., 2009). Cells from each individual were plated separately
in six cell + cultureflasks (Sarstedt, Nümbrecht, Germany) and
incu-bated at 33–34 °C to mimic the temperature to which hSCs are
subject-ed in vivo into the scrotum (Ivell, 2007). Moreover, a controlled
atmosphere of 5% CO2was maintained in the incubator, since it is
re-quired to stabilize the pH of the growth media. After 96 h, cultures were examined by phase contrast microscopy and only hSCs with con-taminants below 5% were used. hSCs culture purity was determined as previously described (Alves et al., 2012).
2.3. Experimental groups
hSCs were allowed growing until reaching 90–95% of confluence.
Subsequently, the culture media were replaced by serum-free media
(DMEM:F12) supplemented with insulin–transferrin–sodium selenite
(ITS) media (10μg/mL–5.5 μg/mL–0.005 μg/mL, respectively). Three
ex-perimental groups were defined: a control group without EGCG and
two groups supplemented either with 5 or 50μM of EGCG. Although
the bioavailability of EGCG after drinking tea is very low (0.3–0.5 μM)
(Yang et al., 2009), the ingestion of 400–1200 mg of EGCG from a tea
ex-tract (fasting conditions) may result in plasma levels of 2–7 μM (Chow
et al., 2003). Based on these studies, we have selected the lowest
con-centration of 5μM of EGCG. Furthermore, since many studies reported
the pharmacological relevance of EGCG at 50μM (Albrecht et al.,
2008; Weber et al., 2004), we have also included this concentration in
our study. After 24 h of treatment with 0, 5 or 50μM of EGCG, cells
and the respective culture media were collected. Cell viability was
eval-uated by the Trypan Blue Exclusion test and averaged 85–90%.
2.4. Sulforhodamine B assay
A sulforhodamine B (SRB) colorimetric assay was performed as
pre-viously described (Fricker, 1994), to evaluate hSCs proliferative
re-sponses to the culture media (Dias et al., 2015a). In brief, hSCs were
plated in a 96-well culture plate (same amount of cells per well), left
to grow until reaching a confluence of 60–70% and treated with the
test culture media containing 0, 5 or 50μM of EGCG for 24 h. Then,
cells werefixed overnight (at −20 °C) with a mixture containing 1%
acetic acid and 99% methanol and subsequently stained with 0.05% (w/v) SRB dissolved in 1% acetic acid for 1 h. Unbound SRB was removed by washing with 1% acetic acid, whereas the bound SRB was solubilized with 10 mM Tris base (pH 10) in a shaker for 10 min. A blank was made with Tris base (pH 10) and the absorbance was read at 492 nm. Absor-bance readings of SRB-stained cells gives a direct measure of cell
num-bers. To obtain concentration–response curves we defined the cell
growth of the control group as 100% and calculated the cell growth of treated groups relative to control.
2.5. Proton NMR (1H-NMR) spectroscopy
1H-NMR spectra of hSCs extracellular culture media were acquired
and quantified as described by our team (Alves et al., 2011). Sodium
fu-marate (final concentration of 1 mM) was used as an internal reference
(6.50 ppm) to quantify the following metabolites present in hSCs extra-cellular media (multiplet, ppm): lactate (doublet, 1.33); alanine (dou-blet, 1.45), acetate (singlet, 1.90), pyruvate (singlet, 2.35), citrate
(multiplet, 2.57–2.72) and H1-α-glucose (doublet, 5.22). Relative
areas of1H-NMR resonances and metabolites concentrations were
quantified as described (Alves et al., 2011). 2.6. Western blot
Total proteins from hSCs were isolated using M-PER Mammalian Protein Extraction Reagent according to manufacturer's instructions.
Western blot was performed as previously described (Dias et al.,
2013). In brief, proteins were fractionated in 12% polyacrylamide gels,
then the separated proteins were transferred to previously activated
polyvinylidene difluoride (PVDF) membranes and blocked for 90 min
with a 5% non-fat milk solution at room temperature. Afterwards, the membranes were incubated overnight at 4 °C with the primary
antibod-ies listed inTable 1. Mouse anti-β-actin was used as the protein loading
control. The immunoreactive proteins were detected separately and vi-sualized after incubation with the respective secondary antibodies (Table 1) for 90 min, at room temperature. The band density attained
was divided by the corresponding β-actin band intensities and
expressed in fold variation (induction/reduction) relative to the control group.
2.7. Lactate dehydrogenase (LDH) enzymatic assay
Intracellular LDH activity levels of hSCs were spectrophotometrically
determined using the LDH Enzymatic Assay Kit as described (Dias et al.,
2015b). Absorbance at 490 nm was measured using an Anthos 2010 mi-croplate reader (Biochrom, Berlin, Germany). LDH enzymatic activities were calculated as units per milligram of protein, using the molar
ex-tinction factor (ε) and expressed as fold variation to the control group.
2.8. Mitochondrial membrane potential
Thefluorescent probe JC1 was used to measure mitochondrial
mem-brane potential of hSCs, using a slightly modified version of the method
described bySalvioli et al. (1997). The accumulation of the JC1 dye in
mitochondria depends on mitochondrial membrane potential. In brief, hSCs were cultured in a 96-well culture plate (same amount of cells per well) with DMEM:F12 (1:1, pH 7.4) supplemented with 1% FBS.
Cells were left to grow until reach 60–70% of confluence. Then, the
cul-ture medium was replaced by ITS medium supplemented with 0, 5 or
50μM of EGCG. After 24 h, the medium was removed and cells were
washed with PBS. 100μL of JC1 staining solution (1 μg/mL), previously
prepared in DMEM:F12 supplemented with 1% FBS, were added to each well and cells were incubated for 15 min at 37 °C. Afterwards,
with 1% FBS were added to each well. Fluorescence intensities were
an-alyzed immediately using a Cytation™ 3 Cell Imaging Multi-Mode
Read-er (BioTek, Winooski, USA) pre-heated at 37 °C. Cells with functional mitochondria exhibited JC1 aggregates that were detected at 550/ 590 nm (excitation/emission), while cells with dysfunctional mitochon-dria mainly exhibited JC1 monomers detected at 485/535 nm (excita-tion/emission). The JC1 ratio aggregates/monomers was calculated for each condition as a measure of mitochondrial functionality.
2.9. Extracellular oxygen consumption assay
Oxygen consumption is one of the most informative and direct mea-sures of mitochondrial function. We used the extracellular oxygen con-sumption assay kit (ab197243; Abcam, Cambridge, UK), according to the manufacturer's instructions, to measure the respiration of hSCs
after exposure to EGCG. Briefly, hSCs were cultured in a 96-well culture
plate with DMEM:F12 (1:1, pH 7.4) supplemented with 10% FBS. Cells
were left to grow until reach 80–90% of confluence. Then, the medium
was replaced by ITS medium supplemented with 0, 5 or 50μM of
EGCG. After 24 h of exposure, the medium was removed and replaced
by freshly prepared ITS medium. 10μL of Extracellular O2consumption
reagent were added to each well, except to the blank control. 2 drops of high-sensitivity mineral oil (pre-heated at 37 °C) were added to each well to limit back diffusion of ambient oxygen. Fluorescence intensities
were analyzed immediately using a Cytation™ 3 Cell Imaging
Multi-Mode Reader (BioTek, Winooski, USA) pre-heated at 37 °C. Extracellular oxygen consumption of hSCs was measured at 1.5 min intervals for 120 min at excitation/emission = 380/650 nm. Cells respiration leads to oxygen depletion from the surrounding environment, resulting in
the increase influorescence signal. Fluorescence intensities were
nor-malized to the blank and expressed as counts per second (CPS) versus time (min).
2.10. Analysis of carbonyl groups, nitration and lipid peroxidation Carbonyl groups, nitration and lipid peroxidation are usually used as biomarkers for oxidation and can be evaluated by measuring its resulting products, 2,dinitrophenyl (DNP), nitro-tyrosine and 4-hydroxynonenal (4-HNE), respectively. The content of these adducts
in hSCs after exposure to EGCG was evaluated using specific antibodies
(Table 1) by slot-blot as previously described (Dias et al., 2015b; Oliveira et al., 2015b). Results were expressed as fold variation to the control group.
2.11. Statistical analysis
Statistical significance was assessed by one-way ANOVA, followed
by Dunn post-test using GraphPad Prism 6 (GraphPad Software, San Diego, CA, USA). All data are presented as mean ± SEM (N = 6).
Differ-ences with pb 0.05 were considered statistically significant.
3. Results
3.1. Exposure to the highest dose of EGCG (50μM) decreased hSCs
proliferation
We have evaluated hSCs proliferation after exposure to the sever-al doses of EGCG by the SRB assay. Our results demonstrated that
ad-dition of 5μM of EGCG to hSCs culture medium slightly decreased the
cell growth to 77 ± 15% comparative to control group (100 ± 16%) (Fig. 1). Additionally, the group of hSCs exposed to 50μM of EGCG
presented a cell proliferation of 34 ± 11%, illustrating a significant
decrease to almost one-third of that observed in the control group (Fig. 1). Based on these results, all the subsequent results were nor-malized for the total number of cells or amount of protein in each sample.
Fig. 1. Effect of epigallocatechin-3-gallate (5 and 50μM) in the proliferation of human Sertoli cells (hSCs). Thefigure shows pooled data of independent experiments. hSCs growth is presented as percentage and control value was set at 100%. Results are expressed as mean ± SEM (n = 6 for each condition). Significantly different results (Pb 0.05) are indicated as: a – relative to control.
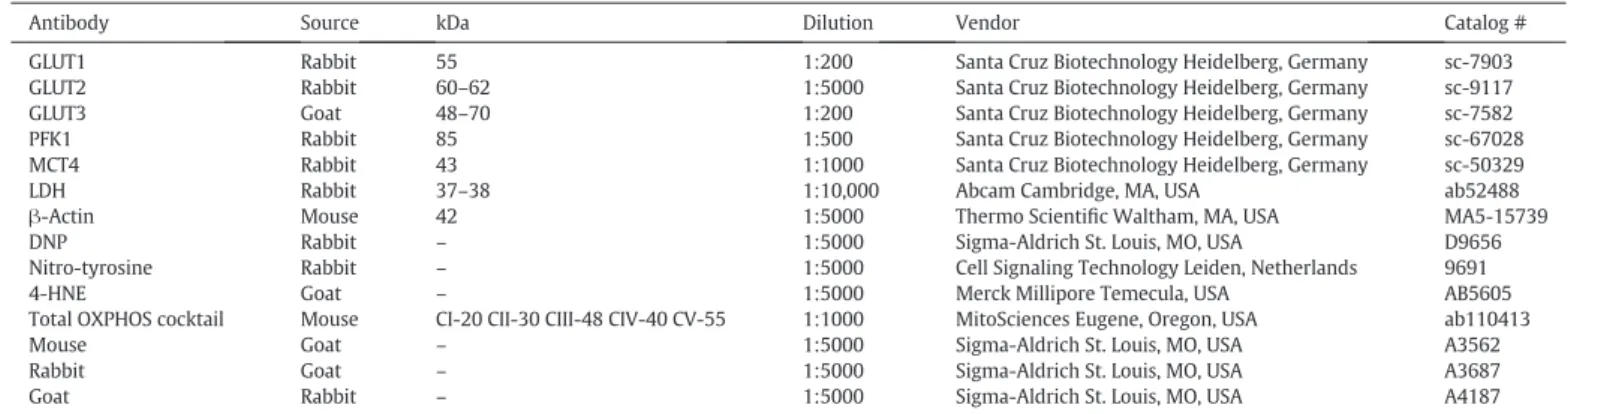
Table 1
List of the primary and secondary antibodies used in this study.
Antibody Source kDa Dilution Vendor Catalog #
GLUT1 Rabbit 55 1:200 Santa Cruz Biotechnology Heidelberg, Germany sc-7903 GLUT2 Rabbit 60–62 1:5000 Santa Cruz Biotechnology Heidelberg, Germany sc-9117 GLUT3 Goat 48–70 1:200 Santa Cruz Biotechnology Heidelberg, Germany sc-7582 PFK1 Rabbit 85 1:500 Santa Cruz Biotechnology Heidelberg, Germany sc-67028 MCT4 Rabbit 43 1:1000 Santa Cruz Biotechnology Heidelberg, Germany sc-50329
LDH Rabbit 37–38 1:10,000 Abcam Cambridge, MA, USA ab52488
β-Actin Mouse 42 1:5000 Thermo Scientific Waltham, MA, USA MA5-15739
DNP Rabbit – 1:5000 Sigma-Aldrich St. Louis, MO, USA D9656
Nitro-tyrosine Rabbit – 1:5000 Cell Signaling Technology Leiden, Netherlands 9691
4-HNE Goat – 1:5000 Merck Millipore Temecula, USA AB5605
Total OXPHOS cocktail Mouse CI-20 CII-30 CIII-48 CIV-40 CV-55 1:1000 MitoSciences Eugene, Oregon, USA ab110413
Mouse Goat – 1:5000 Sigma-Aldrich St. Louis, MO, USA A3562
Rabbit Goat – 1:5000 Sigma-Aldrich St. Louis, MO, USA A3687
Goat Rabbit – 1:5000 Sigma-Aldrich St. Louis, MO, USA A4187
GLUT1: glucose transporter 1; GLUT2: glucose transporter 2; GLUT3: glucose transporter 3; PFK1: phosphofructokinase 1; MCT4: monocarboxylate transporter 4; LDH: lactate dehydro-genase; DNP: 2,4-dinitrophenyl hydrazone; 4-HNE: 4-hydroxynonenal; CI: NADH dehydrogenase (ubiquinone) 1 beta subcomplex subunit 8 (NDUFB8); CII: succinate dehydrogenase complex, subunit B, iron sulfur (SDHB); CIII: ubiquinol-cytochrome c reductase core protein II (UQCRC2); CIV: mitochondrially encoded cytochrome c oxidase I (MTCO1); CV: ATP synthase alpha-subunit (ATP5A).
3.2. Glucose consumption by hSCs was stimulated by exposure to 50μM of EGCG, though GLUT2 protein levels decreased
We havefirstly evaluated glucose uptake since it is the main
meta-bolic substrate of cultured hSCs. Our results showed a glucose
consump-tion of 49 ± 16 and 47 ± 13 pmol/μg protein in non-exposed hSCs and
those exposed to 5μM of EGCG, respectively (Table 2). Contrastingly,
there was an increase in glucose consumption to 161 ± 47 pmol/μg
pro-tein in hSCs exposed to 50μM of EGCG, relative to cells from the other
experimental groups (Table 2). Glucose transport through the hSCs
cy-toplasmic membrane is mediated by glucose transporters (GLUTs),
par-ticularly GLUT1, GLUT2 and GLUT3 (Oliveira et al., 2012). In our
experimental conditions, we observed that neither the protein levels
of GLUT1 nor GLUT3 (Fig. 2A) were altered in hSCs after exposure to
EGCG. However, there was a decrease in GLUT2 protein levels in hSCs
exposed to 50μM of EGCG (0.56 ± 0.13 fold variation to the control)
rel-ative to non-exposed hSCs and those exposed to 5μM of EGCG (1.15 ±
0.13 fold variation to the control) (Fig. 2A).
3.3. Exposure of hSCs to 50μM of EGCG stimulated pyruvate consumption
Once glucose enters the cell, a cascade of reactions involving the en-zyme phosphofructokinase 1 (PFK1), leads to the conversion of glucose
to pyruvate (Martins et al., 2013). For that reason, we evaluated PFK1
protein levels, as well as pyruvate consumption by hSCs exposed to EGCG. Concerning PFK1 protein levels, no differences were found
be-tween the experimental groups (Fig. 3A). However, pyruvate
consump-tion increased from 3.28 ± 0.36 pmol/μg protein in the control group to
6.25 ± 0.82 pmol/μg protein by hSCs exposed to 50 μM of EGCG
(Table 2). Exposure of hSCs to 5μM of EGCG led to a pyruvate
consump-tion of 4.09 ± 0.40 pmol/μg protein, which was not significantly
differ-ent relative to control (Table 2).
3.4. Exposure of hSCs to 50μM of EGCG decreased LDH and MCT4 protein
levels, as well as LDH activity
In hSCs, most of the pyruvate produced is converted to lactate by
LDH (Dias et al., 2014b) and then exported to the intratubularfluid by
the monocarboxylate transporter 4 (MCT4) (Galardo et al., 2007). Our
results demonstrated a decrease in LDH protein levels in hSCs exposed
to 50μM of EGCG (0.56 ± 0.03 fold variation to the control) relative
to hSCs from the control group and exposed to 5μM of EGCG (1.08 ±
0.13 fold variation to the control) (Fig. 3A). In addition, LDH activity of
hSCs exposed to 5μM of EGCG was 0.91 ± 0.11 fold variation to the
con-trol, a similar value to cells from the control group (Fig. 3A). There was a
decrease in LDH activity of hSCs after exposure to 50μM of EGCG
(0.06 ± 0.02 fold variation to the control) in comparison to the other
ex-perimental groups (Fig. 3A). Moreover, exposure of hSCs to this dose
also led to decreased protein levels of MCT4 (0.67 ± 0.05 fold variation to the control) comparative to cells from the control group and those
exposed to 5μM of EGCG (1.05 ± 0.07 fold variation to the control)
(Fig. 3A). Despite, hSCs lactate production was not affected by exposure to EGCG (Table 2).
3.5. Alanine production was decreased in hSCs exposed to 50μM of EGCG
Besides being converted to lactate, pyruvate can also be converted to alanine (Kaiser et al., 2005) or it can enter the mitochondria to originate acetyl-CoA (Dias et al., 2014b). Subsequently, acetyl-CoA can lead to
cit-rate (Costello and Franklin, 2006) and/or acetate production
(Yamashita et al., 2006). Our results showed that EGCG did not alter
ac-etate nor citrate production by hSCs (Table 2). However, alanine
pro-duction in hSCs exposed to 50μM of EGCG was decreased (1.79 ±
0.50 pmol/μg protein), relative to the control group (3.13 ± 0.29
pmol/-μg protein) and hSCs exposed to 5 μM of EGCG (3.74 ± 0.65 pmol/pmol/-μg
protein) (Table 2). We also evaluated the ratio lactate/alanine, which
is an index of cellular redox state (Oliveira et al., 2012). hSCs exposed
to 50 μM of EGCG presented an increased lactate/alanine ratio
(23.3 ± 0.8) when compared to the control group (10.4 ± 0.6) and
hSCs exposed to 5μM of EGCG (11.0 ± 0.4).
3.6. Mitochondrial membrane potential was decreased in hSCs exposed to
50μM of EGCG
Mitochondrial electron transport chain (ETC) is one of the main cel-lular generators of ROS. ETC includes four multi-subunit complexes
(complexes I–IV), responsible for oxidative phosphorylation (Turrens,
2003). The electron transport generates an electrochemical proton
gra-dient across the inner mitochondrial membrane, measured as mito-chondrial membrane potential, which drives ATP synthesis by
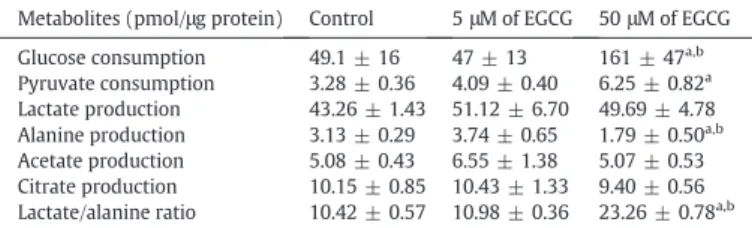
Table 2
Metabolites consumption/production and lactate/alanine ratio in human Sertoli cells from the control group and groups exposed to 5 or 50μM of epigallocatechin-3-gallate (EGCG). Metabolites (pmol/μg protein) Control 5μM of EGCG 50μM of EGCG Glucose consumption 49.1 ± 16 47 ± 13 161 ± 47a,b
Pyruvate consumption 3.28 ± 0.36 4.09 ± 0.40 6.25 ± 0.82a
Lactate production 43.26 ± 1.43 51.12 ± 6.70 49.69 ± 4.78 Alanine production 3.13 ± 0.29 3.74 ± 0.65 1.79 ± 0.50a,b
Acetate production 5.08 ± 0.43 6.55 ± 1.38 5.07 ± 0.53 Citrate production 10.15 ± 0.85 10.43 ± 1.33 9.40 ± 0.56 Lactate/alanine ratio 10.42 ± 0.57 10.98 ± 0.36 23.26 ± 0.78a,b
Results are expressed as mean ± SEM (n = 6 for each condition). Significantly different results (Pb 0.05) are indicated as: a – relative to control; b – relative to 5 μM of EGCG.
Fig. 2. Effect of epigallocatechin-3-gallate (5 and 50μM) in glucose metabolism of human Sertoli cells (hSCs). The figure shows pooled data of independent experiments, indicating glucose transporters (GLUT1, GLUT2 and GLUT3) protein levels (Panel A). Panel B displays the representative blots (of one sample) of GLUT1, GLUT2 and GLUT3. Variation in protein levels is presented as fold variation to the control. Results are expressed as mean ± SEM (n = 6 for each condition). Significantly different results (P b 0.05) are indicated as: a – relative to control; b– relative to 5 μM EGCG.
complex V (Lu and Cao, 2008). Our results did not show significant
al-terations in the protein levels of mitochondrial complexes I–V in hSCs
exposed to EGCG (Table 3). However, JC1 ratio decreased after hSCs
ex-posure to the highest dose of EGCG (50μM) (1.05 ± 0.07) relative to
control group (1.85 ± 0.14) and hSCs exposed to 5 μM of EGCG
(1.80 ± 0.27) (Fig. 4A), showing a decrease in mitochondrial membrane
potential in cells exposed to the highest dose of EGCG. Nevertheless, ox-ygen consumption was similar among the hSCs from the several exper-imental groups (Fig. 4B).
3.7. Exposure of hSCs to 50μM of EGCG decreased protein and lipid
oxidation
As high metabolic rates and mitochondrial activity are usually
asso-ciated with ROS overproduction (Aitken et al., 2010) and EGCG is
known for its antioxidant properties (Lombardo et al., 2011), we
evalu-ated its effects against oxidative damages in hSCs. We quantified the
formation of end-products resultant from protein oxidation or nitration,
as well as lipid peroxidation when cells were exposed to 5 or 50μM of
EGCG. Our data showed decreased levels of carbonyl groups and
nitra-tion in hSCs exposed to 50μM of EGCG (0.86 ± 0.04 and 0.80 ± 0.01
fold variation to the control, respectively) relative to cells exposed to
5μM of EGCG (1.12 ± 0.10 and 1.08 ± 0.10 fold variation to the control,
respectively) (Fig. 5). Exposure of hSCs to 50μM of EGCG also led to de-creased levels of lipid peroxidation (0.85 ± 0.04 fold variation to the
control) comparatively to hSCs from the control group and those
ex-posed to 5μM of EGCG (1.06 ± 0.02 fold variation to the control)
(Fig. 5).
4. Discussion
Oxidative damage to cells and biomolecules has been associated with the pathology of several diseases/dysfunctions, including male fer-tility (Makker et al., 2009). SCs are essential for the successful progres-sion of spermatogenesis since they provide all the metabolic needs to
the developing germ cells (Martins et al., 2013). Modulation of SCs
me-tabolism is essential for spermatogenesis (Rato et al., 2012). Thus, mod-ulators of SCs metabolism can be valuable to counteract male subfertility/infertility in some conditions, and tea constituents have
shown promising results (Dias et al., 2015b; Martins et al., 2014).
Stud-ies focused on the role of EGCG in male fertility are scarce and mostly fo-cused on its effects on sperm quality (De Amicis et al., 2012; Dias et al., 2016a). Since male fertility capacity is highly dependent on hSCs metab-olism, we evaluated the effects of EGCG on those mechanisms. Despite the intricate limitations of the in vitro-in vivo data extrapolations concerning metabolism, we consider that our in vitro model possesses the most important features of SCs in vivo and that the data obtained would be a further step in understanding the effects of EGCG on SCs physiology and function (Reis et al., 2015).
EGCG can be orally consumed in food supplements prepared from very concentrated tea extracts or in infusions (diluted). Although the
bioavailability of EGCG after drinking tea is very low (0.3–0.5 μM)
(Yang et al., 2009), the ingestion of 400–1200 mg of EGCG from a tea
ex-tract (fasting conditions) may result in plasma levels of 2–7 μM (Chow
et al., 2003). Thus, we selected 5μM as the lowest concentration of EGCG in the study. As there are several studies reporting a
pharmaco-logically relevant action of 50μM of EGCG (Albrecht et al., 2008;
Weber et al., 2004), we also evaluated the effects of that concentration as well. The main objective of investigating the effects of this
supraphysiologic dose of EGCG is its possible usage in a specific
treat-ment for male reproductive dysfunctions. We choose to expose hSCs to EGCG for 24 h to mimic a chronic, prolonged and repetitive dose of EGCG in a short-time.
Fig. 3. Effect of epigallocatechin-3-gallate (5 and 50μM) in pyruvate and lactate metabolism of human Sertoli cells (hSCs). The figure shows pooled data of independent experiments, indicating phosphofructokinase 1 (PFK1) protein levels, lactate dehydrogenase (LDH) protein levels and activity, as well as monocarboxylate transporter 4 (MCT4) protein levels (Panel A). Panel B displays the representative blots (of one sample) of PFK1, LDH and MCT4. Variation in protein levels is presented as fold variation to the control. Results are expressed as mean ± SEM (n = 6 for each condition). Significantly different results (P b 0.05) are indicated as: a – relative to control; b – relative to 5 μM EGCG.
Table 3
Protein expression levels of mitochondrial complexes in human Sertoli cells from the con-trol group and groups exposed to 5 or 50μM of epigallocatechin-3-gallate (EGCG).
Mitochondrial complexes Control 5μM of EGCG 50μM of EGCG CI 1.00 ± 0.01 1.05 ± 0.10 1.16 ± 0.15 CII 1.00 ± 0.01 1.05 ± 0.09 1.09 ± 0.12 CIII 1.00 ± 0.01 0.95 ± 0.03 1.00 ± 0.08 CIV 1.00 ± 0.02 1.15 ± 0.07 0.98 ± 0.09 CV 1.00 ± 0.02 0.98 ± 0.07 0.97 ± 0.06 CI: NADH dehydrogenase (ubiquinone) 1 beta subcomplex subunit 8 (NDUFB8); CII: suc-cinate dehydrogenase complex, subunit B, iron sulfur (SDHB); CIII: ubiquinol-cytochrome c reductase core protein II (UQCRC2); CIV: mitochondrially encoded cytochrome c oxidase I (MTCO1); CV: ATP synthase alpha-subunit (ATP5A). Results are expressed as mean ± SEM (fold variation to the control), n = 6 for each condition.
Most of EGCG studies report its cancer-preventive properties (Azam et al., 2004), particularly its ability to act as a potent inhibitor of cell
pro-liferation (Kang, 2015). Previous studies have evidenced significant
metabolic similarities between hSCs and cancer cells (for review (Oliveira et al., 2015a)). Still, studies from our research group have re-ported that the intensive glycolytic activity of hSCs is not always correlat-ed with the proliferative properties of these cells (Dias et al., 2015a; Jesus et al., 2015; Martins et al., 2015), as frequently happens with cancer cells
(for review (Oliveira et al., 2015a)). The results here presented
demon-strated a dose-dependent decrease of hSCs proliferation when exposed
to 5 and 50μM of EGCG, evidencing a clear anti-proliferative effect of
this compound on these testicular cells. This scenario might also be a
re-sult from EGCG cytotoxicity to hSCs. The exposure of hSCs to 50μM of
EGCG during 24 h might overcome the maximum tolerable dose, thus exerting toxicity to hSCs, which results in the observed decrease in hSCs proliferation. However, some caution should be taken when extrapolating these results to an in vivo situation due to the differences in the proliferat-ing ability of Sertoli cells in vitro and in vivo (Reis et al., 2015).
EGCG has been ascribed as modulator of cells metabolism, including
spermatozoa (De Amicis et al., 2012). To investigate the effects of EGCG
Fig. 4. Effect of epigallocatechin-3-gallate (5 and 50μM) in mitochondrial membrane potential and extracellular oxygen consumption of human Sertoli cells (hSCs). The figure shows pooled data of independent experiments, indicating JC1 ratio (Panel A) and extracellular oxygen consumption (Panel B). Results of JC1 are presented as a ratio aggregates/monomers while oxygen consumption is presented asfluorescence intensity in CPS (counts per second). Results are expressed as mean ± SEM (n = 6 for each condition). Significantly different results (Pb 0.05) are indicated as: a – relative to control; b – relative to 5 μM EGCG.
on the metabolic profile of hSCs, we selected key intervenient of the gly-colytic pathway, since glucose is the main metabolic substrate of cultured hSCs and lactate is the key substrate produced by hSCs for developing germ cells (Rato et al., 2012). Exposure of hSCs to the highest
concentra-tion of EGCG (50μM) increased glucose consumption by these cells.
No-tably, a similar effect induced by 40μM of EGCG was reported in muscle
cells (Zhang et al., 2010). In hSCs, glucose uptake is mediated by GLUT1,
GLUT2 and GLUT3 (Oliveira et al., 2012). We have not detected any
alter-ation in GLUT1 or GLUT3 protein levels. Though, there was a decrease in
GLUT2 levels in hSCs exposed to 50μM of EGCG. This suggests that the
in-creased glucose uptake observed was sustained by GLUT1 and GLUT3,
which are described to have a higher affinity for glucose than GLUT2,
allowing cells to withstand a high rate of glucose transport (Wood and
Trayhurn, 2003). Since GLUT2 presents a high Michaelis constant (Km),
its rate of glucose uptake decreases in parallel with the decrease of
glu-cose concentration under the physiological range (Eny et al., 2008).
Thus, the decrease in GLUT2 protein levels, can be a result of an adaptive response to the decrease in glucose concentration related to the consume of glucose present in the culture media (Macheda et al., 2005).
Once inside the cell, glucose is readily converted to pyruvate, in a process involving a rate-limiting step mediated by PFK1, which is a con-trol point of the glycolytic pathway (Rato et al., 2013). The protein levels of this enzyme in hSCs were not altered by exposure to EGCG, suggesting that pyruvate production is not compromised. In hSCs, the great majority of pyruvate is transformed in lactate, by LDH (Dias et al., 2014b), and then transported to the extracellular compartment by MCT4, where it can be
used by developing germ cells (Martins et al., 2013). Exposure of hSCs
to 50μM of EGCG led to a decrease in LDH protein levels and activity,
and also to decreased MCT4 protein levels. Nevertheless, no differences were found in lactate production by hSCs exposed to this concentration of EGCG when compared with the other conditions. These results suggest that as lactate is being produced in normal amounts, LDH and MCT4 protein and/or enzyme activity levels are not rate limiting.
The maintenance of lactate production at control levels by hSCs
ex-posed to 50μM of EGCG is essentially due to the differences in pyruvate
metabolism. Besides the higher pyruvate consumption, we also verified
a decrease in alanine production in these cells. Since alanine is attained from pyruvate in a reversible reaction catalyzed by alanine transami-nase (Miyashita et al., 2007) and its production is decreased in hSCs
ex-posed to EGCG (50μM), our results suggest that the higher pyruvate
consumption is also responsible for the maintenance of the normal pro-duction of lactate. This scenario resulted in the increase of the lactate/al-anine ratio in those cells. Lactate/allactate/al-anine ratio is linked to the
intracellular redox status, since it reflects the NAD+/NADH ratio,
which in turn is directly implicated in energy metabolism. It constitutes
a metabolic node well suited for integration of energy metabolism and
an optimal NAD+/NADH ratio is essential for normal mitochondrial
function (Alves et al., 2013).
The maintenance of pyruvate production by the glycolytic pathway under certain levels is also crucial to maintain a proper mitochondrial function, since it enters the mitochondria to be converted in
acetyl-CoA (Kim, 1997). Then, acetyl-CoA can then enter the Krebs cycle,
where it is converted to citrate (Costello and Franklin, 2006), or it can
be exported to the cytosol and form acetate (Yamashita et al., 2006),
which can be used for fatty acids and cholesterol synthesis (Shimazu
et al., 2010). When there is a Krebs cycle truncation, citrate can also be
transported to the cytosol or to extracellular compartment (Costello
and Franklin, 2006). Since no alterations were found either in acetate or citrate extracellular production by hSCs after exposure to EGCG, we can suggest that pyruvate is not only being used to sustain lactate pro-duction, but also to fuel the Krebs cycle. These results support that the functionality of hSCs Krebs cycle is not being compromised by exposure to EGCG. The normal oxygen consumption among the experimental groups corroborates our data. In fact, if oxygen consumption was
in-creased, oxidative metabolism should be occurring towards CO2
pro-duction. Since oxygen consumption was not affected by exposure to EGCG and neither acetate nor citrate are being exported to the extracel-lular compartment, these two metabolites should be used for storage into lipid synthesis within the cytosol. This may be part of the additional nutritional support of spermatogenesis. However, we detected a de-crease in mitochondrial membrane potential of hSCs exposed to
50μM of EGCG. The same result was observed in a previous study
where hepatocytes were exposed to 30μM of EGCG (Kucera et al.,
2015). Still, no differences were found in the protein levels of
mitochon-drial complexes I–V, which are responsible for oxidative
phosphoryla-tion (OXPHOS) and ATP synthesis (Turrens, 2003). Despite protein
levels of mitochondrial complexes were not altered, EGCG may have some inhibitory effects on the activity of those complexes, as it was
pre-viously described (Valenti et al., 2013; Zheng and Ramirez, 2000). This
may result in a mitochondrial uncoupling, as reported before (Lee and
Kim, 2009), which may also be related to the cytotoxic effect of this dose. Although Krebs cycle homeostasis is not being compromised by exposure of hSCs to EGCG, we observed a dissipation of the mitochon-drial potential, which might be associated with a reprogramming of the cellular metabolic pathways to sustain hSCs substrate requirements (Samudio et al., 2009). On the other hand, it is known that OXPHOS in
mitochondria involves ROS production (Turrens, 2003) and it has
been reported that EGCG can be accumulated in mitochondria modulat-ing OS (Schroeder et al., 2009). In fact, there was a decrease in protein oxidation and nitration, as well as in lipid peroxidation in hSCs exposed
to 50μM of EGCG. This corroborates the protective role attributed to
high doses of EGCG against ROS overproduction (Schroeder et al.,
2009). Hence, EGCG seems to have a dual effect in hSCs mitochondrial
function: while it decreases hSCs mitochondrial functioning, it also pro-tects hSCs from ROS-induced damages due to its potent antioxidant potential.
5. Conclusions
Our study demonstrates a dose-dependent modulating action of EGCG in hSCs metabolism, mitochondrial functionality and oxidative
profile. EGCG at high concentration (50 μM) could modulate hSCs
me-tabolism, maintaining lactate production and Krebs cycle functionality.
Despite 50μM of EGCG might decrease ETC function, Krebs cycle process
was preserved. Additionally, our data suggest that citrate and acetate are being used for storage into lipid synthesis within the cytosol, which might be part of an additional nutritional support for
spermato-genesis. Moreover, 50μM of EGCG was able to decrease oxidative
dam-age to proteins and lipids, which may be of extreme importance in the improvement of spermatogenesis and male fertility, since oxidative
stress is on the basis of several fertility problems (Agarwal et al.,
Fig. 5. Effect of epigallocatechin-3-gallate (5 and 50μM) in oxidative damage levels of human Sertoli cells (hSCs). Thefigure shows pooled data of independent experiments, indicating carbonyl levels, protein nitration and lipid peroxidation. Results are presented as fold variation to control. Results are expressed as mean ± SEM (n = 6 for each condition). Significantly different results (P b 0.05) are indicated as: a – relative to control; b– relative to 5 μM EGCG.
2008). The strong enhancement of glucose uptake verified in hSCs
ex-posed to EGCG supports previously reported benefits of EGCG against
Diabetes Mellitus (Chen et al., 2009; Ortsater et al., 2012), which is
char-acterized by glucose intolerance (Rato et al., 2015) and strongly affects
hSCs function (Dias et al., 2014b). Although the dose of 50μM of EGCG
might not be physiological attained by ingestion of EGCG-rich products, it could be attained with a local administration, supplements or certain medications. Thus, the main objective using this supraphysiologic dose
was indeed to test the possible usage of EGCG in a specific treatment
for male reproductive dysfunctions. Besides, the bioavailability of EGCG to Sertoli cells in vivo should be further investigated. Herein, EGCG is proposed as a novel modulator of cultured hSCs metabolic
and oxidative profiles, which may have important effects in the
nutri-tional support of spermatogenesis, particularly under unfavorable con-ditions, such as those evidenced by men with metabolic diseases. Transparency document
TheTransparency documentassociated with this article can be found, in the online version.
Acknowledgements
This work was supported by “Fundação para a Ciência e a
Tecnologia” - FCT to Tânia R. Dias (SFRH/BD/109284/2015); Marco G.
Alves (SFRH/BPD/80451/2011); Pedro F. Oliveira (SFRH/BPD/108837/ 2015); CICS (UID/Multi/00709/2013), UMIB (PEst-OE/SAU/UI0215/ 2014) and REQUIMTE (UID/QUI/50006/2013). The work was co-funded by FEDER through the COMPETE/QREN, FSE/POPH
(PTDC/BIM-MET/4712/2014 and PTDC/BBB-BQB/1368/2014), and POCI
-COMPETE 2020 (POCI-01-0145-FEDER-007491) funds. The authors want to make a special acknowledgement to M.Sc. Inês Ramos, Depart-ment of Chemistry, Faculty of Pharmacy, University of Porto, for all the
support in thefluorescence assays.
References
Agarwal, A., Makker, K., Sharma, R., 2008.Clinical relevance of oxidative stress in male fac-tor infertility: an update. Am. J. Reprod. Immunol. 59, 2–11.
Aitken, R.J., De Iuliis, G.N., Finnie, J.M., Hedges, A., McLachlan, R.I., 2010.Analysis of the re-lationships between oxidative stress, DNA damage and sperm vitality in a patient population: development of diagnostic criteria. Hum. Reprod. 25, 2415–2426.
Albrecht, D.S., Clubbs, E.A., Ferruzzi, M., Bomser, J.A., 2008.Epigallocatechin-3-gallate (EGCG) inhibits PC-3 prostate cancer cell proliferation via MEK-independent ERK1/ 2 activation. Chem. Biol. Interact. 171, 89–95.
Alves, M.G., Oliveira, P.J., Carvalho, R.A., 2011.Substrate selection in hearts subjected to is-chemia/reperfusion: role of cardioplegic solutions and gender. NMR Biomed. 24, 1029–1037.
Alves, M.G., Socorro, S., Silva, J., Barros, A., Sousa, M., Cavaco, J.E., Oliveira, P.F., 2012.In vitro cultured human Sertoli cells secrete high amounts of acetate that is stimulated by 17β-estradiol and suppressed by insulin deprivation. Biochim. Biophys. Acta, Mol. Cell Res. 1823, 1389–1394.
Alves, M., Neuhaus-Oliveira, A., Moreira, P., Socorro, S., Oliveira, P., 2013.Exposure to 2,4-dichlorophenoxyacetic acid alters glucose metabolism in immature rat Sertoli cells. Reprod. Toxicol. 38, 81–88.
Alves, M.G., Dias, T.R., Silva, B.M., Oliveira, P.F., 2014.Metabolic cooperation in testis as a pharmacological target: from disease to contraception. Curr. Mol. Pharmacol. 7, 83–95.
Azam, S., Hadi, N., Khan, N.U., Hadi, S.M., 2004.Prooxidant property of green tea polyphe-nols epicatechin and epigallocatechin-3-gallate: implications for anticancer proper-ties. Toxicol. In Vitro 18, 555–561.
Chen, N., Bezzina, R., Hinch, E., Lewandowski, P.A., Cameron-Smith, D., Mathai, M.L., Jois, M., Sinclair, A.J., Begg, D.P., Wark, J.D., 2009.Green tea, black tea, and epigallocatechin modify body composition, improve glucose tolerance, and differentially alter meta-bolic gene expression in rats fed a high-fat diet. Nutr. Res. 29, 784–793.
Chow, H.S., Cai, Y., Hakim, I.A., Crowell, J.A., Shahi, F., Brooks, C.A., Dorr, R.T., Hara, Y., Alberts, D.S., 2003.Pharmacokinetics and safety of green tea polyphenols after multiple-dose administration of epigallocatechin gallate and polyphenon E in healthy individuals. Clin. Cancer Res. 9, 3312–3319.
Costello, L.C., Franklin, R.B., 2006.The clinical relevance of the metabolism of prostate can-cer; zinc and tumor suppression: connecting the dots. Mol. Cancer 5, 17.
De Amicis, F., Santoro, M., Guido, C., Russo, A., Aquila, S., 2012.Epigallocatechin gallate af-fects survival and metabolism of human sperm. Mol. Nutr. Food Res. 56, 1655–1664.
Dias, T.R., Rato, L., Martins, A.D., Simões, V.L., Jesus, T.T., Alves, M.G., Oliveira, P.F., 2013. In-sulin deprivation decreases caspase-dependent apoptotic signaling in cultured rat Sertoli cells. ISRN Urol. 2013, 970370.
Dias, T.R., Alves, M.G., Oliveira, P.F., Silva, B.M., 2014a.Natural products as modulators of spermatogenesis: the search for a male contraceptive. Curr. Mol. Pharmacol. 7, 154–166.
Dias, T.R., Alves, M.G., Silva, B.M., Oliveira, P.F., 2014b.Sperm glucose transport and me-tabolism in diabetic individuals. Mol. Cell. Endocrinol. 396, 37–45.
Dias, T.R., Alves, M.G., Tomás, G.D., Socorro, S., Silva, B.M., Oliveira, P.F., 2014c.White tea as a promising antioxidant medium additive for sperm storage at room temperature: a comparative study with green tea. J. Agric. Food Chem. 62, 608–617.
Dias, T.R., Alves, M.G., Almeida, S.P., Silva, J., Barros, A., Sousa, M., Silva, B.M., Silvestre, S.M., Oliveira, P.F., 2015a.Dehydroepiandrosterone and 7-oxo-dehydroepiandrosterone in male reproductive health: implications of differential regulation of human Sertoli cells metabolic profile. J. Steroid Biochem. Mol. Biol. 154, 1–11.
Dias, T.R., Alves, M.G., Bernardino, R.L., Martins, A.D., Moreira, A.C., Silva, J., Barros, A., Sousa, M., Silva, B.M., Oliveira, P.F., 2015b.Dose-dependent effects of caffeine in human Sertoli cells metabolism and oxidative profile: relevance for male fertility. Toxicology 328, 12–20.
Dias, T.R., Alves, M.G., Casal, S., Silva, B.M., Oliveira, P.F., 2016a.The single and synergistic effects of the major tea components caffeine, epigallocatechin-3-gallate and l-theanine on rat sperm viability. Food Funct. 7, 1301–1305.
Dias, T.R., Alves, M.G., Rato, L., Casal, S., Silva, B.M., Oliveira, P.F., 2016b.White tea intake prevents prediabetes-induced metabolic dysfunctions in testis and epididymis pre-serving sperm quality. J. Nutr. Biochem. 37, 83–93.
Eny, K.M., Wolever, T.M., Fontaine-Bisson, B., El-Sohemy, A., 2008.Genetic variant in the glucose transporter type 2 is associated with higher intakes of sugars in two distinct populations. Physiol. Genomics 33, 355–360.
Fricker, S., 1994.The application of sulforhodamine B as a colorimetric endpoint in a cy-totoxicity assay. Toxicol. In Vitro 8, 821–822.
Galardo, M.N., Riera, M.F., Pellizzari, E.H., Cigorraga, S.B., Meroni, S.B., 2007.The AMP-activated protein kinase activator, 5-aminoimidazole-4-carboxamide-1-bD-ribonu-cleoside, regulates lactate production in rat Sertoli cells. J. Mol. Endocrinol. 39, 279–288.
Ivell, R., 2007.Lifestyle impact and the biology of the human scrotum. Reprod. Biol. Endocrinol. 5, 1477–1482.
Jesus, T.T., Oliveira, P.F., Silva, J., Barros, A., Ferreira, R., Sousa, M., Cheng, C.Y., Silva, B.M., Alves, M.G., 2015.Mammalian target of rapamycin controls glucose consumption and redox balance in human Sertoli cells. Fertil. Steril. 105, 825–833.
Kaiser, G.R., Monteiro, S.C., Gelain, D.P., Souza, L.F., Perry, M.L., Bernard, E.A., 2005. Metab-olism of amino acids by cultured rat Sertoli cells. MetabMetab-olism 54, 515–521.
Kang, H.W., 2015.Inhibitory effect of cancer cells proliferation from epigallocatechin-3-O-gallate. J. Food Nutr. Res. 3, 281–284.
Khan, N., Mukhtar, H., 2007.Tea polyphenols for health promotion. Life Sci. 81, 519–533.
Kim, K.-H., 1997.Regulation of mammalian acetyl-coenzyme A carboxylase. Annu. Rev. Nutr. 17, 77–99.
Kucera, O., Mezera, V., Moravcova, A., Endlicher, R., Lotkova, H., Drahota, Z., Cervinkova, Z., 2015.In vitro toxicity of epigallocatechin gallate in rat liver mitochondria and hepa-tocytes. Oxidative Med. Cell. Longev. 2015.
Lee, M.-S., Kim, Y., 2009.(−)-Epigallocatechin-3-gallate enhances uncoupling protein 2 gene expression in 3T3-L1 adipocytes. Biosci. Biotechnol. Biochem. 73, 434–436.
Lombardo, F., Sansone, A., Romanelli, F., Paoli, D., Gandini, L., Lenzi, A., 2011.The role of antioxidant therapy in the treatment of male infertility: an overview. Asian J. Androl. 13, 690–697.
Lu, H., Cao, X., 2008.GRIM-19 is essential for maintenance of mitochondrial membrane potential. Mol. Biol. Cell 19, 1893–1902.
Macheda, M.L., Rogers, S., Best, J.D., 2005.Molecular and cellular regulation of glucose transporter (GLUT) proteins in cancer. J. Cell. Physiol. 202, 654–662.
Makker, K., Agarwal, A., Sharma, R., 2009.Oxidative stress & male infertility. Indian J. Med. Res. 129, 357–367.
Martins, A.D., Alves, M.G., Simões, V.L., Dias, T.R., Rato, L., Moreira, P.I., Socorro, S., Cavaco, J.E., Oliveira, P.F., 2013.Control of Sertoli cell metabolism by sex steroid hormones is mediated through modulation in glycolysis-related transporters and enzymes. Cell Tissue Res. 354, 861–868.
Martins, A.D., Alves, M.G., Bernardino, R.L., Dias, T.R., Silva, B.M., Oliveira, P.F., 2014.Effect of white tea (Camellia sinensis (L.)) extract in the glycolytic profile of Sertoli cell. Eur. J. Nutr. 53, 1383–1391.
Martins, A.D., Moreira, A.C., Sá, R., Monteiro, M.P., Sousa, M., Carvalho, R.A., Silva, B.M., Oliveira, P.F., Alves, M.G., 2015.Leptin modulates human Sertoli cells acetate produc-tion and glycolytic profile: a novel mechanism of obesity-induced male infertility? Biochim. Biophys. Acta (BBA) - Mol. Basis Dis. 1852, 1824–1832.
Miyashita, Y., Dolferus, R., Ismond, K.P., Good, A.G., 2007.Alanine aminotransferase catal-yses the breakdown of alanine after hypoxia in Arabidopsis thaliana. Plant J. 49, 1108–1121.
Oliveira, P.F., Sousa, M., Barros, A., Moura, T., da Costa, A.R., 2009.Intracellular pH regula-tion in human Sertoli cells: role of membrane transporters. Reproducregula-tion 137, 353–359.
Oliveira, P.F., Alves, M.G., Rato, L., Laurentino, S., Silva, J., Sa, R., Barros, A., Sousa, M., Carvalho, R.A., Cavaco, J.E., 2012.Effect of insulin deprivation on metabolism and metabolism-associated gene transcript levels of in vitro cultured human Sertoli cells. Biochim. Biophys. Acta 1820, 84–89.
Oliveira, P.F., Martins, A.D., Moreira, A.C., Cheng, C.Y., Alves, M.G., 2015a.The Warburg ef-fect revisited—lesson from the Sertoli cell. Med. Res. Rev. 35, 126–151.
Oliveira, P.F., Tomás, G.D., Dias, T.R., Martins, A.D., Rato, L., Alves, M.G., Silva, B.M., 2015b.
White tea consumption restores sperm quality in prediabetic rats preventing testicu-lar oxidative damage. Reprod. BioMed. Online 31, 544–556.
Ortsater, H., Grankvist, N., Wolfram, S., Kuehn, N., Sjoholm, A., 2012.Diet supplementation with green tea extract epigallocatechin gallate prevents progression to glucose intol-erance in db/db mice. Nutr. Metab. (Lond.) 9, 11.
Rato, L., Alves, M.G., Socorro, S., Duarte, A.I., Cavaco, J.E., Oliveira, P.F., 2012.Metabolic reg-ulation is important for spermatogenesis. Nat. Rev. Urol. 9, 330–338.
Rato, L., Alves, M.G., Dias, T.R., Lopes, G., Cavaco, J.E., Socorro, S., Oliveira, P.F., 2013. High-energy diets may induce a pre-diabetic state altering testicular glycolytic metabolic profile and male reproductive parameters. J. Androl. 1, 495–504.
Rato, L., Alves, M., Dias, T., Cavaco, J., Oliveira, P.F., 2015.Testicular metabolic reprogramming in neonatal streptozotocin-induced type 2 diabetic rats impairs gly-colyticflux and promotes glycogen synthesis. J. Diabetes Res. 2015, 973142.
Reis, M., Moreira, A.C., Sousa, M., Mathur, P.P., Oliveira, P.F., Alves, M.G., 2015.Sertoli cell as a model in male reproductive toxicology: advantages and disadvantages. J. Appl. Toxicol. 35, 870–883.
Salvioli, S., Ardizzoni, A., Franceschi, C., Cossarizza, A., 1997.JC-1, but not DiOC 6 (3) or rhodamine 123, is a reliablefluorescent probe to assess ΔΨ changes in intact cells: implications for studies on mitochondrial functionality during apoptosis. FEBS Lett. 411, 77–82.
Samudio, I., Fiegl, M., Andreeff, M., 2009.Mitochondrial uncoupling and the Warburg ef-fect: molecular basis for the reprogramming of cancer cell metabolism. Cancer Res. 69, 2163–2166.
Schroeder, E.K., Kelsey, N.A., Doyle, J., Breed, E., Bouchard, R.J., Loucks, F.A., Harbison, R.A., Linseman, D.A., 2009.Green tea epigallocatechin 3-gallate accumulates in mitochon-dria and displays a selective antiapoptotic effect against inducers of mitochonmitochon-drial oxidative stress in neurons. Antioxid. Redox Signal. 11, 469–480.
Shimazu, T., Hirschey, M.D., Huang, J.-Y., Ho, L.T., Verdin, E., 2010.Acetate metabolism and aging: an emerging connection. Mech. Ageing Dev. 131, 511–516.
Turrens, J.F., 2003.Mitochondrial formation of reactive oxygen species. J. Physiol. 552, 335–344.
Valenti, D., de Bari, L., Manente, G.A., Rossi, L., Mutti, L., Moro, L., Vacca, R.A., 2013. Nega-tive modulation of mitochondrial oxidaNega-tive phosphorylation by epigallocatechin-3 gallate leads to growth arrest and apoptosis in human malignant pleural mesotheli-oma cells. Biochim. Biophys. Acta (BBA) - Mol. Basis Dis. 1832, 2085–2096.
Weber, A.-A., Neuhaus, T., Skach, R.A., Hescheler, J., Ahn, H.-Y., Schrör, K., Ko, Y., Sachinidis, A., 2004.Mechanisms of the inhibitory effects of epigallocatechin-3 gallate on platelet-derived growth factor-BB-induced cell signaling and mitogenesis. FASEB J. 18, 128–130.
Wood, I.S., Trayhurn, P., 2003.Glucose transporters (GLUT and SGLT): expanded families of sugar transport proteins. Br. J. Nutr. 89, 3–9.
Yamashita, H., Itsuki, A., Kimoto, M., Hiemori, M., Tsuji, H., 2006.Acetate generation in rat liver mitochondria; acetyl-CoA hydrolase activity is demonstrated by 3-ketoacyl-CoA thiolase. Biochim. Biophys. Acta Mol. Cell Biol. Lipids 1761, 17–23.
Yang, C.S., Wang, X., Lu, G., Picinich, S.C., 2009.Cancer prevention by tea: animal studies, molecular mechanisms and human relevance. Nat. Rev. Cancer 9, 429–439.
Zhang, Z.F., Li, Q., Liang, J., Dai, X.Q., Ding, Y., Wang, J.B., Li, Y., 2010. Epigallocatechin-3-O-gallate (EGCG) protects the insulin sensitivity in rat L6 muscle cells exposed to dexa-methasone condition. Phytomedicine 17, 14–18.
Zheng, J., Ramirez, V.D., 2000.Inhibition of mitochondrial proton F0F1-ATPase/ATP syn-thase by polyphenolic phytochemicals. Br. J. Pharmacol. 130, 1115–1123.