Belief in a zero-sum game and subjective well-being
across 35 countries
Joanna Różycka-Tran1
&Jarosław P. Piotrowski2
&MagdalenaŻemojtel-Piotrowska2&Paweł Jurek1
&Evgeny N. Osin3&
Byron G. Adams4,5&Rahkman Ardi6&Sergiu Bălțătescu7&Arbinda Lal Bhomi8&Sergey A. Bogomaz9&Jan Cieciuch2& Amanda Clinton10&Gisela T. de Clunie11&Anna Z. Czarna12&Carla Sofia Esteves13&Valdiney Gouveia14&
Murnizam H. J. Halik15&Narine Kachatryan16&Shanmukh Vasant Kamble17&Anna Kawula2&
Martina Klicperova-Baker18&Aituar Kospakov19&Eva Letovancova20&Vivian Miu-Chi Lun21&Sara Malo Cerrato22& Stephan Muehlbacher23&Marija Nikolic24&Alina A. Pankratova25&Joonha Park26&Elena Paspalanova27&
Győző Pék28
&Pablo Pérez de León29&Iva Poláčková Šolcová18
&Wahab Shahbaz30&Truong Thi Khanh Ha31&
Habib Tiliouine32&Alain Van Hiel33&Christin-Melanie Vauclair13&Eduardo Wills-Herrera34&Anna Włodarczyk35,36& Illia I. Yahiiaiev37&John Maltby38
# The Author(s) 2019 Abstract
This article presents a short research report on the relationship between perceived antagonism in social relations measured using the Belief in a Zero-Sum Game (BZSG) scale, life satisfaction, and positive and negative affect. Given that individuals who believe that life is like a zero-sum game are likely to perceive their daily interactions with others as unfair, we expected that individuals with high BZSG experience more negative affect and fewer positive one, resulting in a lower satisfaction with life. In addition, we examined whether country-level BZSG may play a moderating role in these associations. Data were collected from student samples (N = 7146) in 35 countries. Multilevel modelling revealed that perceived social antagonism in social relations is negatively associated with satisfaction with life and that this relationship is mediated by both positive and negative affect at the individual level. The relation of individual BZSG and negative affect on satisfaction with life were weaker in societies with higher country-level BZSG, suggesting that the effects of BZSG may be less detrimental in these countries. These findings extend previous knowledge about predictors of life satisfaction and suggest that social beliefs might also be an important factor that influences subjective well-being. The contribution of the study is that the separate treatment of life satisfaction and positive and negative affect may be helpful in many research situations, particularly from a cross-cultural perspective.
Keywords Belief in a zero-sum game . Subjective well-being . SWLS . MML
Introduction
Belief in a zero-sum game (BZSG) is based on an im-plicit assumption of limited resources, so that whenever a person wins or gains a benefit, other people must lose. Stemming from game theory (Von Neumann and
Morgenstern 1944), it describes a relatively firm and axiomatic conviction about the nature of social relations. BZSG is defined as a “general belief about the antago-nistic nature of social relations, shared by people in a society or culture and based on the implicit assumption that a finite amount of goods exists in the world, in which one person’s winning makes others the losers” (Różycka-Tran et al. 2015, p. 526).
This belief can be measured using the BZSG scale: past studies have confirmed the measurement invariance of the BZSG scale across 36 countries (Różycka-Tran et al. 2017) and revealed an isomorphic factor structure of social antagonism in relations (BZSG) at both * Joanna Różycka-Tran
Extended author information available on the last page of the article
individual and country levels (Różycka-Tran et al. 2018). What is interesting, cross-cultural studies based on data from 30 countries showed that BZSG is related to military expenditure and low civil liberties (Różycka-Tran et al. 2019). Furthermore, several experimental and correlational studies have been performed using different samples, showing that BZSG correlates with a host of judgmental and behavioural variables, both at the indi-vidual and country level (Różycka-Tran et al. 2015; see for review).
In particular, a negative association between BZSG and Subjective Well-Being (SWB) was found at the country level; this link is still unexplored at the individ-ual level, whereas we believe that some of the mecha-nisms linking the two constructs can be found. Individuals with high levels of BZSG should be prone to perceiving their daily relations with others as antag-onistic and thus behaving in antagantag-onistic ways (e.g., competing for resources they tend to perceive as limit-ed), rather than engaging in unselfish exchanges (e.g., by offering and receiving social support). As a result, they should face more dissatisfying emotional experi-ences in their daily lives and ultimately be less satisfied with their lives.
However, because BZSG is both an individual and a social phenomenon, the effects of individual-level BZSG may be different in societies with different levels of country-level BZSG. This is similar to findings in game theory studies, showing that although cooperative socie-ties have an advantage in the long term, at the individ-ual level uncooperative behaviour may be beneficial in the short term and may actually be the only viable strategy in groups comprised of uncooperative individ-uals (Clark et al. 2015). Similarly, we believe that in societies with high country-level BZSG, antagonistic in-teraction patterns may enable individuals to reap and enjoy the satisfying life outcomes they seek (and the associated emotional discomfort may be seen as an un-avoidable and acceptable necessity). Based on these ex-pectations, we aimed to investigate the associations of individual-level and social-level BZSG with SWB.
The prevalent model of SWB defines it as a combi-nation of satisfaction with life (cognitive judgments, SWL) and affective reactions; a preponderance of posi-tive affect (PA) over negaposi-tive affect (NA) (Diener et al. 2003). Although cognitive and affective evaluations of life tend to correlate strongly and are often treated as components of a single construct, they also show a number of unique empirical effects, both at the level of individuals (i.e., within country: Eid and Larsen 2008) and that of cultures (i.e., between countries: Brulé and Veenhoven 2015). This is to be expected, given that emotional reactions are more strongly
influenced by current events and activities and tend to fluctuate with time, whereas life satisfaction judgments are based on more stable sources of information, such as general evaluations of life conditions or domains (Tov 2018). With respect to affective reactions, there is vast evidence that PA and NA are largely indepen-dent phenomena, both at the level of subjective self-reports (Watson and Clark 1999) and that of corre-sponding brain structures (Lindquist et al. 2015). Based on these findings, we investigate the components of SWB separately in the present study.
We a l s o n o t i c e d , t h a t d i ff e r e n t s t u d i e s h a v e established a wide range of variables that influence SWB, such as income, demographics, social behaviour, personality, identity, values, climate, and genetic factors (e.g., Minkov and Bond 2017; Diener et al. 2018). However, the associations of perceived antagonism in social relations and components of SWB have never been examined across cultures; the present study aims to fill this gap.
Hypotheses
We sought to explore the evidence concerning the ex-pectation that individuals with higher levels of BZSG would face fewer satisfying experiences in their daily interactions with others, which could explain their lower SWL. This idea is in line with prior findings in East Asian student samples, showing that daily affect medi-ates the association between a positive perception of one’s social environment (perceived social support) and life satisfaction (Matsuda et al. 2014).
Moreover, we sought to examine whether perceived antagonism in social relations (essentially a negative per-ception of one’s social environment) would exhibit an inverse effect. Consequently, we expected that higher levels of BZSG would be associated with experiencing more NA and less PA on a daily basis and that these affective experiences would mediate the negative associ-ation between BZSG and life satisfaction (Hypothesis 1). We also expected that, despite involving negative emotional experiences, antagonistic interactions might be instrumental as a means to achieve important indi-vidual goals. In societies in which high country-level BZSG is common, such interactions may be perceived as legit and acceptable and individuals with higher levels of BZSG may find it easier to adapt to the social reality and to enjoy higher levels of SWL. Thus, we expected to find a cross-level interaction effect between country-level BZSG and individual-level BZSG on SWL (Hypothesis 2a). Additionally, in societies where BZSG is widespread, the negative affective experiences of
daily life may be perceived as unavoidable and may not impact the general evaluations of life as adversely as they would in a society with lower country-level BZSG. Thus, we expected to find cross-level interac-tions between country-level BZSG and individual-level NA on SWL (Hypothesis 2b).1
Method
Participants
Data were collected from students (N = 7146; 38.8% men) in 35 countries as part of a broader research project including other measures of subjective well-being: Personal Well-being Index, Satisfaction with Life Scale, Positive and Negative Affect Schedule, and two scales measuring Entitlement Attitudes (see: Różycka-Tran et al. 2017; Żemojtel-Piotrowska et al.2018). We tried to include countries from all continents, differentiated in culture, economics and
politics, using either a paper-pencil or online format (see Table1for details).
We targeted samples of university students aged under 30 and majoring in social sciences, humanities, or business. Students were recruited during their classes and did not receive any financial remuneration for participating in the study but received extra credit points in several countries. Students were asked about their gender, age, major, and financial status of their families. Informed consent was obtained from all participants prior to participating in the study. Ethical approval was obtained from ethical committees in particular universities. The mean age of participants was 21.71 years (SD = 4.93). Descriptive statistics and internal consistency coefficients for all measures by country are presented in Table1.
Measures and procedure
Based on Diener’s model of SWB, we measured both its cog-nitive component (using the Satisfaction with Life Scale, SWLS: Diener et al. 1985) and affective component (using the Positive and Negative Affect Schedule, PANAS: Watson et al.1988).
The SWLS (Diener et al. 1985) is a five-item scale de-signed to capture global cognitive judgments about life satis-faction. Responses to items (e.g.,“In most ways my life is close to my ideal”; “So far I have got the important things I want in life”) were given on a five-point scale (ranging from 1 = strongly disagree to 5 = strongly agree).
The PANAS (Watson et al.1988) comprises two 10-item mood scales consisting of brief descriptions of PA (e.g., en-thusiastic; happy) and NA (e.g., frightened; upset). We asked participants to indicate to what extent each item represented how they usually felt, using a scale ranging from 1 (very slightly or not at all true of me) to 5 (extremely true of me).
Perceived antagonism in social relations was measured using the BZSG scale (Różycka-Tran et al. 2015,2017). It consists of eight items (e.g.,“The successes of some people are usually the failures of others”; “Life is so devised that when somebody gains, others have to lose”, “In most situa-tions interests of different people are inconsistent”). The re-sponses are given on a six-point Likert scale (ranging from 1 = strongly disagree to 6 = strongly agree).
All the scales were translated into the following lan-guages: Arabic, Armenian, Bahasa, Bulgarian, Czech, Chinese (Cantonese), Flemish, German, Hungarian, Korean, Malay, Polish, Romanian, Serbian, Slovak, Portuguese, Spanish, Russian, and Vietnamese (all ver-sions available at: www.crossculturalpsychlab.com). Culture-specific versions of all scales were devised using a back-translation procedure; where the English version was used as the basis for all translations. Bilingual individuals working in the field of psychology translated the scales.
1The initial version of the paper was based on the moderation hypothesis.
However, the reviewers pointed out that our theoretical rationale was more
consistent with a mediation hypothesis. Following the reviewers’ suggestions,
we explained the theoretical rationale for both the moderation and the media-tion hypotheses that rested on different theoretical interpretamedia-tions of the
Negative Affect (NA) indicator (as measured by PANAS with an“ïn general”
instruction). On the one hand, this indicator may reflect a retrospective gener-alization of daily affective states which may reflect the outcomes of social interactions and should, therefore, mediate the effects of BZSG on satisfaction
with life (in line with prior research of Matsuda et al.2014). On the other hand,
the NA indicator may also reflect trait negative affectivity, a disposition to
experience aversive emotional states (Suls et al.1998; Watson and Clark
1984,1999), which should be associated with higher sensitivity or reactivity
to interpersonal interactions evaluated as negative due to BZSG. The models we had used at the time supported both hypotheses, but the reviewers asked us to explain how the two hypotheses were compatible. At that stage, we redid the data analyses and realized that the earlier draft of the paper contained a mul-tilevel model which conflated the individual-level and country-level variance in the interaction effect. Although the reviewers had not pointed it out, we redid the data analyses completely based on a more rigorous unconflated
MSEM model (Preacher et al.2010) and found no support for the moderation
hypothesis at both levels. At the same time, as we revised our methodology paying particular attention to separating the individual-level and country-level effects, we realized that the interaction effects we had expected at the begin-ning should be very different for the individual-level and the country-level BZSG. Following this, we formulated and tested the new cross-level interac-tion hypotheses. During a subsequent revision, the reviewers asked us for more development of the theoretical rationale concerning the cross-level interactions and also pointed out that the mediation and moderation hypotheses seemed
incompatible, as they rested on different (“state” vs. “trait”) theoretical
inter-pretations of the NA measure. Although it is empirically possible for the same variable to be both a mediator and a moderator even within one model
(Preacher and Hayes2008), we decided to drop the moderation hypothesis
for two reasons. Firstly, it was too far-fetched, because the sensitivity to neg-ative stimuli should be predicted by neuroticism, which is only modestly
related to trait negative affect (r =−.30 based on meta-analysis of 41 studies
by DeNeve and Cooper1998); thus, it was no surprise that we did not discover
an interaction. Secondly, keeping this untenable hypothesis and reconciling it theoretically with Hypothesis 1 would require very much space in this short report paper.
Table 1 Descriptive statistic s and reliability of scales for th e 35 countries Country N Fe ma le % Age M( S D ) Language P rocedure S atisfaction w it h life P ositive af fect Negative af fe ct Belief in a Z ero-Sum G ame (BZSG) MS D α MS D α MS D α MS D α Alge ri a 239 61. 25 19 .54 (1. 58) Ara bic Pa pe r-p en cil 3. 32 .81 .72 3.3 1 .59 .6 9 2. 29 .68 .77 3. 39 1.0 7 .79 Arm en ia 223 47. 98 19 .00 (1. 17) Arm en ian Pa pe r-p en cil 3. 18 .77 .76 3.7 8 .61 .8 2 2. 69 .62 .74 3. 41 0.9 3 .79 Aze rbai jan 118 60. 83 20 .83 (1. 95) Ru ssi an Onlin e 3. 02 .66 .75 3.2 8 .67 .8 3 2. 51 .73 .84 3. 22 0.9 7 .89 Aus tria 130 63. 60 25 .24 (4. 83) Ger ma n Pa pe r-p en cil 3. 89 .61 .79 3.5 6 .53 .8 2 2. 24 .65 .85 2. 75 .92 .86 Belg ium 222 74. 14 19 .74 (3. 95) Fl em ish O nlin e 3 .3 9 .80 .84 3 .3 5 .49 .7 0 2 .3 9 .61 .80 2 .9 6 .88 .84 Bra zil 230 63. 68 20 .94 (5. 21) Po rtu gue se Pa pe r-p en cil 3. 50 .74 .81 3.4 1 .63 .8 6 2. 55 .67 .79 2. 81 .84 .79 Bulga ria 202 66. 00 23 .59 (5. 25) Bu lga ri an P ape r-p en cil 3. 43 .79 .80 3.5 5 .54 .7 7 2. 08 .71 .87 2. 93 1.0 0 .87 Chile 240 52. 28 22 .00 (2. 10) Sp an ish P ape r-p en cil 3. 64 .66 .79 3.4 5 .60 .8 1 2. 53 .68 .83 2. 65 1.0 4 .88 Colom b ia 140 50. 00 18 .82 (1. 72) Sp an ish O nlin e 3 .8 4 .65 .75 3 .6 2 .58 .8 0 2 .8 2 .74 .85 2 .9 3 1 .0 6 .89 Cze ch R epu blic 231 74. 89 24 .52 (7. 75) Cz ec h P ape r-p en cil 3. 39 .72 .79 3.2 0 .59 .8 4 2. 17 .63 .84 2. 53 .75 .87 Hon g Kon g 172 68. 02 18 .82 (1. 16) Engl ish P ape r-p en cil 3. 24 .69 .85 3.1 7 .53 .8 3 2. 78 .67 .87 3. 86 .73 .85 Hun gar y 205 68. 93 21 .00 (1. 68) Hung ar ia n P ape r-p en cil 3. 70 .66 .76 3.2 0 .67 .8 5 1. 58 .57 .84 2. 80 .91 .86 In dia 200 68. 50 22 .59 (1. 45) Engl ish P ape r-p en cil 3. 81 .69 .76 4.0 5 .50 .7 3 2. 39 .70 .78 3. 75 1.0 4 .79 In don es ia 200 50. 00 21 .38 (1. 65) Ba ha sa Onlin e 3. 03 .71 .80 3.7 5 .53 .8 0 2. 79 .76 .86 3. 1 1 1.0 5 .88 Kaz akhs tan 275 74. 74 20 .12 (2. 32) Ru ssi an Onlin e 3. 39 .72 .82 3.4 5 .69 .9 0 2. 15 .75 .88 3. 30 1.0 1 .90 Ken ya 162 53. 09 23 .49 (4. 54) Engl ish P ape r-p en cil 3. 14 .83 .75 3.6 4 .61 .7 1 2. 49 .99 .92 3. 16 1.1 5 .88 Kor ea (S) 212 54. 72 22 .20 (1. 91) Kor ea n Pa pe r-p en cil 3. 06 .67 .83 3.0 4 .52 .7 6 2. 85 .67 .86 3. 45 .86 .89 Lat via 228 72. 40 27 .80 (7. 91) Ru ssi an Onlin e 3. 15 .72 .85 3.1 6 .57 .8 8 2. 40 .69 .90 3. 68 1.0 6 .94 Ma la ysia 200 50. 25 21 .96 (1. 22) Ma la y P ape r-p en cil 3. 37 .64 .73 3.3 7 .61 .8 4 2. 83 .65 .83 3. 63 1.0 4 .89 Nep al 203 49. 75 22 .70 (4. 44) Engl ish P ape r-p en cil 3. 27 .60 .45 3.3 5 .57 .6 8 2. 47 .64 .75 3. 75 .87 .76 Pana ma 176 33. 53 21 .41 (5. 08) Sp an ish O nlin e 3. 57 .73 .78 3.6 1 .61 .8 0 2. 37 .72 .83 3. 10 1.0 4 .85 Paki sta n 200 49. 00 21 .50 (1. 59) Engl ish P ape r-p en cil 3. 32 .59 .59 3.4 1 .58 .7 2 2. 99 .73 .63 3. 43 1.0 2 .87 Pola nd 263 60. 79 22 .31 (4. 14) Po lish P ape r-p en cil 3. 30 .72 .82 3.4 1 .52 .7 5 2. 72 .71 .85 2. 95 1.0 6 .91 Port uga l 197 77. 20 22 .18 (5. 73) Po rtu gue se Onlin e 3. 51 .70 .81 3.5 1 .54 .8 4 2. 27 .69 .86 2. 84 .94 .87 Puer to Ric o 300 42. 67 20 .26 (2. 23) Sp an ish P ape r-p en cil 3. 55 .74 .78 3.5 5 .68 .8 1 2. 52 .75 .81 3. 15 1.0 8 .84 Roma nia 21 1 48. 54 21 .33 (3. 47) Ro ma nia n Pa pe r-p en cil 3. 57 .69 .80 3.3 6 .57 .8 0 2. 06 .64 .83 3. 35 1.1 0 .90 Russi a 228 79. 48 21 .64 (4. 13) Ru ssi an Onlin e 3. 09 .78 .82 3.1 3 .70 .8 8 2. 54 .81 .89 2. 84 .87 .89 Ser bia 204 60. 98 22 .46 (5. 75) Se rbia n P ape r-p en cil 3. 20 .79 .82 3.4 0 .66 .8 5 2. 19 .76 .87 3. 49 1.1 1 .89 Slova ki a 202 71. 78 21 .13 (1. 26) Sl ova k P ape r-p en cil 3. 52 .70 .80 3.3 9 .52 .7 7 2. 52 .60 .82 3. 04 .77 .84 Spai n 200 50. 51 21 .02 (4. 66) Sp an ish O nlin e 3. 74 .63 .74 3.3 8 .50 .7 2 2. 45 .67 .83 3. 47 1.0 7 .87 Rep ubli c of South A fr ic a 188 67. 20 20 .17 (1. 86) Engl ish P ap er -p en cil 3 .4 3 .69 .72 3 .6 7 .67 .8 3 2 .5 0 .78 .83 3 .3 4 .99 .85 Ukr ai ne 169 80. 70 19 .86 (2. 66) Ru ssi an Onlin e 3. 12 .71 .79 3.3 7 .64 .8 6 2. 27 .71 .85 2. 92 .93 .88 Uru gua y 203 80. 71 23 .51 (6. 14) Sp an ish P ape r-p en cil 3. 65 .60 .73 3.4 7 .56 .7 9 2. 47 .67 .86 2. 42 .77 .82 USA 1 16 68. 10 25 .76 (10 .34 ) Engl ish O nlin e 3 .4 9 .77 .86 3 .6 6 .66 .8 7 2 .2 6 .76 .88 3 .1 8 .93 .89 V iet na m 257 52. 19 20 .51 (2. 68) V ietn am es e Pa pe r-p en cil 3. 08 .76 .80 3.4 7 .58 .8 1 2. 60 .73 .85 3. 64 .95 .83 Ove ra ll 714 6 61. 31 21 .81 (4. 97) 19 la n gua ge s 3. 38 .74 .78 3.4 4 .62 .8 2 2. 45 .75 .85 3. 19 1.0 4 .88
We also ran measurement invariance analyses to ensure metric invariance of the instruments (BZSG: Różycka-Tran et al.2017; SWLS and PANAS: Piotrowski et al.2016).
Results
The proportion of missing data was small (0.29%, or 473 cases with 1 to 8 responses missing) and we used Expectation Maximization algorithm to impute the missing responses. The correlations between the measures at the indi-vidual level and at the country level, together with reliability (Cronbach’s alpha), are presented in Table2. Because of clus-tered the data structure (with intraclass correlations close to or above .10), we used multilevel modelling (Hox 2010) in Mplus 7.4 with an MLR estimator.
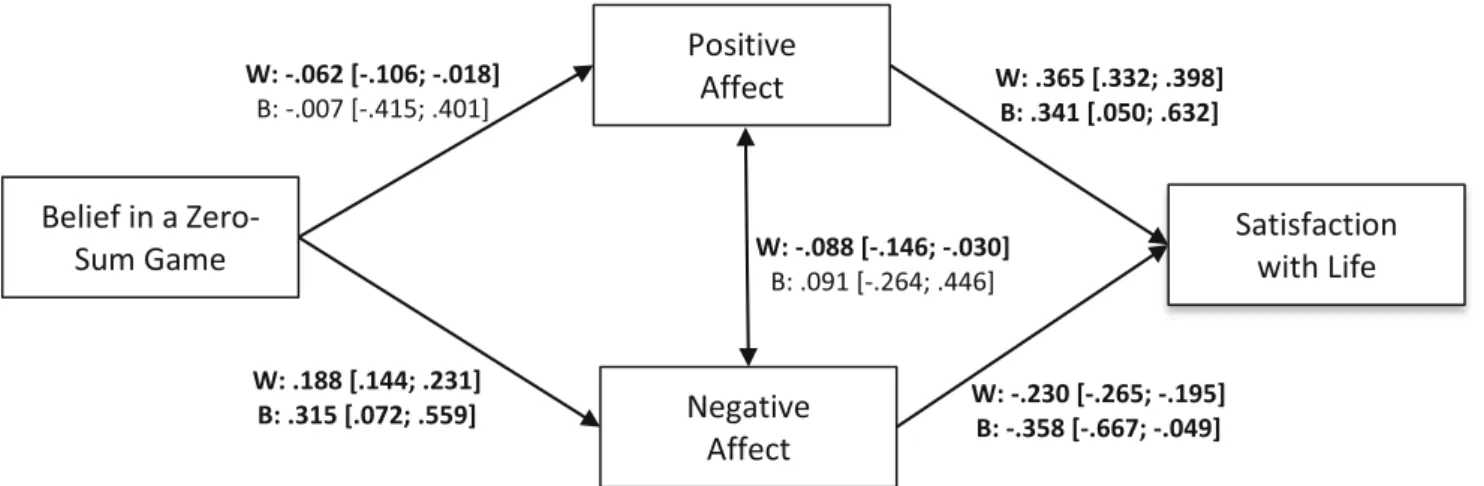
To test the first hypothesis, we utilised a 1-(1,1)-1 multi-level structural equation model (MSEM; Preacher et al.2010), where PA and NA were entered as full mediators of the effect of BZSG on SWLS. We included random intercepts and fixed slopes for all effects. Although the practical fit indices indicat-ed good fit, the chi-square was significant (χ2
= 7.89, df = 2, p = .02, CFI = .993, RMSEA = .020). However, given that the performance of CFI and RMSEA is adequate at large sample sizes even with small df values (Kenny et al. 2015, Supplement) and that the chi-square statistic is sensitive to sample size, we deemed the model fit acceptable based on the combination of fit indices. The resulting parameter esti-mates are shown in Fig.1.
At the individual (within) level, both indirect effects medi-ated by NA (b =−.031; p < .001; 95% CI: −.038, −.024) and by PA (b =−.016; p = .006; 95% CI: −.028, −.005) were sta-tistically significant. At the country (between) level, however, both indirect effects failed to achieve statistical significance (NA: b =−.070; p = .155; 95% CI: −.168, .027; PA: b = −.001; p = .973; 95% CI:−.088, .085). The results provide support for Hypothesis 1, suggesting that higher levels of NA and lower levels of PA reported by individuals with high BZSG levels could explain their lower SWL. However, this link only holds true at the individual level.
To test the cross-level interaction hypotheses, we used a series of multilevel models. We started by testing the
interaction effects for each individual-level predictor (BZSG and NA) separately. First, we fitted a null (ANOVA) Model (0) with no independent variables to estimate the random in-tercepts for the SWLS. Next, we tested a random-intercept ANCOVA Model 1 with a single individual-level predictor (NA or BZSG, group-mean centred). In Model (2), we added the mean scores of BZSG by country (grand-mean centred) as a country-level predictor of SWLS. Model (3) included a ran-dom slope for the individual-level predictor of SWLS (NA or BZSG) to test whether these individual-level associations var-ied across countries. Finally, in Model (4), we tested the cross-level interaction by regressing the random slope on country-level BZSG. The resulting model is a standard intercept-and-slopes-as-outcomes model. Finally, to find out whether the effects hold together, we also tested the same set of models with both individual-level predictors, NA and BZSG, entered simultaneously. At each stage, we used information criteria to judge the fit of the models and scaled a log-likelihood ratio test to check the significance of the differences in model fit.
The results of the model testing are summarised in Table3 (for brevity, we only present the detailed parameters for Model 4 using standard notation).
In all cases (BZSG and NA together, BZSG only, NA on-ly), the random-intercept model (Model 1) provided a better fit to the data compared to the null model, suggesting that a sizeable proportion of individual-level variance in SWLS could be explained by individual-level BZSG and NA, either one by one or in combination. In line with theoretical expec-tations, both variables were negatively associated with SWLS. The next model (Model 2) with a country-level BZSG score predicting SWLS was only marginally different from the previous random intercept model (p = .060 for the scaled loglikelihood ratio test and a better fit based on the Akaike information criterion AIC, but not the sample-adjusted Bayesian information criterion BIC). This suggests that the proportion of SWLS variance explained by country-level dif-ferences in BZSG after controlling for individual-level differ-ences in NA, BZSG, and both in combination is quite small (ΔR2
< .001 in all three cases). The regression coefficient of SWLS on country-level BZSG was negative and significant (p < .05 in all three cases), indicating that in high country-level BZSG societies people demonstrate somewhat lower life
Table 2 Descriptive statistics and correlation matrix between the variables
Variable M SD α 1 2 3 4
1 Satisfaction with life (SWLS) 3.40 .74 .78 (.10) .31 −.33* −.35*
2 Positive affect (PA) 3.45 .62 .82 .39*** (.10) .08 −.01
3 Negative Affect (NA) 2.45 .75 .85 −.27*** −.10** (.13) .31**
4 Belief in a Zero-Sum Game (BZSG) 3.19 1.05 .88 −.10*** −.06** .19*** (.12) N = 7146; intraclass correlations are placed on the diagonal; individual-level correlations are presented in lower triangular matrix; country-level correlations in the upper triangular matrix; * p < .05, ** p < .01, *** p < .001
satisfaction after controlling for individual differences in NA, BZSG, and their combination.
In the next model (Model 3), we introduced random slopes for the individual-level predictors, NA and BZSG, both en-tered one by one and then in combination. This model was a better fit to the data in all cases, based on the information criteria. When NA and BZSG were entered together, both slopes showed significant variance across countries (p = .005 and p = .034). When they were entered one by one, the slope variance was significant for NA (p = .003), but only marginal for BZSG (p = .074). The estimated intercepts of both slopes
were negative and significantly different from zero in both models (p < .001), indicating that, on average, increases in individual-level NA and BZSG are associated with a decrease in SWLS across countries.
Finally, the model in which the two random slopes were regressed on the country-level BZSG scores, Model 4, provid-ed a significantly better fit to the data comparprovid-ed to Model 3. The regression coefficients of both random slopes on country mean BZSG γ11and γ21 were statistically significant and positive, indicating that in countries with higher country-level BZSG, the negative associations of BZSG and NA with Fig. 1 Parameters of the 1-(1,1)-1 MSEM full mediation model. Standardized parameter estimates with 95% confidence intervals are given. W = individual-level effect, B = country-level effect; significant effects are bolded
Table 3 Parameters of Model 4 and summary fit statistics of all models tested Individual-level predictor(s)
NA only BZSG only NA and BZSG
Model 4, Level 1 parameters:
σ2
rij: residual variance for SWLS 0.458***[0.430; 0.485] 0.488***[0.455; 0.521] 0.451***[0.421; 0.480]
Model 4, Level 2 parameters:
γ00: intercept for SWLS 4.051***[3.455; 4.647] 3.398***[3.325; 3.471] 3.398***[3.325; 3.471]
γ10: intercept forβ1j(SWLS on NA) −0.811***[−1.113; −0.509] −0.265***[−0.303; −0.226]
γ20: intercept forβ2j(SWLS on BZSG) −0.074***[−0.093; −0.056] −0.043***[−0.062; −0.024] γ01: SWLS on group-mean BZSG −0.207 *[−0.396; −0.019] −0.212*[−0.397; −0.027] −0.212*[−0.397; −0.027] γ11:β1jon group-mean BZSG 0.172***[0.075; 0.269] 0.146***[0.072; 0.220] γ21:β2jon group-mean BZSG 0.085**[0.036; 0.134] 0.082***[0.039; 0.125] σ2
uoj: residual variance for SWLS 0.056***[0.030; 0.081] 0.046***[0.025; 0.068] 0.047***[0.025; 0.068]
σ2
u1j: residual variance forβ1j 0.020 [−0.002; 0.042] 0.009*[0.001; 0.017]
σ2
u2j: residual variance forβ2j 0.001 [0.000; 0.002] 0.001 [0.000; 0.002]
Model comparison,Δχ2(df): Model 1 vs. Model 0 136.19 (1)*** 41.64 (1)*** 182.54 (2)*** Model 2 vs. Model 1 3.54 (1), p = .060 3.53 (1), p = .060 3.54 (1), p = .060 Model 4 vs. Model 3 9.19 (1)** 15.65(1)*** 22.19 (2)*** Loglikelihood (parameters) Model 1 −7419.00 (4) −7644.05 (4) −7409.18 (5) Model 2 −7416.89 (5) −7641.94 (5) −7407.07 (6) Model 3 −7392.32 (6) −7639.41 (6) −7377.03 (8) Model 4 −7388.19 (7) −7634.88 (7) −7368.90 (10)
Information criteria, AIC (SABIC)
Model 1 14,846.00 (14,860.79) 15,296.10 (15,310.88) 14,828.37 (14,846.85)
Model 2 14,843.78 (14,862.26) 15,293.87 (15,312.35) 14,826.14 (14,848.32)
Model 3 14,796.64 (14,818.82) 15,290.83 (15,313.00) 14,770.07 (14,799.64)
Model 4 14,790.39 (14,816.26) 15,283.76 (15,309.64) 14,757.80 (14,794.77)
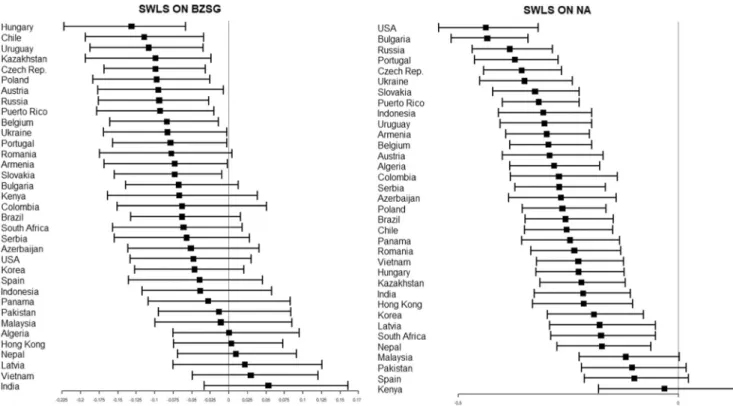
SWLS are weaker than in less“antagonistic societies”. The standardised estimates of the random slopes for each country are shown on Fig.2.
We also tested whether the individual-level associations of BZSG and NA would be moderated by country-level BZSG using a similar set of models. However, the random slope variance was not statistically significant in Model 3 (p = .105), suggesting that the association between BZSG and NA does not differ across countries.
Conclusions
The results provide evidence supporting Hypotheses 1 and 2 concerning the links between perceived antagonism in social relations (BZSG) and subjective life satisfaction (SWLS). Empirical support for the mediation hypothesis suggests that people who believe that life is like a zero-sum game are indeed more likely to experience more NA and less PA, which may explain their lower life satisfaction. However, negative affec-tivity may also reflect an individual disposition to experience aversive emotional states that is strongly related to neuroti-cism (Suls et al.1998; Watson and Clark1984,1999; Tov 2018). At the level of individuals, we found a full mediation, indicating that differences in affective reactions may fully ex-plain the associations of BZSG and SWLS. The absence of significant indirect effects at the country level is to be expect-ed, given lower statistical power; however, the present study
focused on individual-level effects and the way country-level variables moderate these associations.
The cross-level interactions we found confirming the sec-ond hypothesis suggest that the effects of individual-level BZSG may alter in societies with different levels of country-level BZSG. The absence of cross-cultural differences in the association of BZSG and NA suggests that individual differ-ences in perceived social antagonism are associated with largely the same amount of NA in low and high country-level BZSG in societies. However, the association of NA and SWLS differs across countries, suggesting that individ-uals perceiving relations as antagonistic and living in societies with high country-level BZSG might be more likely to evalu-ate their negative mood as a normal situation and not as a reason to be less satisfied with their lives. Similarly, the neg-ative association of BZSG and SWLS was weaker in societies with higher country-level BZSG. Such findings are consistent with other cross-level studies showing that BZSG is more typical of countries that try to gain more resources or defend their interests and thus have high military expenditure but low civil liberties (Różycka-Tran et al.2019).
We believe that the present study provides some evidence for the notion that perceived social antagonism could be an important correlate of SWB and the list of the features of cultures of happiness compiled by Diener (such as: progres-sive income tax, protection of human rights, low inequality, income redistribution policies to buffer income inequality, low corruption, clean air, green space, active commuting, job
Fig. 2 Forest plots (standardized estimates with 95% confidence intervals) of random slope parameters by country based on model 4 with both predictors entered
programmes, income security programmes, and caregiver programmes; Diener2016) might be supplemented with co-operative social beliefs. However, experimental studies of in-terventions targeting perceived antagonism in social relations are needed to find out whether this link is causal.
Another contribution of the study is that it adds to existing findings (Matsuda et al.2014; Brulé and Veenhoven2015) revealing significant differences in the effects exhibited by the components of SWB. Thus, the separate treatment of SWLS, PA, and NA may be helpful in many research situa-tions, particularly from a cross-cultural perspective.
Limitations and future studies
One limitation of the study is that the country samples were solely comprised of students and thus cannot be considered rep-resentative of their respective societies. As a result, the differ-ences between countries may be conflated with the differdiffer-ences in the relative social status of students within different countries.
The sample of countries we used might not be representa-tive of the world as a whole and the validity of some of the measures (most notably PANAS) may be limited in a cross-cultural context. For these reasons, we have refrained from interpreting the country-level estimates and investigating their associations with various social and economic predictors such as GDP. Finally, a cross-sectional design precludes any causal conclusions based on the mediation and moderation analyses. Future studies using more nationally representative samples or experimental designs could replicate these findings.
Future studies could investigate also how zero-sum beliefs result in different patterns of association with subjective well-being: as some research on belief in a just world has found that personal vs. other just world beliefs result in different patterns of association with subjective well-being (Sutton et al.2017); this may also be the case with zero-sum beliefs.
The results suggest that including BZSG into large-scale international studies of social beliefs and well-being would be beneficial for explaining the well-being phenomenon both at the individual level and at the country level. These studies could identify the cultural factors moderating the relationship between social beliefs and SWB at the country level. If people in a country are generally antagonistic, is it adaptive or is it only less detrimental for well-being? The effects of BZSG on social well-being may not even be linear, similarly to the find-ings of Harrington et al. (2015) for freedom and constraint across 32 nations. Future studies could reveal the cultural factors shaping the relationship of BZSG and life satisfaction.
Acknowledgments The work of MagdalenaŻemojtel-Piotrowska and Jarosław Piotrowski was supported by NCN 2016/21/B/HS6/01069. The work of Evgeny Osin was supported by the Russian Academic Excellence project“5-100”. The work of Truong Thi Khanh Ha was funded by grants 501.01-2016.02 from the Vietnam National Foundation for Science and Technology Development (NAFOSTED).
Author Contributions Wrote the paper: Joanna Różycka-Tran, Evgeny N. Osin, Magdalena Żemojtel-Piotrowska. Desing the study: Magdalena Żemojtel-Piotrowska, Jarosław Piotrowski, Joanna Różycka-Tran. Prepared the data: Paweł Jurek. Special thanks to Evgeny N. Osin for multilevel modeling analyses. Visualization: Evgeny N. Osin, Paweł Jurek. Revisions and comments for final version: Byron G. Adams and all authors. Gathered data: all authors.
Compliance with ethical standards
All proceduresper-formed in studies involving human participants were in accordance with the ethical standards of the institutional and/or national research commit-tee and with the 1964 Declaration of Helsinki and its later amendments or comparable ethical standards. This article does not contain any studies with animals performed by any of the authors. Informed consent was obtained from all individual participants included in the study. Conflict of interest On behalf of all authors, the corresponding author states that there is no conflict of interest.
Open Access This article is distributed under the terms of the Creative
C o m m o n s A t t r i b u t i o n 4 . 0 I n t e r n a t i o n a l L i c e n s e ( h t t p : / / creativecommons.org/licenses/by/4.0/), which permits unrestricted use, distribution, and reproduction in any medium, provided you give appro-priate credit to the original author(s) and the source, provide a link to the Creative Commons license, and indicate if changes were made.
References
Brulé, G., & Veenhoven, R. (2015). Geography of happiness: Configurations of affective and cognitive appraisal of life across nations. International Journal of Happiness and Development, 2(2), 101–117.
Clark, B. C., Thorne, C. B., Hendricks, P. S., Sharp, C., Clark, S. K., & Cropsey, K. L. (2015). Individuals in the criminal justice system show differences in cooperative behaviour: Implications from cooperative games. Criminal Behaviour and Mental Health, 25(3), 169–180. DeNeve, K. M., & Cooper, H. (1998). The happy personality: A
meta-analysis of 137 personality traits and subjective well-being. Psychological Bulletin, 124, 197–229.
Diener, E. (2016). A cross-cultural view of well-being. Paper presented in Nagoya: IACCP.
Diener, E., Emmons, R. A., Larsen, R. J., & Griffin, S. (1985). The satisfac-tion with life scale. Journal of Personality Assessment, 49, 71–77. Diener, E., Oishi, S., & Lucas, R. E. (2003). Personality, culture, and
SWB: Emotional and cognitive evaluations of life. Annual Review of Psychology, 54, 403–425.
Diener, E., Oishi, S., & Tay, L. (2018). Handbook of well-being. Salt Lake City: DEF Publishers.nobascholar.com.
Eid, M., & Larsen, R. J. (Eds.). (2008). The Science of Subjective Well-Being. N.Y.: The Guilford Press.
Harrington, J. R., Boski, P., & Gelfand, M. J. (2015). Culture and national well-being: Should societies emphasize freedom or constraint? PLoS One, 10(6), e0127173.https://doi.org/10.1371/journal.pone.0127173. Hox, J. J. (2010). Multilevel analysis. Techniques and applications (2nd
ed.). New York: Routledge Taylor & Francis Group.
Kenny, D. A., Kaniskan, B., & McCoach, B. (2015). The performance of RMSEA in models with small degrees of freedom. Sociological Methods & Research, 44(3), 486–507. https://doi.org/10.1177/ 0049124114543236.
Lindquist, K. A., Satpute, A. B., Wager, T. D., Weber, J., & Barrett, L. F. (2015). The brain basis of positive and negative affect: Evidence from a meta-analysis of the human neuroimaging literature. Cerebral Cortex, 26(5), 1910–1922.
Matsuda, T., Tsuda, A., Kim, E., & Deng, K. (2014). Association between perceived social support and subjective well-being among Japanese, Chinese, and Korean college students. Psychology, 5, 491–499. https://doi.org/10.4236/psych.2014.56059.
Minkov, M., & Bond, M. H. (2017). A genetic component to national differences in happiness. Journal of Happiness Studies, 18(2), 321– 340.https://doi.org/10.1007/s10902-015-9712-y.
Piotrowski, J.,Żemojtel-Piotrowska, M., Osin, E., Różycka-Tran, J., & Wlodarczyk, A. (2016). Measurement of subjective well-being across countries: The comparison of psychometric properties and structural validity of PWI, PANAS, SWLS and MHC-SF in 38 countries. The 23rd Congress of the International Association for Cross-Cultural Psychology, Nagoya, Japan, July 31- August 03. Preacher, K. J., & Hayes, A. F. (2008). Asymptotic and resampling
strat-egies for assessing and comparing indirect effects in multiple medi-ator models. Behavior Research Methods, 40(3), 879–891.https:// doi.org/10.3758/BRM.40.3.879.
Preacher, K. J., Zyphur, M. J., & Zhang, Z. (2010). A general multilevel SEM framework for assessing multilevel mediation. Psychological Methods, 15(3), 209–233.
Różycka-Tran, J., Boski, P., & Wojciszke, B. (2015). Belief in a zero-sum game belief as a social axiom: A 37-nation study. Journal of Cross-Cultural Psychology, 46(4), 525–548.https://doi.org/10.1177/ 0022022115572226.
Różycka-Tran, J., Jurek, P., Olech, M., Piotrowski, J., & Żemojtel-Piotrowska, M. (2017). Measurement invariance of the belief in a zero-sum game scale across 36 countries. International Journal of Psychology.https://doi.org/10.1002/ijop.12470Epub ahead of print. Różycka-Tran, J., Alessandri, G., Jurek, P., & Olech, M. (2018). A test of construct isomorphism of the belief in a zero-sum game scale: A multilevel 43-nation study. PLoS One, 13(9), e0203196.https://doi. org/10.1371/journal.pone.0203196.
Różycka-Tran, J., Jurek, P., Olech, M., Piotrowski, J., & Żemojtel-Piotrowska, M. (2019). A warrior society: Data from 30 countries show that belief in a zero-sum game is related to military expendi-ture and low civil liberties. Frontiers in Psychology, 9, 2645.https:// doi.org/10.3389/fpsyg.2018.02645.
Suls, J., Green, P., & Hillis, S. (1998). Emotional reactivity to everyday problems, affective inertia, and neuroticism. Personality and Social Psychology Bulletin, 24(2), 127–136.
Sutton, R. M., Stoeber, J., & Kamble, S. V. (2017). Belief in a just world for self versus others, social goals, and subjective well-being. Personality and Individual Differences, 113, 115–119.
Tov, W. (2018). Well-being concepts and components. In E. Diener, S. Oishi, & L. Tay (Eds.), Handbook of well-being. Salt Lake City: DEF Publishersnobascholar.com.
Von Neumann, J., & Morgenstern, O. (1944). Theory of games and eco-nomic behavior. Princeton: Princeton University Press.
Watson, D., & Clark, L. A. (1984). Negative affectivity: The disposition to experience aversive emotional states. Psychological Bulletin, 96(3), 465–490.
Watson, D., & Clark, L. A. (1999). The PANAS-X: Manual for the pos-itive and negative affect schedule-expanded form.
Watson, D., Clark, L. A., & Tellegen, A. (1988). Development and val-idation of brief measuresof positive and negative affect: The PANAS scales. Journal of Personality and Social Psychology, 54, 1063– 1070.
Żemojtel-Piotrowska, M., Piotrowski, J. P., Osin, E. N., Cieciuch, J., Adams, B. G., Ardi, R., Bălţătescu, S., Bogomaz, S., Bhomi, A. L., Clinton, A., de Clunie, G. T., Czarna, A. Z., Esteves, C., Gouveia, V., Halik, M. H. J., Hosseini, A., Khachatryan, N., Kamble, S. V., Kawula, A., Lun, V. M. C., Ilisko, D., Klicperova-Baker, M., Liik, K., Letovancova, E., Cerrato, S. M., Michalowski, J., Malysheva, N., Marganski, A., Nikolic, M., Park, J., Paspalanova, E., de Leon, P. P., Pék, G., Różycka-Tran, J., Samekin, A., Shahbaz, W., Khanh Ha, T. T., Tiliouine, H., van Hiel, A., Vauclair, M., Wills - Herrera, E., Włodarczyk, A., Yahiiaev, I., & Maltby, J. (2018). The mental health continuum-short form: The structure and application for cross-cultural studies-a 38 nstudies-ation study. Journstudies-al of Clinicstudies-al Psychology, 74, 1034–1052. https://doi.org/10.1002/jclp.22570.
Affiliations
Joanna Różycka-Tran1
&Jarosław P. Piotrowski2
&MagdalenaŻemojtel-Piotrowska2&Paweł Jurek1
&Evgeny N. Osin3&
Byron G. Adams4,5&Rahkman Ardi6&Sergiu Bălțătescu7&Arbinda Lal Bhomi8&Sergey A. Bogomaz9&Jan Cieciuch2& Amanda Clinton10&Gisela T. de Clunie11&Anna Z. Czarna12&Carla Sofia Esteves13&Valdiney Gouveia14&
Murnizam H. J. Halik15&Narine Kachatryan16&Shanmukh Vasant Kamble17&Anna Kawula2&
Martina Klicperova-Baker18&Aituar Kospakov19&Eva Letovancova20&Vivian Miu-Chi Lun21&Sara Malo Cerrato22& Stephan Muehlbacher23&Marija Nikolic24&Alina A. Pankratova25&Joonha Park26&Elena Paspalanova27&
Győző Pék28
&Pablo Pérez de León29&Iva Poláčková Šolcová18
&Wahab Shahbaz30&Truong Thi Khanh Ha31&
Habib Tiliouine32&Alain Van Hiel33&Christin-Melanie Vauclair13&Eduardo Wills-Herrera34&Anna Włodarczyk35,36 & Illia I. Yahiiaiev37&John Maltby38
1
Institute of Psychology, University of Gdansk, Bazynskiego street 4, 80-309 Gdansk, Poland
2 University of Cardinal Stefan Wyszynski, Warsaw, Poland 3
National Research University Higher School of Economics, Moscow, Russia
4
Tilburg University, Tilburg, the Netherlands
5
University of Johannesburg, Johannesburg, South Africa
6 Airlangga University, Surabaya, Indonesia 7
University of Oradea, Oradea, Romania
8
Tribhuvan University, Kirtipur, Nepal
9
Tomsk State University, Tomsk, Russia
Publisher’s note Springer Nature remains neutral with regard to juris-dictional claims in published maps and institutional affiliations.
10
University of Puerto Rico, San Juan, Puerto Rico
11 Universidad Tecnológica de Panamá, Panama City, Panama 12
Faculty of Management and Social Communication, Jagiellonian University, Kraków, Poland
13
Instituto Universitário de Lisboa (ISCTE-IUL), CIS-IUL, Lisbon, Portugal
14 Federal University of Paraíba, João Pessoa, Brazil 15
University Malaysia Sabbah, Kota Kinabalu, Malaysia
16 Yerevan State University, Yerevan, Armenia 17
Karnatak University, Dharwad, India
18
Academy of Sciences of the Czech Republic, Prague, Czech Republic
19 S. Toraighyrov Pavlodar State University, Pavlodar, Kazakhstan 20
Comenius University in Bratislava, Bratislava, Slovakia
21
Lingnan University, Tuen Mun, China
22
University of Girona, Girona, Spain
23
Faculty of Psychology, University of Vienna, Vienna, Austria
24
LUM University, Casamassima, Italy
25 Lomonosov Moscow State University, Baku Branch,
Moscow, Russia
26
NUCB Business School, Nagoya, Japan
27
New Bulgarian University, Sofia, Bulgaria
28 University of Debrecen, Debrecen, Hungary 29
Universidad Católica del Uruguay, Montevideo, Uruguay
30 Massey University, Wellington, New Zealand 31
Vietnam National University, Hanoi, Vietnam
32
Oran University, Oran, Algeria
33 Ghent University, Ghent, Belgium 34
University de Los Andes, Bogotá, Colombia
35 University of Basque Country, Leioa, Spain 36
University of Santiago de Chile, Santiago, Chile
37
Taras Shevchenko National University of Kiev, Kiev, Ukraine