Benchmarking some Portuguese S&T
system research units
Francisco M Couto, Ivan Andrade, Pedro Gon¸calves
and Paulo Verissimo
DI–FCUL–TR–2010–07
DOI:10455/6682
(http://hdl.handle.net/10455/6682)
November 2010
Published at Docs.DI (http://docs.di.fc.ul.pt/), the repository of the Department of Informatics of the University of Lisbon, Faculty of Sciences.
Benchmarking some Portuguese S&T system
research units
Francisco M. Couto
Ivan Andrade
Pedro Gon¸calves
Paulo Verissimo
LaSIGE, University of Lisbon, Portugal
Abstract
The increasing use of citation impact metrics for evaluation and com-parison not only of individual researchers but also of institutions, univer-sities and even countries has prompted the development of bibliometrics. Currently, these metrics are becoming widely accepted as an easy and balanced way to compare and rank scientists and/or research units.
This paper presents a benchmarking study of a selected list of rep-resentative Portuguese research units based on bibliometric parameters, number of projects and number of PhD produced. The study aimed at comparing the productivity and impact of the selected research units using objective metrics based on public and official information, retrievable on-line and thus verifiable and repeatable. The study focused on the 2003-06 period, in which an official evaluation was conducted.
The main advantage of our study was the application of automatic tools, which enable us to extend and update the results with minimal hu-man intervention. Moreover, the results show that the parameters chosen for this study perform quite well, since they provided a good match to the official evaluation results, which demonstrates the feasibility of applying such approach in a research unit evaluation setting.
1
Introduction
Bibliometric analysis is becoming widely accepted as an easy and balanced way to measure the research impact and relevance of scientists, institutions and even countries [2, 12]. It assumes that citations are references to work that have influenced the author, and therefore are an evidence of the impact and relevance of the cited work [16]. Bibliometric analysis depends mainly on two components: Bibliographic Dataset: from where we retrieve the citations referencing the
work of a given scientist;
Citation Metric: a mathematical formula that produces an unique number quantifying the impact and relevance of a given scientist from its citations.
The most popular bibliographic datasets nowadays are Google Scholar 1,
Scopus2 and Web of Science3 (Thomson/Reuters).
Both have advantages and disadvantages in relation to the accuracy of data they provide [3, 5, 7, 17, 18], however, Scopus and Web of Science access is subscription-based, which means that its access is restricted to institutions that subscribe it [9], and only includes citations published in indexed journals se-lected by their own criteria [19]. This is a major drawback to Web of Science and Scopus, since everyone expects that any evaluation should be based on full-accessible, democratic and comprehensive dataset. On the other hand, Google Scholar provides a freely available and comprehensive bibliographic dataset.
Several citation metrics have been defined and tested, such as the number of highly cited papers, the mean number of citations per paper and the total number of citations. A recent and popular metric was proposed by Hirsch, the h-index [10], defined as follows:
A scientist has index h if h of his or her N p papers have at least h citations each and the other (N p − h) papers have ≤ h citations each.
Besides its shortcomings, the appeal of h-index is clear: it contributes to the ranking of scientists using a single value accounting for production and impact that is straightforward to calculate and fairly robust [2, 4, 8, 20].
In citation metrics self-citations cannot be neglected since they represent a significant percentage of the citations [1, 13]. Self-citation allows authors to connect their recent work to their previous findings published in the past. Thus, self-citation is legitimate and necessary to contextualize recent work and avoid text repetition. However, using self-citations for calculating citation metrics may sound unreasonable, since the goal of citation metrics is to measure the scientist’s impact on his or her peers and not the impact on himself or herself. Recent works compared different bibliographic datasets [5], citation metrics [11], and measured the impact of self-citations [21].
We believe that objective metrics are crucial to evaluate the output and im-pact of research units. Thus, we developed CIDS (Citation Imim-pact Discerning Self-citations) a tool that automates the post-processing of raw publication and citation data [6]. CIDS has been evaluated, very positively, by a number of na-tional but mainly internana-tional institutions. Amongst other functions, it allows profiling publications and citations, both from individual researchers and whole groups, units or departments. The root source of data is Google Scholar. How-ever, information is post-filtered and cleaned and, namely, it allows retrieving data without self-citations, a facility we believe is unique in existing tools.
Looking for a clear-cut period and set of information to evaluate the tool itself, the opportunity was given by a recent research system evaluation cycle, which provided public information, of comparable nature in content and period,
for all units belonging to the Portuguese Funda¸c˜ao para a Ciˆencia e a Tecnologia
(FCT) sponsored scientific and technological system (SC&T). Thus, we set out to perform a study of a few reference Portuguese research units in our fields of
interest, the area called Engenharia Electrot´ecnica e Inform´atica (EE&I), which
1http://scholar.google.com 2http://www.scopus.com/
encloses what in anglo-saxon terms is described by the collection of Electrical Engineering and Computer Science and Engineering. These kind of benchmark-ing studies are essential in any excellence system like the Portuguese SC&T, and common in developed countries. However, they are not widely disseminated yet, so this is our modest contribution to that objective.
This paper is structured as follows: Section 2 introduces the rationale of the study, explaining the reason behind the parameters and research units selection. Section 3 describes how the study was conducted, explaining its information sources, information retrieval and processing methodology used, and the data quality tests performed. Section 4 presents the results obtained in terms of gross and per capita weight and relevance, and its distribution by unit members. Section 5 ends with our main conclusions and futures directions.
2
Rationale of the study
We have focused on a specific period, the 2003-2006 interval inclusive, since
this was the reference period concerning the latest evaluation4performed by the
Funda¸c˜ao para a Ciˆencia e a Tecnologia (FCT), whose mission is to continuously
promote the advancement of scientific and technological knowledge in Portugal. The FCT evaluation reported all units in similar terms so that all units would be in equal conditions, in respect to information publicly available. As a side effect, this official evaluation, besides its intrinsic value to our study, provides an interesting input for comparison against both its Terms of Reference (FCT
ToR) and results, published in R&D Units Evaluation Results - 20075.
Fair and open calculation of bibliometric statistics depends on the availabil-ity of a comprehensive database of publications, such as Google Scholar. To explore Google Scholar we used our freely available web tool CIDS (Citation Impact Discerning Self-citations) to calculate bibliometric parameters with and without self-citations of various R&D units. However, besides bibliometric, we included other complementary production parameters in the study: the number of concluded PhDs, and the national and international projects conducted dur-ing the evaluation period. These parameters complete each other and together constitute objective indicators of the fulfilment of qualitative and quantitative goals of a research unit, especially in comparison with its peers in the same circumstances.
It is not expected that a simple computation can be applied to derive an evaluation of a research unit (nor do the FCT ToR for the evaluation specify
that). However, objective metrics, especially if multi-dimensional and with
a good coverage, are certainly a quite faithful indicator of the fulfilment of qualitative and quantitative objectives of a research unit. We will show below that the parameters chosen for this study perform quite well, since they provide a good match to usual evaluation terms of reference in international academia, including the official ToRs of the latest FCT evaluation. We hope this will illustrate the feasibility of applying our methodology and such parameters in a research unit evaluation setting.
4http://alfa.fct.mctes.pt/apoios/unidades/avaliacoes/2007/
2.1
Terms of Reference for the units analysed
In this work, we followed the terms of reference and selection criteria described below.
In the Portuguese S&T system there are research units and associate labo-ratories (LA). The latter are larger units, which associate several large groups or even research units. LAs are considered by the government as S&T system flagships and are considerably better financed per PhD than regular units. LAs were part of the same cycle and reported in the same way as regular units.
Timeline of the EE&I area (Electrical Engineering and Computer Science and Engineering) (25 units) evaluation: initial evaluation started with a 4-year activity report 2003-2006 delivered in July 2007; evaluation results were issued in January 2009; 56% of the units (14) complained about the evaluation; re-evaluation results were announced in January 2010, a year later, and 2.5 years after the evaluation actually started.
We needed a representative set of units for performing our benchmarking experiments. It was materially impossible to treat all units, at least in this phase and so, the units were selected to depict several grades and interesting comparative situations (grading, initial vs. re-evaluation results, etc.). An as-sociate laboratory (LA) was also included for reference. Overall we selected 6 units: ISRC (ISR Coimbra, FCTUC), CISTER (Porto, ISEP), CISUC (Coim-bra, FCTUC), CITI (Lisbon, FCTUNL), LaSIGE (Lisbon, FCUL), ISRLX (ISR Lisbon, IST):
• ISRC was the only unit considered Excellent (EX) in the initial evaluation. • CISTER, initially rated Very Good (VG), was promoted to EX after
re-evaluation.
• CISUC, initially rated GD, was promoted to VG after re-evaluation. • CITI, initially rated GD, remained so after re-evaluation.
• LaSIGE, initially rated VG, remained so after re-evaluation.
• ISRLX is a large unit, considered a reference associate laboratory, LA. The evaluation was not complete at the date of this report. ISRLX was EX in the previous evaluation and is included for comparison.
We based ourselves on public and official information, retrievable on-line and thus verifiable and repeatable. Based on automated procedures, and despite our verifications, this experiment may not be exempt from some residual errors in individual entries of the source repositories, but it has a controlled error margin that we discuss in the end with regard to data quality. That error margin is negligible for most of the situations and when it is not the case, it is quite similar across researchers and units, and far better than what can be achieved by direct query to GS, DBLNP, Harzing, or related repositories. Nevertheless, we offered each selected unit the possibility of verification of their data, but only committed to correct information which is on-line and of official value.
We are primarily interested in producing aggregate data about institutions, of comparative statistical value to evaluate our tool, which the above FCT ToR more than fit suitably. We plan on extending the study, but the study itself can be extended by anyone wishing, since the setting and the tools are public.
3
Study Design
The target of this study was the activity of each unit during the period January 2003 - December 2006, and the activity of exclusive integrated researchers with a PhD of the unit, Int-PhD (who are not affiliated with another institution), as of 31/12/2006, the end of the period in reference, measured both over the career, and over the period (03-06).
3.1
Information Sources (all public and official)
The idea was to gather a number of parameters that could be automatically calculated and would be sufficient to derive an evaluation of a research unit. To guarantee the fairness of study, we postulated the following rules for the parameters:
• be based on a known and generic formula; • be applicable to every unit;
• be based on public and official information, retrievable on-line and thus verifiable and repeatable.
Besides bibliometric parameters, we included two other measurable output items that satisfied the above rules: the number of concluded PhDs, and the national and international projects conducted during the evaluation period.
Overall we selected the following parameters: 1. Number of unique cited papers
2. Number of unique citations
3. Number of unique cited papers for each Int-PhD 4. Number of unique citations for each Int-PhD 5. Hirsch-index for each Int-PhD
6. Number of international and national competitive research projects started during the evaluation period
7. Number of PhD theses produced during the evaluation period
By Int-PhD we mean exclusive integrated researchers with a PhD (who are not affiliated with another institution), as of 31/12/2006, the end of the period in reference. The number of unique papers and citations represents the union of the set of papers and citations found for each individual Integrated PhD researcher, thus eliminating repetitions. For example, papers co-authored by unit researchers are only used once.
As a note, these metrics cover quite well the several quantitative aspects normally at stake by international criteria, when evaluating a research unit or group or department: weight and critical mass of the unit; relevance and im-pact of its career members (aka faculty); productivity; imim-pact of production; efficiency and effectiveness, through per capita results; balance of resources, through distribution of results across the researchers. Incidentally, these met-rics end-up representing quite well the quantitatively measurable aspects of the metrics requested in the FCT ToR for the evaluation:
• Productivity (papers)
• Relevance/Impact (citations, h-index, gross, per capita and distribution numbers)
• Feasibility (Projects) • Training (PhDs theses)
Hence as a lateral effect our study may allow gaining some insight on the FCT unit’s evaluation results vs. criteria.
3.2
Information retrieval and processing methodology
The calculation of the parameters was based on the following sources of infor-mation:
• Google Scholar (GS) repository (corrected, post-processed and filtered by the CIDS tool).
• FCT web site.
• Multi-annual evaluation report 2003-2006 from units (to the exception of ISRC, whose report was not made available to us; nevertheless, the missing unit’s data was retrieved from the unit’s and FCT’s site).
• Units’ web sites.
Our first step was to obtain the list of Int-PhD researchers of each unit at 31/12/2006 from the FCT web site. From the FCT web site we could not collect the list of Int-PhD researchers for older dates. For each researcher, we manually defined a Google Scholar query that best defined his/her list of published papers. This list of queries was given as input to our tool CIDS, a freely available tool that automatically calculates bibliometric parameters based on Google Scholar data. Given the importance of bibliometric parameters in our study, we provide a detailed description of CIDS in a following section.
The number of national and international projects, and the number of con-cluded PhD theses were collected from the unit’s evaluation reports, cross-checked with the unit’s web site or other official sites when needed. We had access to all unit’s evaluation reports to the exception of ISRC, whose report was not made available to us; nevertheless, the missing unit’s data was retrieved from the unit’s and FCT’s site.
3.3
CIDS
To calculate the citation metrics for each selected author, we developed a new
version of CIDS 6. The second version of CIDS only requires a Google Scholar
query, normally the last name of the author together with its initials. Besides the (author:) operator, the query can also include the subject area (subject:)
operator, or any other of the Advanced Scholar Search operators 7.
6http://cids.fc.ul.pt
The papers returned by Google Scholar are then individually analyzed. For each paper, CIDS retrieves its citations and its authors’ names. CIDS uses the authors’ names to filter out the self-citations based on the self-citation policy of CiteSeer [15]. CIDS current policy is marking a citation as a self-citation if at least one of its authors is also an author of the cited paper. In the end, CIDS uses the number citations of each paper to calculate the h-index, the citation-per-paper, and the total number of citations, and uses the number of non-self-citations to calculate the same citation metrics. Thus, CIDS returns two values for each citation metric, one using all citations and the other discerning self-citations.
For example, the query that produced the results shown in Figure 1. used ’Lisbon OR Lisboa’ -author:LF-Couto to disambiguate the author’s name, by only selecting authors from Lisbon and discarding the author with the initials
LF8. The first table shows the values for each citation metric with and without
including self-citations. The second table shows the number of citations, the number of self-citations, and the number of non-self-citations. Each number is a link to obtain the respective list of citations. Besides HTML the tools also provides the citation analysis in TSV and BibTeX formats.
A list of individuals can be assigned to a research unit to produce aggregate values. CIDS calculates two groups of aggregate values: the unique values and the average values. Unique values are calculated by merging the papers and citations found for all individuals. Thus, this unique values just consider a paper or a citation once even if it shared by multiple individuals of the same research unit. Average results are calculated just by averaging the individual values for each bibliographic metric.
3.4
Data Quality
The accuracy of CIDS depends on the ability of Scholar’s method to correctly identify the names of the authors in the header of the paper. The method is robust in general, since it is relatively simple to automatically detect the header of a paper, with a small error margin. However, a few authors have ambiguous names that can lead CIDS to include papers from homonymous authors [14]. The impact of this problem in our study is residual, and since we aim at evaluating a group of researchers and not specific individuals, we can consider it negligible. However, in order to eliminate any outlier in this particular study, each query was manually verified.
For evaluating the accuracy of CIDS, we crosschecked a manually curated list of 129 cited papers of an Int-PhD researcher with the papers automatically identified by CIDS. We found that 103 of the 105 papers returned by CIDS were in the curated list. This means that CIDS achieved a precision of 96% and a recall of 78%. Moreover, the real recall of CIDS is expected to be even higher than 78%, since in our study CIDS was limited to the first two Scholar result pages for each query due to performance issues, and senior researchers such as this one tend to overpass this limit.
Considering the existence of other public and well-organised repositories, we made a comparative study of the precision and recall, with DBLP, another reference repository. We crosschecked the same manual list with the list of
CIDS v2.2BETA
Citation Impact Discerning Self-citations
Query: (author:f-couto OR author:f-coutoa) "Lisbon OR Lisboa OR author:Silva OR author:Pesquita" -author:LF-Couto -author:FS-Couto subject:eng OR soc 2010-08-23
CIDS is being developed by Francisco Couto at LASIGE
h_index nonself_h_index g_index nonself_g_index cited_papers citations nonself_cits cits_per_paper nonself_cits_per_paper date
10 10 19 16 29 377 292 13.00 10.07 2010-08-23
Title Authors Year Citations nonself self
Facts from textis text mining ready to deliver RebholzSchuhmann, D and Kirsch, H and Couto, F 2005 85 72 13 Measuring semantic similarity between Gene Ontology terms Couto, FM and Silva, MJ and Coutinho, PM 2007 39 32 7 Implementation of a functional semantic similarity measure between geneproducts Couto, FM and Silva, MJ and Coutinho, PM 2003 35 28 7
Semantic similarity over the gene ontology Family correlation and selecting
disjunctive ancestors Couto, FM and Silva, MJ and Coutinho, PM 2005 34 26 8 Metrics for GO based protein semantic similarity a systematic evaluation Pesquita, C and Faria, D and Bastos, H and Ferreira, A and Falcao,
A and Couto, F 2008 34 27 7
Finding genomic ontology terms in text using evidence content Couto, F and Silva, M and Coutinho, P 2005 27 19 8 GOAnnotator linking protein GO annotations to evidence text Couto, FM and Silva, MJ and Lee, V and Dimmer, E and Camon, E
and Apweiler, R and Kirsch, H and RebholzSchuhmann, D 2006 24 21 3
Semantic similarity in biomedical ontologies Pesquita, C and Faria, D and Falcao, AO and Lord, P and Couto, FM2009 17 16 1 Classifying biological articles using web resources Couto, FM and Martins, B and Silva, MJ 2004 15 11 4 Evaluating gobased semantic similarity measures Pesquita, C and Faria, D and Bastos, H and Falcao, A and Couto, F2007 14 10 4 ProFAL Protein functional annotation through literature Couto, FM and Silva, MJ and Coutinho, P 2003 7 5 2 Proteinon A web tool for protein semantic similarity Faria, D and Pesquita, C and Couto, FM and Falcao, A 2007 6 0 6 Improving information extraction through biological correlation Couto, FM and Silva, MJ and Coutinho, P 2003 6 4 2 Figo Finding go terms in unstructured text Couto, FM and Silva, MJ and Coutinho, P 2004 5 5 0 Finding genomic ontology terms in unstructured text Couto, F and Silva, M and Coutinho, P 2005 4 4 0 Measuring semantic similarity between gene ontology terms DKEData and
Knowledge Engineering Couto, F and Silva, M and Coutinho, P 2006 4 2 2 CIKM Proceedings of the th ACM international conference on Information and
knowledge management Couto, F and Silva, M and Coutinho, P 2005 2 1 1 Advanced Data Mining Techonologies in Bioinformatics Idea Group Inc chap Couto, F and Silva, M 2 0 2 Curating extracted information through the correlation between structure and
function Couto, F and Silva, M and Coutinho, P 2 0 2
FIGO Findings GO Terms in UnStructured Text BioCreative Notebook Papers CNB Couto, F and Silva, M and Coutinho, P 2 2 0 Evaluating gobased semantic similarity measures ISMBECCB SIG Meeting Program
Materials Pesquita, C and Faria, D and Bastos, H and Falcao, AO and Couto, F 2007 2 0 2
Classifying biomedical articles using web resources Couto, F and Martins, B and Silva, M and Coutinho, P 2 1 1 Semantic Similarity over the Gene Ontology Family Correlation and Selecting
Disjunctive Ancestors ACM CIKMConference in Information and Knowledge Management
Couto, F and Silva, MJ and Coutinho, P 2005 2 2 0 Automated social network epidemic data collector Lopes, LF and Zamite, JM and Tavares, BC and Couto, FM and
Silva, F and Silva, MJ 2009 2 1 1
Identifying bioentity recognition errors of rulebased textmining systems Couto, FM and Grego, T and Bastos, HP and Pesquita, C and
Torres, R and Sanchez, P and Pascual, L and Blaschke, C 1 0 1
Mining BioLiterature Toward Automatic Annotation of Genes and Proteins Couto, F and Silva, M 1 0 1 Semantic Similarity Match for Data Quality Martins, F and Falcao, A and Couto, FM 2007 1 1 0 Identification of Chemical Entities in Patent Documents Grego, T and Pkezik, P and Couto, F and RebholzSchuhmann, D 2009 1 1 0 Filtering bioentity recognition errors in bioliterature using a casebased approach Coutoa, FM and Gregoa, T and Torresb, R and Sanchezb, P and
Pascualb, L and Blaschkeb, C 2007 1 1 0
papers assigned by DBLP. We found that 90 of the 91 papers returned by DBLP were also in the curated list. This gives a precision of 99% for DBLP but a recall of only 70%. We also found that all the papers in DBLP were also available in Scholar, which means that, barring one or another exception, including DBLP will not represent an improvement on recall.
We stress that using our tool for individual purposes (e.g., a curriculum) will require a final albeit residual effort of checking and cleaning. That effort seems minimal, as reported by the additional experiment below. We compared the manually curated list of papers and citations of another Int-PhD researcher with the results returned by CIDS. The curated list contained 69 papers and 211 nonself-citations, whereas CIDS returned 67 papers and 207 nonself-citations. Since all the papers and nonself-citations returned by CIDS were also in the cleaned list, we obtained a precision of 100% and a recall of 97% for papers and 98% for non-self citations. This demonstrates that our results based on Scholar queries are quite accurate and complete.
Another issue with Google Scholar and as a matter of fact any automated tool, is the duplication of the same paper in different entries. This issue may influence the number of cited papers and h-index parameters. To evaluate the real impact of this issue we calculated the number of distinct Scholar entry pairs with equal titles. We found only 68 pairs from 4,532 distinct entries. This means that this issue only exists for less than 1.5% of the cases, and even for that cases the h-index is normally not affected since most citations of these duplicate entries tend to be assigned to a single entry.
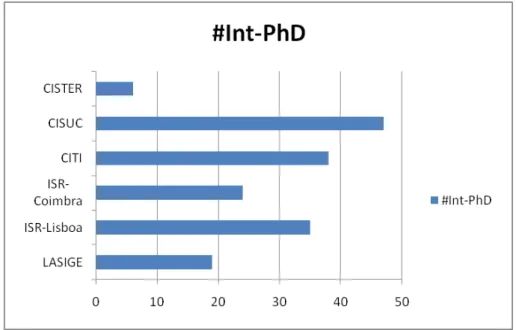
Figure 2: Number of Exclusive Integrated PhD researchers of the unit (#Int-PhD)
Figure 3: Unique cited papers: union of the sets of papers found for each individual Int-PhD
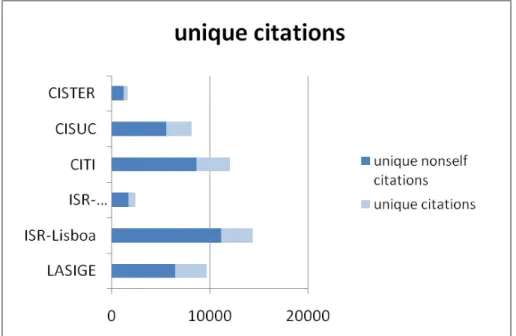
Figure 4: Unique citations: union of the sets of citations found to each of the papers from each individual Int-PhD.
Figure 5: Unique cited papers per Int-PhD: Gross Weight publication figure divided by Int-PhD
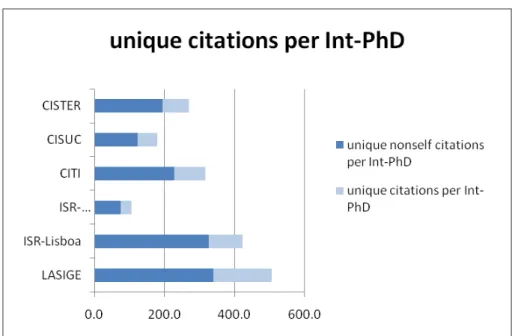
Figure 6: Unique citations per Int-PhD: Gross Weight citations figure divided by Int-PhD
Figure 8: Unique cited papers: union of the sets of papers found for each individual Int-PhD and published between 2003 and 2006
Figure 9: Unique citations: union of the sets of citations found to each of the papers from each individual Int-PhD published between 2003 and 2006.
Figure 10: National and International projects: numbers of research projects started during the period 2003-2006
Figure 12: Unique cited papers per Int-PhD: Gross Weight publication figure divided by Int-PhD w.r.t. the period 2003-2006
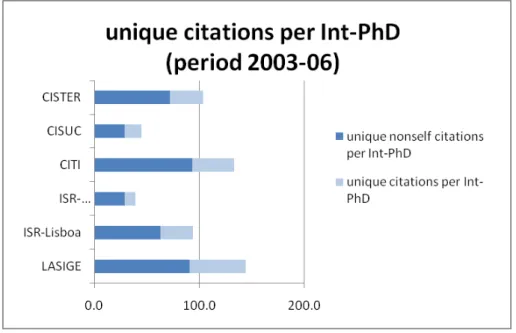
Figure 13: Unique citations per Int-PhD: Gross Weight citations figure divided by Int-PhD w.r.t. the period 2003-2006
Figure 14: National and International projects per 10 Int-PhD started during the period 2003-2006: Gross Weight research projects figure divided by 10 Int-PhD (for readability)
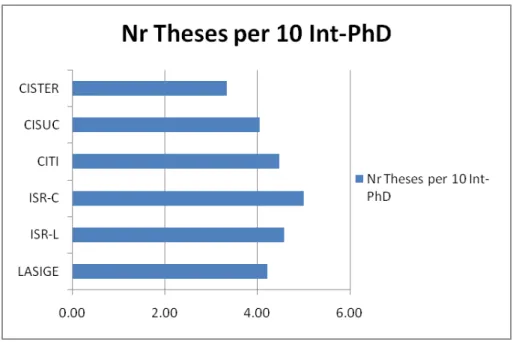
Figure 15: PhD theses produced per 10 Int-PhD produced during the period 2003-2006: Gross Weight PhD theses figure divided by 10 Int-PhD (for read-ability)
Figure 16: Distribution of Int-PhD researchers by their number of cited papers
Figure 17: Distribution of Int-PhD researchers by their number of citations (excluding self-citations)
Figure 18: Distribution of Int-PhD researchers by their h-index (excluding self-citations)
Figure 19: Distribution of Int-PhD researchers by their number of cited papers published between 2003 and 2006
Figure 20: Distribution of Int-PhD researchers by their number of citations (excluding self-citations) to the papers published between 2003 and 2006
4
Results
4.1
Gross Weight and Relevance
Gross results are useful to measure weight and critical mass of the unit based on the global output and relevance of the collection of its Integrated PhD re-searchers, over their career. However, they are also biased by the maturity and the sheer size of the unit, i.e. units with more mature researchers and higher dimension tend to accumulate more papers and citations, that is, they don’t account for the unit’s efficiency and effectiveness.
Gross results that were calculated:
1. Number of Exclusive Integrated PhD researchers of the unit (#Int-PhD) (Figure 2).
2. Unique cited papers (Figure 3): global publication figure created from the union of the papers found (with at least one citation) from each individual Integrated PhD researcher (thus eliminating repetitions, e.g., papers co-authored by unit researchers are only referred once).
3. Unique citations (Figure 4): global citation figures created from the union of citations found to each of the papers from individual Integrated PhD researchers calculated above (thus eliminating repetitions, e.g., citations to papers co-authored by unit researchers are only referred once).
4.2
Weight and Relevance per Capita
Weight and relevance per capita results (e.g., figures ’per InT-PhD’) actually provide some measure of the unit’s relative density (weight and relevance per capita), by estimating the output and relevance per individual Int-PhD. These metrics yield effective comparability of units, because they measure results of researchers over their career, but take into account the size of the unit. Special
emphasis should be given to the h-index, a true measure of substance and con-sistency of both production and impact over the years, since an author’s h-index is given by the highest number n of papers with at least n citations.
Per Capita results that were calculated:
1. Unique cited papers per Int-PhD (Figure 5): Gross Weight publication figure divided by #Int-PhD.
2. Unique citations per Int-PhD (Figure 6): Gross Weight citations figure divided by #Int-PhD.
3. Average of h-index (Figure 7): sum of the h-index of each Int-PhD, divided by #Int-PhD.
4.3
Gross Production and Impact (03-06)
Gross production and impact results are useful to measure outputs of the unit over a period, based on the collection of its Integrated PhD researchers, re-gardless of their maturity. However, they are still biased by the sheer size of the unit, i.e. units with higher dimension tend to accumulate more papers and citations, that is, they don’t account for the unit’s efficiency and effectiveness. These metrics yield nevertheless limited comparability between units’ critical mass production.
For a period of reference, it normally only makes sense to evaluate impact after so many years. For significance, this metrics evaluates the output of an n year period, n years later. That is, for the 4-year period 03-06, we are evaluating four years later, i.e. in 2010.
Gross results (03-06) that were calculated:
1. Unique cited papers (Figure 8): union of the papers found from each individual Int-PhD published in the period.
2. Unique citations (Figure 9): union of citations found to each of those papers.
3. National and International projects (Figure 10): numbers of research projects started during the period.
4. PhD theses produced (Figure 11): numbers of PhD theses finished during the period.
4.4
Production and Impact per capita (03-06)
Per capita results (e.g., figures ’per Int-PhD’) over a period actually provide a measure of the unit’s efficiency and effectiveness w.r.t. productivity and respec-tive impact, feasibility (in terms of actual research projects) and training (in terms of PhD theses). These metrics yield precise comparability of production and impact of units, because they take into account both the size of the unit and a same reference period, thus neutralizing maturity. As explained earlier, for the 4-year period 03-06, we are evaluating four years later, i.e. in 2010.
1. Unique cited papers per Int-PhD (Figure 12): union of the papers pub-lished in the period, found from each individual Int-PhD, divided by #Int-PhD.
2. Unique citations per Int-PhD (Figure 13): union of citations found to each of those papers, divided by Int-PhD.
3. National and International projects per 10 × #Int − P hD (Figure 14): numbers of research projects started during the period, divided by 10 × #Int − P hD (for readability).
4. PhD theses produced per 10 × #Int − P hD (Figure 15): numbers of PhD theses finished during the period, divided by 10 × #Int − P hD (for readability).
4.5
Distribution of Relevance and Impact
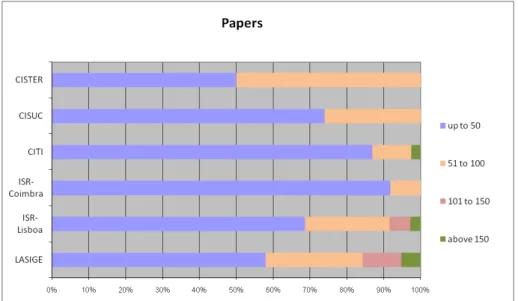
These metrics estimate the distribution of the impact and relevance of individual Int-PhD unit members, for each unit. These metrics yield effective compara-bility between units, since the distribution is in percentage of the number of members. Together, they yield a macroscopic estimate of each unit’s impact and relevance, by reading the bar lengths: the more significant the bars to the right, the better. Again, special mention should be made to the h-index distributions.
(QNT (papers — CITS NS — H NS)) measures the percentage of population of Int-PhD of each unit that falls between selected thresholds, for each of: pa-pers, citations exclusive of self-citations, and h-index exclusive of self-citations. For example, % of researchers with: up to 50 papers; 51-100; 101-150; above 150. Results are shown in Figures 16, 17 and 18.
4.6
Distribution of Relevance and Impact (03-06)
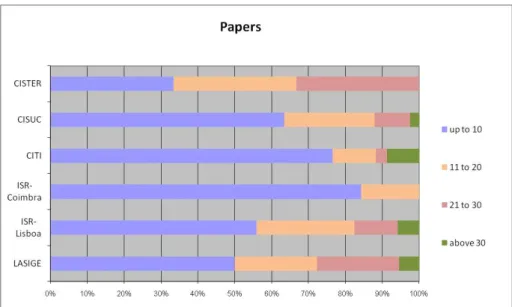
These metrics estimate the distribution of the impact and relevance of individual Int-PhD unit members’ output over the period, for each unit. These metrics yield effective comparability between units, by giving a macroscopic estimate of the contributions of individual researchers to a unit’s production and respective citations over a period. Again, on reading the bar lengths: the more significant the bars to the right, the better. As explained earlier, for the 4-year period 03-06, we are evaluating four years later, i.e in 2010. Also note: h-index is not included since it does not apply to short periods.
(QNT (papers — CITS NS)) (03-06) measures the percentage of population of Int-PhD of each unit that falls between selected thresholds, for each of: papers published in the period, and citations to them exclusive of self-citations. Results are shown in Figures 19 and 20.
5
Conclusions
This paper presents a study that compared a set of representative Portuguese research units using objective parameters. The calculations of these parame-ters were based on public and official information, retrievable on-line and thus
verifiable and repeatable. The study was able to produce aggregate data about institutions, of comparative statistical value, which the FCT ToR more than fit suitably.
The results show that the parameters chosen for this study perform quite well, since they provided a good match to the official evaluation results, which demonstrates the feasibility of applying such parameters in a research unit evalu-ation setting. These kind of benchmarking studies are essential in any excellence system like the Portuguese SC&T, and common in developed countries, but they are normally expensive and specific to a given period and domain.
On the contrary, our study required minimal human intervention, since it collected most of the information using automatic tools, such as CIDS, from publicly available resources. This resulted on the analysis of a set of extensive information that can be easily keep up to date, since we can track public data sources automatically for updates as they evolve. Moreover, our approach could be easily extended to other fields as long as similar sources of information are available.
We plan on extending the study, but the study itself can be extended by anyone wishing. This will become even easier with the next version of CIDS that will use AJAX technology to provide a preview of the results, which can be verified as they are completed on-the-fly with the missing numbers.
The main goal of this study was to calculate and show objective numbers, avoiding controversial discussions about the chosen parameters. However, in the future we plan to perform more extensive sensitivity analyses, for exam-ple, to verify the effect of discerning self-citations and to measure the impact
of homonymous authors. For doing this, we will look forward for available
datasets containing manually verified associations of publications and citations to authors.
Acknowledgements
We would like to thank Ana Luisa Resp´ıcio for the valuable advices on statis-tics; Pedro Antunes for the manual evaluation of CIDS results; Helena Gal-hardas amd Emanuel Santos for calculating the number of Scholar duplicates;
Lu´ıs Caires, Eduardo Tovar, and M´ario J. Silva for their many valuable
sug-gestions and comments, and several other researchers for point sugsug-gestions and for encouraging us to pursue this avenue. We would like to thank all LaSIGE members who used the tool and reviewed the results.
References
[1] W. Aksnes. A macro study of self-citation. Scientometrics, 56(2):235–246, 2003.
[2] P. Ball. Index aims for fair ranking of scientists. Science Focus,
436(7053):900, 2005.
[3] R. Belew. Scientific impact quantity and quality: Analysis of two sources of bibliographic data. arXiv:cs.IR/0504036, 1, 2005.
[4] L. Bornmann and H. Daniel. Does the h-index for ranking of scientists really work? Scientometrics, 65(3):391–392, 2005.
[5] J. Bosman, I. Mourik, M. van Rasch, E. Sieverts, and H.
Verho-eff. Scopus reviewed and compared. the coverage and
function-ality of the citation database Scopus, including comparisons with
Web of Science and Google Scholar. Utrecht University Library.
Available at: http: // igitur-archive. library. uu. nl/ DARLIN/
2006-1220-200432/ Scopus% 20doorgelicht% 20% 26% 20vergeleken% 20-% 20translated. pdf , 2006.
[6] F.M. Couto, C. Pesquita, T. Grego, and P. Verissimo. Handling
self-citations using Google Scholar. Cybermetrics, (13):2, 2009.
[7] P. Daniel and K. Stergiou. Equivalence of results from two citation analyses: Thompson isi’s citation index and google’s scholar service. Ethics in Science and Environmental Politics, pages 33–35, 2005.
[8] W. Gl¨anzel. On the opportunities and limitations of the h-index. Science
Focus, 1(1):10–11, 2006.
[9] A. Harzing and R. Wal. Google Scholar as a new source for citation analysis. Ethics in Science and Environmental Politics, e008:5, 2007.
[10] J. Hirsch. An index to quantify an individual’s scientific research output. Proceedings of the National Academy of Sciences, 102:16569, 2005.
[11] JE Hirsch. Does the h index have predictive power? Proceedings of the
National Academy of Sciences, 104(49):19193, 2007.
[12] C. Holden. Random samples: Data point - impact factor. Science Magazine, 309(5738):1181, 2006.
[13] Ken Hyland. Self-citation and self-reference: Credibility and promotion in academic publication. Journal of the American Society for Information Science and Technology, 54(3):251–259, 2003.
[14] I.S. Kang, S.H. Na, S. Lee, H. Jung, P. Kim, W.K. Sung, and J.H. Lee. On co-authorship for author disambiguation. Information Processing and Management, 45(1):84–97, 2009.
[15] S. Lawrence, C.L. Giles, and K. Bollacker. Digital libraries and autonomous citation indexing. IEEE computer, 1999.
[16] M. MacRoberts and B. MacRoberts. Problems of citation analysis: A
critical review. Journal of the American Society for Information Science and Technology, 40(5):342–349, 1989.
[17] L. Meho and K. Yang. A new era in citation and bibliometric analyses: Web of science, scopus, and google scholar. Journal of the American Society for Information Science and Technology, 58:1–21, 2007.
[18] T. Nisonger. Citation autobiography: an investigation of ISI database
coverage in determining author citedness. College & Research Libraries, 65(2):152–163, 2007.
[19] H. Roediger. The h index in science: A new measure of scholarly contribu-tion. APS Observer: The Academic Observer, 19, 2006.
[20] G. Saad. Exploring the h-index at the author and journal levels using biblio-metric data of productive consumer scholars and business-related journals respectively. Scientometrics, 69(1):117–120, 2006.
[21] M. Schreiber. The influence of self-citation corrections on Egghe’s g index. Scientometrics, 76(1):187–200, 2008.