Revista Brasileira de
Engenharia Agrícola e Ambiental
Campina Grande, PB, UAEA/UFCG – http://www.agriambi.com.br
v.20, n.10, p.925-929, 2016
Water stress indices for the sugarcane crop on different irrigated surfaces
Rodrigo G. Brunini
1& José E. P. Turco
1DOI: http://dx.doi.org/10.1590/1807-1929/agriambi.v20n10p925-929
A B S T R A C T
Sugarcane (Saccharum officinarum L.) is a crop of vital importance to Brazil, in the production of sugar and ethanol, power generation and raw materials for various purposes. Strategic information such as topography and canopy temperature can provide management technologies accessible to farmers. The objective of this study was to determine water stress indices for sugarcane in irrigated areas, with different exposures and slopes. The daily water stress index of the plants and the water potential in the soil were evaluated and the production system was analyzed. The experiment was carried out in an “Experimental Watershed”, using six surfaces, two horizontal and the other ones with 20 and 40% North and South exposure slopes. Water stress level was determined by measuring the temperatures of the vegetation cover and the ambient air. Watering was carried out using a drip irrigation system. The results showed that water stress index of sugarcane varies according to exposure and slope of the terrain, while areas whose water stress index was above 5.0 °C had lower yield values.
Índices de estresse hídrico para a cultura
de cana-de-açúcar em diferentes superfícies irrigadas
R E S U M O
A cana-de-açúcar (Saccharum officinarum L.) é uma cultura de fundamental importância para o Brasil, na produção de açúcar e etanol, geração de energia e matérias-primas para diversos fins. Informações estratégicas como topografia do terreno e temperatura do dossel vegetativo podem fornecer tecnologias de manejo acessíveis ao produtor rural. Objetivou-se, neste estudo, determinar índices de estresse hídrico para a cana-de-açúcar em superfícies irrigadas, com diferentes exposições e declividades. Foram avaliados o índice de estresse hídrico diário das plantas e o potencial de água no solo e analisada a condução do sistema produtivo. A pesquisa foi desenvolvida em uma “Bacia Hidrográfica Experimental” utilizando-se seis superfícies, duas na horizontal e as demais com declividades de 20 e 40% e exposições norte e sul. O índice de estresse hídrico foi determinado por meio da medição da temperatura da cobertura vegetal e do ar ambiente. A rega foi realizada utilizando-se sistema de irrigação por gotejamento. Os resultados deste estudo mostraram que o índice de estresse hídrico na cana-de-açúcar varia de acordo com a exposição e declividade do terreno enquanto as superfícies cujo índice de estresse hídrico foi acima de 5,0 °C apresentaram menores valores de produtividade.
Key words: water stress leaf temperature slope
water and soil management
Palavras-chave: déficit hídrico temperatura foliar declividade
manejo de água e solo
1 Universidade Estadual Paulista/Faculdade de Ciências Agrárias e Veterinárias/Laboratório de Instrumentação, Aquisição e Processamento. Jaboticabal, SP.
E-mail: rgbrunini@gmail.com (Corresponding author); jepturco@fcav.unesp.br
Introduction
The sugarcane crop (Saccharum officinarum L.) is of great importance in Brazil, both economically and environmentally. For the 2015/16 season, an increase of about 12.2 million hectares is estimated with production of 902.8 million tons of processed cane (CONAB, 2015). According to the data of IEA (2015), approximately 80% of the area cultivated with sugarcane in the 2013/14 seasons have rainfalls below the expected and significant increase in mean maximum temperatures.
The effective monitoring of the irrigation technology in the sugarcane crop is essential for its production (Carr & Knox, 2011). According to Silva et al. (2014), evapotranspiration is the main component of water loss to the atmosphere in a water balance, which is the relationship between canopy temperature and soil water potential. The vegetation canopy temperature is a parameter that can be used in the detection of biotic and abiotic symptoms of the plants, acting as a good indicator of water stress and having direct influence on their metabolism (Wang et al., 2010). Many authors, such as Fernandes (2010), Vieira et al. (2014) and Morales et al. (2015), have used the infrared thermometer in studies on the soil-plant-atmosphere system.
The water stress index of the crops, proposed by Idso et al. (1981), allows to find, in a practical way, the daily water stress index (DWSI) for the plants. Silva et al. (2008) and Holanda et al. (2015) utilized this index to evaluate water stress in sugarcane. The literature is scarce about the water stress index for the sugarcane crop cultivated under different exposures and slopes.
In this context to provide scientific and technical information, this study aimed to determine the daily water stress indices in sugarcane cultivated under different exposures and slopes.
Material and Methods
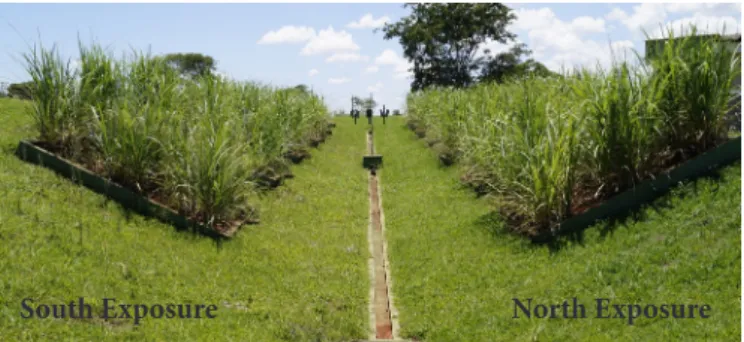
The research was carried out in an experimental area of the Rural Engineering Department of the FCAV/UNESP, Campus of Jaboticabal, SP, Brazil (21o 14’ 05” S; 48º17’ 09” W; 613.68 m), in a structure called Experimental Watershed (Figure 1), described in detail by Turco et al. (1997).
The soil of the surfaces was conveniently homogenized and classified as Dark Red Latosol, eutrophic, with moderate A horizon, kaolinitic, hypoferric, with clayey texture and
gently undulating relief. The climate in the area, according to Köppen’s classification, is Cwa, with mean annual rainfall of 1,400 mm, mean annual temperature of 22 ºC and mean relative air humidity of 70%.
In this structure, the experiment was conducted from August 1, 2014, to April 7, 2015 (comprehending the crop stages of tillering, growth and maturation) using six surfaces that simulate terrains with exposures and slopes characterized as HI (horizontal irrigated), HNI (horizontal not irrigated), 20N (20% slope, North exposure irrigated), 20S (20% slope, South exposure irrigated), 40N (40% slope, North exposure irrigated) and 40S (40% slope, South exposure irrigated). The sugarcane variety RB855453 was cultivated and the evaluations were performed in the central row of all surfaces in three plants, in each linear meter, totaling three replicates.
The meteorological data referring to the entire period of installation and conduction of the experiment were obtained from an automatic weather station (Davis Instruments).
Soil samples of the surfaces were collected at the depths of 0.20 m and 0.40 m using the gravimetric method (ABNT, 1986), to monitor the soil moisture content. In the center of each surface, three tensiometers were installed at depths of 20 and 40 cm, respectively, to monitor the behavior of the soil water potential. The amount of water applied on each surface was based on the values of Evapotranspiration (ET0), obtained through the Penman-Monteith method (Allen et al., 1998). Its values were corrected for each surface, according to the methodology described by Turco et al. (2012).
Drip irrigation was applied on each surface through six 3.5-m-long hoses, with emitters spaced at 20 cm along its entire extension, with mean flow rate of 90 L h-1. The irrigation interval was performed according to the sum of crop evapotranspiration, maintaining the soil always at field capacity (Faria et al., 2012).
To evaluate the sugarcane DWSI on each surface, daily measurements were performed (except on days of rainfall, occurrence of strong wind and/or cloudy weather) between 11 and 13 h, with 10 readings in each replicate of the plots, by measuring the temperatures of the vegetal cover and the ambient air, at the same time, using a portable infrared thermometer (FLUKE - 62 MAX+) and a mercury thermometer (precision ± 0.1 °C) respectively. DWSI was calculated based on the difference between the mean temperatures of the vegetal cover and the ambient air, according to Jackson et al. (1977), who proposed the following equation (Eq. 1):
Figure 1. Experimental Watershed, North and South exposures
South Exposure North Exposure
where:
DWSI - daily water stress index, °C;
Tc - temperature of the vegetal cover, °C; and Ta - air temperature, °C.
On April 8, 2015, sugarcane plants were harvested in the three replicates of each surface; plants were weighed and yield was calculated through the total weight per square meter, and these values were extrapolated for one hectare. The obtained data were subjected to analysis of variance by F test and then Tukey test (p < 0.05).
Results and Discussion
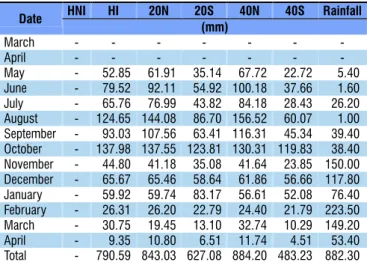
Table 1 shows the monthly water depths received in each treatment and the rainfall, in their respective months of occurrence. The total amount of water received from the rainfalls was 882.3 mm, which allowed the development of the crop in the HNI treatment. The surfaces 40 and 20N showed the highest water depths through irrigation, 884.20 and 843.03 mm, respectively, while the 40S surface showed the lowest water depth through irrigation (483.23 mm), differing from the HI surface (790.19 mm). These values are related to the evapotranspiration and the amount of solar radiation, which were different on each one of the surfaces due to their exposure and slope (Turco et al., 1997).
The 20 and 40S surfaces received, respectively, 79.3 and 61.1% of the total water depth applied on the HI surface, while the 20 and 40N surfaces received, on average, about 9.2% more of the applied water depth. The lack of water for the crop in the tillering period affects the immature tissues of the plant and ultimately damages the processes of storage of sugar (Machado et al., 2009).
According to Machado et al. (2009), water deficit in sugarcane is the main responsible for the variability in plant growth and yield. In the present study, it was possible to observe that, during the initial months of sugarcane growth, there were limitations of the rainfall in 2014 for the region, agreeing with the data presented by IEA (2015) (Table 1).
For Carvalho et al. (2009), Barbosa et al. (2012) and Holanda et al. (2015), complementary irrigation in sugarcane has been increasingly used by the producers due to the reduction in the production, either in semi-arid regions or in periods of intense water stress.
In Figure 2A, B, C and D, it is possible to observe the mean data of DWSI, for all treatments, according to the days after emergence (DAE). From 128 to 166 DAE (tillering stage), all treatments showed positive values of DWSI, while the HNI surface showed the highest value (15.9 °C), followed by 20N (6.4 °C) (Figure 2A) and 40N (5.2 °C) (Figure 2C). The HI surface showed the lowest value (1.5 °C).
From 170 DAE onwards, the surfaces, except HNI, showed negative values until 222 DAE (growth stage) and, from 222 to 340 DAE (maturation stage), there were small increments, on average, of 1.2 °C in the DWSI on the surfaces HNI, 20S and 40N (Figures 2B and 2C), indicating that the daily evapotranspiration
HNI - Horizontal not irrigated; HI - Horizontal irrigated; 20N - 20% slope and North exposure; 20S - 20% slope and South exposure; 40N - 40% slope and North exposure and 40S - 40% slope and South exposure
Date HNI HI 20N 20S 40N 40S Rainfall
(mm)
March - - -
-April - - -
-May - 052.85 061.91 035.14 067.72 022.72 005.40 June - 079.52 092.11 054.92 100.18 037.66 001.60 July - 065.76 076.99 043.82 084.18 028.43 026.20 August - 124.65 144.08 086.70 156.52 060.07 001.00 September - 093.03 107.56 063.41 116.31 045.34 039.40 October - 137.98 137.55 123.81 130.31 119.83 038.40 November - 044.80 041.18 035.08 041.64 023.85 150.00 December - 065.67 065.46 058.64 061.86 056.66 117.80 January - 059.92 059.74 083.17 056.61 052.08 076.40 February - 026.31 026.20 022.79 024.40 021.79 223.50 March - 030.75 019.45 013.10 032.74 010.29 149.20 April - 009.35 010.80 006.51 011.74 004.51 053.40 Total - 790.59 843.03 627.08 884.20 483.23 882.30
Table 1. Monthly water depth received by the crop in each treatment and rainfall, in mm, along the experiment
Figure 2. Daily water stress index, in ºC, for the treatments HI, HNI and 20N (A); HI, HNI and 20S (B); HI, HNI and 40N (C) and HI, HNI and 40S (D)
-10 -5 0 5 10 15 20
128 140 158 170 184 200 222 244 259 304 338
Tillering Growth Maturation
Da
ily
wat
er
st
re
ss
in
de
x(
oC)
Days after emergence
HI HNI 40S
-10 -5 0 5 10 15 20
Tillering Growth Maturation
Da
ily
wat
er
st
re
ss
in
de
x(
oC)
HI HNI 40N
-10 -5 0 5 10 15 20
Tillering Growth Maturation
Da
ily
wat
er
st
re
ss
in
de
x(
oC)
HI HNI 20S
-10 -5 0 5 10 15 20
Tillering Growth Maturation
Da
ily
wat
er
st
re
ss
in
de
x(
oC)
HI HNI 20N
D. C. B. A.
of the crop decreased because the vegetation canopy temperature was below that of the air temperature.
The value of DWSI reflects the physiological characteristics of the plants in relation to the environment (Idso et al., 1981). The higher the water stress index, the greater the daily evapotranspiration of the crop, thus reflecting in the moment of irrigation.
According to the data presented by IEA (2015) and CTC (2015), water stress in the 2013/14 season favored severe damages to the sugarcane crop, which reached yield reductions of more than 25%. This reduction is due to the areas that were most affected by the lack of rainfall and to the increase in mean maximum temperatures, which increased by 5.5% in relation to the previous seasons.
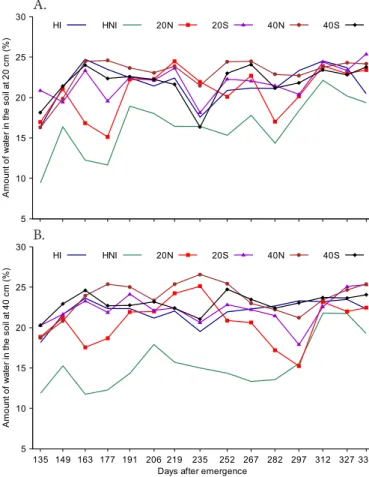
In Figure 3A and 3B, for the results obtained in this period, the HNI surface shows values of available water in the soil below 20% in the layers of 20 and 40 cm. According to Oliveira et al. (2014), water availability in the soil directly affects the root system of the plants and their development, along the production cycle.
According to Table 2, the HNI surface obtained the highest maximum values of temperature of vegetal cover, reaching 53.3 ºC, due to the water stress in the crop. This increase in temperature is directly related to the physiological relationships and the cellular growth of the plant (Manhães et al., 2015).
The surfaces 20 and 40N (Table 2) also showed maximum values of temperature of the vegetal cover during the tillering
stage, reaching 40.5 and 36.5 ºC, respectively, besides the climatic conditions, which can be explained by their exposures and terrain slopes, since they are subject to the largest amounts of solar radiation, 8248.2 and 8329.3 MJ m-2 year-1, respectively. The 20S surface showed the lowest value of temperature during the tillering stage (Table 2) and, according to Jadoski et al. (2010), sugarcane tillering is directly affected by soil moisture, luminosity and temperature, increasing until a maximum of 30.0 ºC.
The data of mean sugarcane yield (Mg ha-1) and their relationship with the maximum DWSI in the period (ºC) for each surface are shown in Figure 4. The highest value of mean yields occurred for the 20S surface (194.5 Mg ha-1), followed by HI (152.0 Mg ha-1). These surfaces exhibit maximum DWSI values of 3.5 and 1.5 ºC, respectively, while the surfaces HNI and 40S obtained the lowest productions (91.0 and 97.0 Mg ha-1) and maximum DWSI values in the period of 15.9 and 3.2 ºC, respectively. Holanda et al. (2015), studying the
HNI - Horizontal not irrigated; HI - Horizontal irrigated; 20N - 20% slope and North exposure; 20S - 20% slope and South exposure; 40N - 40% slope and North exposure; and 40S - 40% slope and South exposure
Development stage
HNI HI 20N 20S 40N 40S
(°C)
Tillering 48.7 35.9 40.8 34.3 36.5 35.6 Growth 53.3 33.2 37.6 35.0 36.3 35.8 Maturation 35.0 32.6 33.5 33.1 33.4 32.9 Radiation
Accumulated (MJ m
-2year-1)
Total 7686.6 7686.6 8248.2 6921.0 8329.3 6013.7
Table 2. Maximum temperature of the vegetal cover, in ºC, for the treatments HI, HNI, 20N, 20S, 40N and 40S in the sugarcane development stages and incident global solar radiation, accumulated in MJ m-2 year-1
Figure 3. Amount of available water in the soil at 20 (A) and 40 cm depth (B), of the treatments HI, HNI, 20N, 20S, 40N and 40S in the period
5 10 15 20 25 30
135 149 163 177 191 206 219 235 252 267 282 297 312 327 339
Amo
unt
of
wat
er
in
th
es
oi
la
t4
0c
m(
%)
Days after emergence
HI HNI 20N 20S 40N 40S
5 10 15 20 25 30
Amo
unt
of
wat
er
in
th
es
oi
la
t2
0c
m(
%)
HI HNI 20N 20S 40N 40S
B. A.
Figure 4. Sugarcane yield and maximum daily water stress index (DWSI) in ºC, for the studied surfaces
0 20 40 60 80 100 120 140 160 180 200
HNI HI 20N 40N 20S 40S
0 2 4 6 8 10 12 14 16 18
Yi
el
d(
Mg
ha
-1)
Maxi
mu
mD
WS
I(
oC)
Surfaces 15.90
1.47
6.36
5.25
3.45 3.23
*Means followed by different letters differ by Tukey test (p ˂ 0.05). CV = 8.4%
Surfaces Mean yield
(Mg ha-1)
Slope - 0% Irrigated 152.0 b Slope - 0% Not irrigated 091.0 d
North - 20% 120.5 c
South - 20% 194.5 a
North - 40% 131.0 c
South - 40% 097.0 d
Table 3. Mean yield of sugarcane
HNI - Horizontal not irrigated; HI - Horizontal irrigated; 20N - 20% slope and North exposure; 20S - 20% slope and South exposure; 40N - 40% slope and North exposure; and 40S - 40% slope and South exposure
variety RB855453 under different irrigation depths, observed that, in treatments under water stress, there was a reduction of 24.4% in plant height in relation to the treatments without stress, directly influencing crop yield.
According to Table 3, there was no significant difference between the yields of the surfaces 20 and 40N, whose daily evapotranspiration values were higher, showing yields of 120.5 and 131.0 Mg ha-1, respectively. For the 40S surface, despite receiving the same water depth according to its ET0, its yield was equal to 97.0 Mg ha-1, with maximum DWSI of 3.2 °C (Figure 4), indicating that this surface is more susceptible to water stress, climatic variations in the tillering stage and to the amount of incident radiation (Table 2). According to Manhães et al. (2015), the tillering stage suffers greater influence of temperature and luminosity, and the incident radiation may affect its final production .
Conclusions
1. The daily water stress index differs according to the slope, exposure to the sun and sugarcane development stage.
2. The surfaces with DWSI above 5.0 °C tend to show lower production values.
3. The development of sugarcane (variety RB855453) suffers influence from the exposure to the sun and terrain slope.
4. The irrigation of sugarcane on the HI surface is efficient in altering its yield in relation to the HNI surface.
Literature Cited
ABNT - Associação Brasileira de Normas Técnicas. NBR 06457: Preparação de amostras de solos para ensaios de compactação e ensaios de caracterização. Rio de Janeiro: ABNT, Versão 2009. 1986. 9p. Allen, R. G.; Pereira, L. S.; Raes, D.; Smith, M. Crop evapotranspiration:
Guidelines for computing crop water requirements. Rome: FAO, 1998. 300p. Irrigation and Drainage Paper, 56
Barbosa, E. A. A.; Arruda, F. B.; Pires, R. C. M.; Silva, T. J. A.; Sakai, E. Cana-de-açúcar com vinhaça e adubos minerais via irrigação por gotejamento subsuperficial: Ciclo da cana-planta. Revista Brasileira de Engenharia Agrícola e Ambiental, v.16, p.952-958, 2012. http://dx.doi.org/10.1590/S1415-43662012000900005 Carr, M. K. V.; Knox, J. W. The water relations and irrigation
requirements of sugarcane (Saccharum officinarum): A review. Experimental Agriculture, v.47, p.1-25, 2011. http://dx.doi. org/10.1017/S0014479710000645
Carvalho, C. M.; Azevedo, H. M. de; Dantas Neto, J.; Farias, C. H. A.; Silva, C. T. S.; Gomes Filho, R. R. Rendimento de açúcar e álcool da cana-de-açúcar submetida a diferentes níveis de irrigação. Revista Brasileira de Ciências Agrárias, v.4, p.72-77, 2009. http:// dx.doi.org/10.5039/agraria.v4i1a12
CONAB - Companhia Nacional de Abastecimento. Acompanhamento da Safra Brasileira: Cana-de-açúcar. Brasília: CONAB, v.2. 2015. 33p. CTC - Centro de Tecnologia Canavieira. Revista Censo CTC: Safra
2013/2014 - Brasil, v.1, p.1-16, 2015.
Faria, M. T.; Turco, J. E.; Fernandes, E. J.; Guirra, A. M. Resposta produtiva do feijoeiro comum a diferentes manejos de irrigação. Irriga, v.17, p.137-147, 2012. http://dx.doi.org/10.15809/irriga.2012v17n2p137 Fernandes, E. J. Determinação do índice de estresse hídrico em cultura
do feijoeiro com termômetro de infravermelho. Irriga, v.15, p.248-257, 2010. http://dx.doi.org/10.15809/irriga.2010v15n3p248
Holanda, L. A.; Santos, C. M.; Sampaio Neto, G. D.; Sousa, A. de P.; Silva, M. de A. Variáveis morfológicas da cana-de-açúcar em função do regime hídrico durante o desenvolvimento inicial. Irriga, v.19, p.573-584, 2015. http://dx.doi.org/10.15809/irriga.2014v19n4p573 Idso, S. B.; Jackson, R. D.; Pinter, P. J.; Reginato, R. J.; Hatfield, J. L.
Normalizing the stress-degree-day parameter for environmental variability. Agricultural Meteorology, v.24, p.45-55, 1981. http:// dx.doi.org/10.1016/0002-1571(81)90032-7
IEA - Instituto de Economia Agrícola. Banco de dados. São Paulo: IEA. <http://www.iea.sp.gov.br/out/verTexto.php?codTexto=13601>. 20 Mai. 2015.
Jackson, R. D.; Reginato, R. J.; Idso, S. B. Wheat canopy temperature: A practical tool for evaluating water requirements. Water Resources Research, v.13, p.651-656, 1977. http://dx.doi.org/10.1029/ WR013i003p00651
Jadoski, C. J.; Toppa, B. E. V.; Julianetti, A.; Hulsbof, T.; Ono, E. O.; Rodrigues, J. D. Physiology development in the vegetative stage of sugarcane. Pesquisa Aplicada e Agrotecnologia, v.3, p.169-186, 2010. Machado, R. S.; Ribeiro, R. V.; Marchiori, P. E. R.; Machado, D. F. S.
P.; Machado, E. C.; Landell, M. G. de A. Respostas biométricas e fisiológicas ao déficit hídrico em cana-de-açúcar em diferentes fases fenológicas. Pesquisa Agropecuária Brasileira, v.44, p.1575-1582, 2009. http://dx.doi.org/10.1590/S0100-204X2009001200003 Manhães, C. M. C.; Garcia, R. F.; Francelino, F. M. A.; Francelino, H. de
O.; Coelho, F. C. Fatores que afetam a brotação e o perfilhamento da cana-de-açúcar. Vértices, v.17, p.163-181, 2015. http://dx.doi. org/10.5935/1809-2667.20150011
Morales, R. G. F.; Resende, L. V.; Bordini, I. C.; Galvão, A. G.; Rezende, F. C. Caracterização do tomateiro submetido ao déficit hídrico. Scientia Agraria, v.16, p.9-17, 2015. http://dx.doi.org/10.5380/ rsa.v16i1.41042
Oliveira, A. R.; Braga, M. B.; Santos, B. L. S. Produção de biomassa de cana-de-açúcar no vale do São Francisco. Energia na Agricultura, v.29, p.27-38, 2014. http://dx.doi.org/10.17224/ energagric.2014v29n1p27-38
Silva, M. A.; Soares, R. A. B.; Landell, M. G. A.; Campana, M. P. Agronomic performance of sugarcane families in response to water stress. Bragantia, v.67, p.655-661, 2008. http://dx.doi. org/10.1590/S0006-87052008000300014
Silva, V. de P. R. da; Borges, C. J. R.; Albuquerque, W. G. Necessidades hídricas da cana-de-açúcar cultivada em clima tropical. Semina: Ciências Agrárias, v.35, p.625-632, 2014. http://dx.doi. org/10.5433/1679-0359.2014v35n2p625
Turco, J. E.; Milani, A. P.; Fernandes, E. J. Adequacy of the Penman-Monteith method to irrigated surface with different exposures and declivity. In: International Conference of Agricultural Engineering. Proceedings... Valencia: CIGR - AGENG 2012. CD-Rom
Turco, J. E. P.; Pinotti Júnior, M.; Rodrigues, T. J. D.; Fernandes, E. J. Desenvolvimento da cultura de soja em terrenos com diferentes exposições e declividades. Engenharia Agricola, v.17, p.21-28, 1997. Vieira, G. H. S.; Mantovani, E. C.; Sediyama, G. C.; Delazari, F. T. Morpho-physiological indicators of water stress on sugarcane as a function of irrigation depths. Bioscience Journal, v.30, p.65-75, 2014.