RBRH, Porto Alegre, v. 22, e28, 2017 Scientiic/Technical Article
http://dx.doi.org/10.1590/2318-0331.021720160032
Development of management Tool for Water Risk Assessment (FARH):
application in the mineral metalurgical segment in Brazil
Desenvolvimento de Ferramenta de Gestão para Avaliação de Risco Hídrico (FARH): aplicação no segmento minero metalúrgico no Brasil
Thaiza Clemente Couto Bissacot1 and Sílvia Maria Alves Corrêa Oliveira1
1Universidade Federal de Minas Gerais, Belo Horizonte, MG, Brazil
E-mails: [email protected] (TCCB), [email protected] (SMACO)
Received: October 14, 2016 - Revised: January 21, 2017 - Accepted: January 27, 2017
ABSTRACT
Although water governance in the industrial sector has evolved in recent years, water risk management is still considered a challenge in the country. In this way, the present article had the objective of developing a Management Tool for Water Risk Assessment (FARH) in the mining-metallurgical segment. The structural format of the FARH was based on input blocks, processing and data output with the purpose of elaborating a risk matrix (dashboard). The dashboard based on the characterization of the situation of the river basin in relation to the degree of water stress (Y axis), characterization of the water management status of the enterprise (X axis) and the deinition of the level of dependence in relation to the water resource. The tool was applied on a pilot scale in 09 (nine) mining-metallurgical enterprises located in the States of Minas Gerais, Goiás and São Paulo (Zn, Ni, Al). With the validation of the FARH criteria, the data platforms were inserted in “macro excel” to computerize their application. The risk matrix allowed the consolidated visualization of the data and provided a technical basis for the prioritization of actions, allocation of resources within an organization and preparation of a guide for the development of the water management plan of these enterprises.
Keywords: Tool management; Water risk assessment; Metallurgical and mining sector.
RESUMO
Embora a governança da água no setor industrial tenha evoluído nos últimos anos, a gestão dos riscos hídricos ainda é considerada um desaio no país. Desta forma, o presente artigo teve como objetivo o desenvolvimento de uma Ferramenta de Gestão para Avaliação de Risco Hídrico (FARH) no segmento minero-metalúrgico. A formatação estrutural da FARH foi realizada com base em blocos de entradas, processamento e saída de dados com vistas à elaboração de uma matriz de risco (dashboard) balizado pela caracterização da situação da bacia hidrográica em relação ao grau de estresse hídrico (Eixo Y), caracterização do status de gestão hídrica do empreendimento (Eixo X) e pela deinição do nível de dependência em relação ao recurso hídrico. A ferramenta foi aplicada em escala piloto em 09 (nove) empreendimentos do segmento mínero-metalúrgico localizados nos estados de Minas Gerais, Goiás e São Paulo (Zn, Ni, Al). Com a validação dos critérios da FARH, as plataformas de dados foram inseridas em “macro excel” para informatização da sua aplicação. A matriz de risco permitiu a visualização consolidada dos dados e forneceu base técnica para a priorização de ações, alocação de recursos dentro de uma organização e elaboração de um guia para o desenvolvimento do plano de gestão hídrica destes empreendimentos.
INTRODUCTION
In recent years, as organizations have come under increasing pressure to reduce uncertainties, the need to manage risks, including those of environmental nature, has come to be recognized as an essential element of good corporate governance practice (IBGC, 2007).
The permanent water availability is not clear and as the value chains have been expanding globally, the evaluation of the water risk remains a business challenge, even in places with a history of water abundance (MUELLER et al., 2015).
The water crisis associated with scarcity and lack of access to potable water is considered by the World Economic Forum as the greatest risk that humanity will face in the next decade (WEF, 2015), in this way the water risk management by enterprises dependent on this source has been considered by the industrial sector as a challenge (CEBDS, 2015).
Extreme climatic events (e.g. loods and water scarcity) and the level of maturity of the institutions involved make water risk management still a complex, adaptive and costly process. In this sense, environmental risk management tools, including those for water risk management, have become increasingly essential instruments for the characterization and reduction of potential risks associated with industrial operations.
It is important to emphasize that, although there are referenced instruments for water risk assessment (WBCSD Global Water Tool – GWT, WRI Aqueduct Toll, WWF/DEG Water Risk Filter - WWF), the tools available only provide for initial assessments that needed to be deepened for the preparation of short, medium and long term action plans. In order to be able to identify the risks it is necessary to know the local conditions, but the database available in these tools does not allow this evaluation, either by the dearth of data or by the lack of data in the scale required for this analysis (CEBDS, 2015).
Mueller et al. (2015), in the search for tools capable of mapping the water risk of ventures in the automobile segment, applied the main available mechanisms (WBCSD Global Water Tool - GWT, WRI Aqueduct Toll, WWF/ DEG Water Risk Filter - WWF) in 09 (nine) enterprises distributed among India, China, Mexico, Spain, the United States and Brazil. Figure 1 shows the results obtained.
It is observed that the results obtained between the tools presented great variability when compared to each other, demonstrating that the regional speciicities that are not considered in global tools generate interference in the inal evaluation. Within this context, when there is a need for detailing factors in a speciic segment, such as the miner-metallurgical, the tools available are even more supericial, since they do not allow the insertion of peculiarities of these operations.
According to Bichueti et al. (2014), the management of water use is one of the greatest challenges for the safe and economic development of the mining-metallurgical segment, being considered a duality that varies from resource extremely necessary in diverse activities and processes, to the origin of many concerns.
Mining is probably one of the main water users in Brazil, which has the greatest technical peculiarities, ranging from complex projects, requiring areas for the storage of tailings and / or demand for mine dewatering, to projects with small degree of primary
processing, such as concentration, separation or washing of ore (ANA, 2006). In addition to it, its location, as a rule, is intrinsically linked to the availability of the mineral resource, which does not allow locational choice.
There are several potential problems associated with water in mining and metallurgy, such as the formation of acid drainage, groundwater pollution due to improper disposal of tailings, discharge of mine water into surface water and competition for water by other industries and local community (DANOUCARAS et al., 2014).
In this way, the objective of this article was to present the development of a Management Tool for Water Hazard Assessment (FARH) for application in mining and metallurgical units in Brazil, as a way of assessing the situation of water vulnerability of these enterprises, reducing subjectivity through a tool that translates technical language into a management tool.
General aspects related to risk management
The analysis of risks and process hazards comprise the environmental risk management of an organization and is considered as a key item to ensure the success of the security projects and operation of a system in plants of process and other facilities (DUNJÓ et al., 2010).
danger, that is, the possibility of materialization of an undesired event occurs. So risk, as deined by the Society for Risk Analysis, is the potential for unwanted outcomes in human life, in the environment, or in material possessions. Risk can be deined more formally as a product of the probability of occurrence of a given event, by the magnitude (severity) of its consequences.
According to Tixier et al. (2002) the methodologies used for the risk assessment can be classiied in qualitative, semi-quantitative and quantitative methodologies. The degree of detail required will particularly depend on the application of the availability of reliable data, and of the decision-making needs of the organization. Some methods and the degree of detail of the analysis may be prescribed by legislation (ABNT, 2012).
The qualitative assessment deines the consequence, probability and level of risk by levels of signiicance such as high, medium and low, being able to combine severity x probability and evaluate the resulting level or scale of risk in comparison with the qualitative criteria.
Semi-quantitative methods use numerical scales for consequence and probability and combine them to produce a level of risk using an equation. The scales may be linear or logarithmic, or they may have some other relation.
The quantitative analysis estimates practical values for consequences and their probabilities, and produces values of the level or scale of risk in speciic units deined when the context was developed.
In a review of 62 methods of process risk analysis including some with nature and/ or environmental criteria used in industrial plants Tixier et al. (2002) have identiied that qualitative methods are the most used for risk assessments involving several general aspects. Quantitative methods are developed for situations where there is a need to evaluate some speciic aspect.
Tixier et al. (2002) also summarized the limitations of the main methods of risk analysis used in industrial units:
• The more general the methodology is, the less applicable for speciic cases the methodology is, and the more speciic, the less applicable for transposition in other situations; • The technical knowledge of the people participating in the
risk analysis is extremely important because the classiication of risk severity is carried out subjectively and thus, all analysis is susceptible to human factors;
• The complexity of methods that are not automated requires additional efforts and speciic training for their implementation.
According to Purdy (2010), until the publication of ISO 31.000: 2009 (ABNT, 2009), people who worked with risk management had different elements, processes and even deinitions about the most appropriate strategy for risk assessment of their organizations.
Thus, although AS/NZS 4.360: 1999 (STANDARDS AUSTRALIA; STANDARDS NEW ZEALAND, 2004) had been the irst risk management standard elaborated in the world, the ISO 31.000:2009 (ABNT, 2009), which was based on the review in 2004 of AS/NZS 4360 (STANDARDS AUSTRALIA; STANDARDS
NEW ZEALAND, 2004), is currently the international reference standard for risk management, including environmental risks.
The publication of ABNT NBR ISO 31.000 (ABNT, 2009) was fundamental for the implementation of the following aspects in the scope of risk management: i) Standardization of a targeted vocabulary; ii) Establishment of performance criteria; iii) Deinition of a common global process for the identiication, analysis, evaluation and treatment of risks; iv) Presentation of a guide to the decision-making process in any organization (PURDY, 2010).
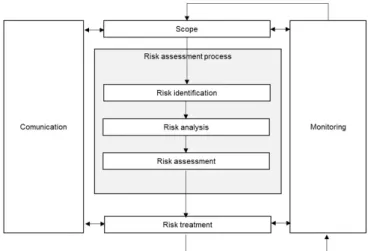
In a complementary way, ISO 3.010 (ABNT, 2012) presents the guidelines for choosing the techniques for the available risk assessment process. According to the standard, the process includes the identiication, analysis and evaluation of risks, as indicated in Figure 2.
The way this process is performed depends not only on the context of the risk management process, but also on the methods and techniques used to conduct the process. According to the standard, the process includes identifying the causes and sources of risk, events, situations or circumstances that could have a material impact on the objectives and nature of this impact. Risk identiication methods may include:
• Evidence-based methods, examples such as checklists and critical analysis of historical data;
• Systematic approaches where a team of experts follows a process to identify risks through a structured set of instructions or questions;
• Techniques of inductive reasoning such as FMEA (GARGAMA; CHATURVEDI, 2011) and support techniques to improve accuracy in risk identiication, with emphasis on brainstorming (ABNT, 2012), Delphi method and checklist (ABNT 2012).
Failure Modes and Effects Analysis (FMEA) was initially developed as a formal methodology in 1960 by the aerospace industry with the goal of assessing safety and reliability risks. Since then, the
Figure 2. Contribution of risk assessment to the risk management process.
method has been used by a wide range of industries, including automotive, nuclear, biomedical, among others (GARGAMA; CHATURVEDI, 2011).
Within environmental risk assessment in Brazil, the FMEA analysis has been used to identify the risks that need to be prioritized in order to comply with environmental legislation, corporate requirements and obtain environmental certiications, such as the ABNT NBR ISO 14.001 (NOGUEIRA et al., 2011; ZAMBRANO; MARTINS, 2007).
Brainstorming is used to stimulate and encourage the free low of conversation between a group of people who are knowledgeable about the topic or the process to identify the associated hazards and risks and the criteria for decisions. It can be used in conjunction with other methods for the risk assessment process, and it may be carried out in a formal or informal manner (ABNT, 2012).
The Delphi method is a procedure used to obtain a reliable consensus of opinions from a group of experts. It can be applied at any stage of the risk management process whenever a consensus of expert views is needed. The work procedure is performed by sending a semi-structured questionnaire to a group of specialists with rounds of feedback until there is a consensus on the evaluations (ABNT, 2012).
The checklist consists of the list of hazards, risks or control failures that were normally developed from the experiment as a result of a previous risk assessment process. The work is performed through the application of the checklist and evaluation of the critical analysis of the items that compose it (ABNT, 2012).
It should be noted that, regardless of the method chosen, the risk assessment process of an enterprise must be capable of evaluating the process in a macro form, and of developing tools to evaluate speciic items that are identiied as strategic for the company’s planning, as water risk assessment.
General aspects related to risk management in the mining-metallurgical segment
During the last decades, the mining industry has acknowledged the importance of water for itself and for others (WOODLEY et al., 2013). While water scarcity is a global certainty, predicting the scale, nature and location of associated risks is still a challenge (ORR et al., 2009).
In this context, the risks associated with water scarcity can be classiied into three categories: (i) the risk of insuficient resources to meet the basic needs of people and industries; (ii) risks associated with the implementation of charging for use, energy price rise, loss of competitiveness, political and economic instability and population migration; and (iii) risks of inadequate management based on lack of knowledge in short- and long-term.
Water risk can still be divided into four categories: (i) physical risks, (ii) inancial risks, (iii) regulatory risks, and (iv) risks related to the company’s image, and, therefore, organizations now consider water management as a key business issue and not simply as a matter of compliance or corporate social responsibility (ORR et al., 2011).
In this sense, water risk assessment tools have been developed with the purpose of identifying the vulnerabilities
associated to the water resource in the places of installation and operation of industrial units.
Water accounting
Among the aspects related to water risk management, water accounting is considered an essential factor for the evaluation of water availability versus water demand of the enterprises (FONSECA et al., 2013; DANOUCARAS et al., 2014).
In this sense the use of a water accounting tool, such as the Water Accounting Framework - WAF, developed by the Australian Mining Council (MCA) in 2012 (COTE; MORAN, 2009; WOODLEY et al., 2013; DANOUCARAS et al., 2013; SMI; MCA, 2014) and its adaptations (BISSACOT, 2016), is presented as an adequate methodology for the elaboration of the water balance.
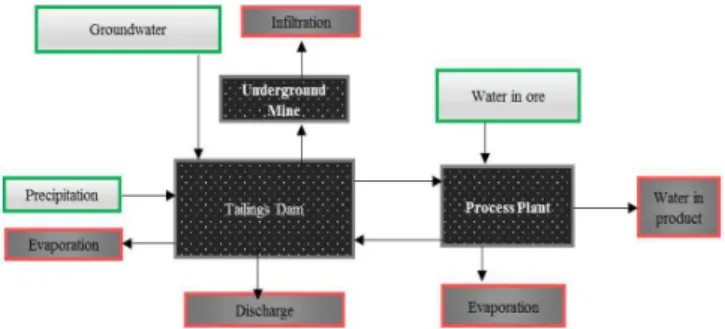
Figure 3 shows an example of how the operational low is represented in the methodology. Within the presented lowchart, the percentage of reuse would be obtained by the sum of all the low streams of processes to process divided by the sum of all the lows that enter processes.
METHODOLOGY
The structural formatting of the FARH was carried out based on the deinitions of ABNT NBR ISO 31.000 (ABNT, 2009), which establishes the criteria for risk assessment.
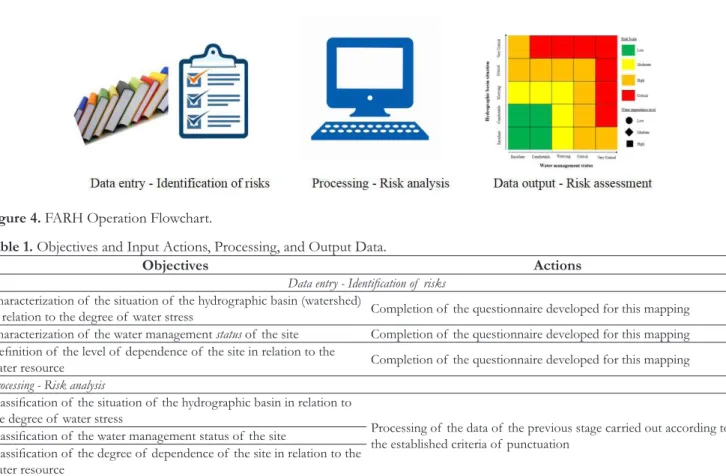
Based on the technical criteria listed by ABNT NBR ISO 31.010 (ABNT, 2012), the tool was structured in: i) Criteria for risk identiication (Data entry); ii) Criteria for risk analysis (Processing); and iii) Criteria for risk assessment (Data output). Figure 4 shows the operation lowchart and Table 1 shows the objectives and actions of each step.
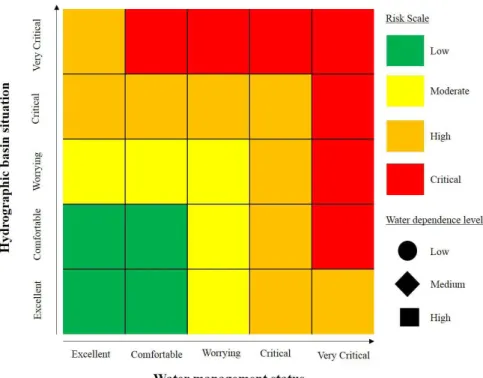
The basis for the development of FARH was based on the precepts of semi-quantitative methodology (ABNT, 2012), whose inal objective was to consolidate results into a risk matrix (dashboard) based on three (3) axes, to know:
• Y axis, which represents the situation of the river basin in relation to the degree of water stress and whose technical
Figure 3. Example of operational low chart.
Caption: Intakes (green) – Underground mine - groundwater drawdown, Precipitation, Water in ore. Exits (red) - Iniltration,
criteria are described in the next subitems. This axis, in a correlation with a corporate risk matrix elaborated in general scope, would correspond to the evaluation of the severity of the scenario/event.
• X axis, which represents the water management status of the enterprise and whose technical criteria are described in the next subitems. This axis, in a correlation with a corporate risk matrix elaborated in general scope, would correspond to the evaluation of the probability of the scenario/event.
• Z axis, which represents the degree of dependence of the enterprise on the water resource and whose technical criteria are described in the next subitems. This axis would not correlate with a conventional corporate risk matrix, considering that, as a rule, these matrices are based on only two (2) axes, severity versus probability.
Elaboration of the questionnaires and associated calculation basis
The three (3) axes of the FARH were developed through questionnaires with a calculation base associated with a scoring scale, according to the methodology described in the following topics:
• The elaboration of questionnaires was carried out based on pre-determined questions, with closed ended responses for multiple choice questions developed for each axis. The elaboration consisted of some steps, as recommended by Aaker et al. (2011): (i) planning of what one wanted
to measure; (ii) formulating the questions to obtain the necessary information; (iii) deinition of the text and the order of the questions, besides the visual aspect of the questionnaire and; (iv) test the questionnaire, using a small sample, to verify omissions and ambiguities. For such deinitions and consensus of the adopted criteria an informal brainstorming (ABNT, 2012) was applied with the support of a multidisciplinary team composed of experts from the mining-metallurgical segment (environmental, technological and legal area) and members of the academy. The researcher’s own experience was of great relevance for the execution of all stages.
• The calculation base associated with each axis was formulated based on a scale of criteria and scores developed in the research with the support of the multidisciplinary team previously listed and based on the correlation with the severity versus probability criteria applied in the risk assessment method as the Failure Mode and Effects Analysis - FMEA (GARGAMA; CHATURVEDI, 2011). The scale was established taking into account the segregation of the Y and Z axes in 5 (ive) bands, with a score varying from 1 to 5, where 1 (one) corresponds to the lowest severity and probability score and 5 (ive) to the highest score.
• The establishment of weights was done through direct rating, where major or minor weights were assigned according to the importance of each criterion (GOMES; GOMES, 2012), whose evaluation was performed by the Table 1. Objectives and Input Actions, Processing, and Output Data.
Objectives Actions
Data entry - Identiication of risks Characterization of the situation of the hydrographic basin (watershed)
in relation to the degree of water stress Completion of the questionnaire developed for this mapping Characterization of the water management status of the site Completion of the questionnaire developed for this mapping
Deinition of the level of dependence of the site in relation to the
water resource Completion of the questionnaire developed for this mapping
Processing - Risk analysis
Classiication of the situation of the hydrographic basin in relation to
the degree of water stress
Processing of the data of the previous stage carried out according to the established criteria of punctuation
Classiication of the water management status of the site
Classiication of the degree of dependence of the site in relation to the
water resource
Data output - Risk assessment
Deinition of the Risk Scale Dashboard (Risk Matrix)
multidisciplinary team involved in the informal brainstorming step. The scale of weights was divided into 3 points, being: i) Weight 1, adopted for the criteria of minor importance; ii) Weight 2, for the criteria of moderate importance; and iii) Weight 3, for the most important criteria.
• After the development of the questionnaires and of the rational equation calculation, the material was applied and tested by the multidisciplinary team in different rounds following the checklist methodological standard (ABNT, 2012) to assess adherence and need for revision.
With the consolidation of the questionnaires and the associated calculation basis, after the consensus of the discussions among the specialists, the criteria and technical concepts adopted for the composition of the Y, X and Z Axes were deined according to what is presented in the following items.
Hydrographic basin situation in relation to the degree of water stress - Y axis
The deinition of the criteria that integrated the assessment of FARH’s Y-Axis (river basin situation) was carried out based on the Water Exploitation Index (WEI) evaluation used by the European Environmental Agency, the United Nations and the National Agency of Water (ANA - acronym in Portuguese for Agência Nacional de Águas) in Brazil (ANA, 2011).
The WEI is obtained by calculating the quotient between the annual total withdrawal and the average long-term low (average of the annual lows for the entire data series), establishing the relationship between demand and availability in percentage terms (%). This index can be obtained for the river basin and for the microbasin, based on the following classiication:
• Excellent (<5%), correlation with the “Very Low” severity scale;
• Comfortable (5 to 10%), correlation with the “Low” severity scale;
• Worrying (10 to 20%), correlation with the “Moderate” severity scale;
• Critical (20 to 40%), correlation with “Critical” severity scale; • Very Critical (> 40%), correlation with the “Very Critical”
severity scale.
For this research, the watershed was deined as a natural catchment area of the precipitation water that converges the low to a single exit point. It consists of a set of sloping surfaces and a drainage network formed by water courses that converge to result in a single bed in the exudation. The microbasin corresponds to the area with direct drainage to the main course.
Table 2 presents the questionnaire developed within this research for the Y Axis and the associated score scale, which was developed based on the criteria used by ANA (2011).
The inal scoring algorithm in the Y-Axis was obtained by the sum of the scores obtained in questions 1 to 4 considering the associated weights, weighted by the sum of the maximum possible
scores in each question multiplied by the weights (maximum score = 35 points) converted to the maximum scale of 5 points, ie: Note Axis Y = [(Σ Maximum notes 1-4 * weights) * 5] / 35.
Water management status - X axis
The deinition of the technical criteria that integrated FARH’s X-Axis evaluation (status of the water management of the enterprise) was based on the principles of corporate governance of this resource, taking into account the guidelines set forth by the Water Risk Filter (WWF, 2014), namely: (i) physical risks; (ii) regulatory risks; and (iii) reputational risks.
The X-axis score was established based on the following classiication:
Table 2. Questionnaire to characterize the situation of the river basin in relation to the degree of water stress (Y axis).
Questions Answering
options Score Weight
1 - What is the
classiication of the
Water Exploitation Index of the hydrographic basin where the enterprise is located - current condition?
⎕ Excellent
⎕ Comfortable
⎕ Worrying
⎕ Critical
⎕ Very critical
⎕ Unknown
⎕ One
⎕ Two
⎕ Three
⎕ Four
⎕ Five
⎕ Three
2
2 - What is the
classiication
of the Water Exploitation Index of the hydrographic basin where the project is located - future condition (simulation for the next 5 years)?
⎕ Excellent
⎕ Comfortable
⎕ Worrying
⎕ Critical
⎕ Very critical
⎕ Unknown
⎕ One
⎕ Two
⎕ Three
⎕ Four
⎕ Five
⎕ Three 1
3 - What is the
classiication of the
Water Exploitation Index of the microbasin where the enterprise is located - current condition?
⎕ Excellent
⎕ Comfortable
⎕ Worrying
⎕ Critical
⎕ Very critical
⎕ Unknown
⎕ One
⎕ Two
⎕ Three
⎕ Four
⎕ Five
⎕ Three
3
4 - What is the
classiication of the
Water Exploitation Index of the watershed where the enterprise is located - future condition (simulation for the next 5 years)?
⎕ Excellent
⎕ Comfortable
⎕ Worrying
⎕ Critical
⎕ Very critical
⎕ Unknown
⎕ One
⎕ Two
⎕ Three
⎕ Four
⎕ Five
⎕ Three
1
Maximum rating 35
• Excellent, correlation with the “Very Low” probability scale; • Comfortable, correlation with the “Low” probability scale; • Worrying, correlation with “Moderate” probability scale; • Critical, correlation with the “High” probability scale; • Very Critical, correlation with the “Very High” probability scale.
It should be noted that data related to water accounting (water balance) of these enterprises were obtained according to the Water Accounting Framework - Adapted (BISSACOT, 2016).
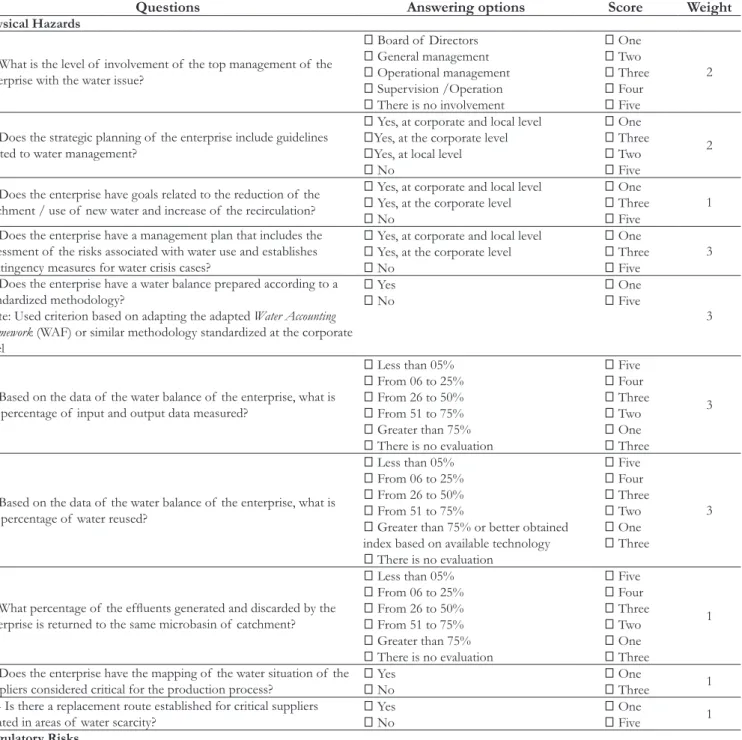
Table 3 presents the questionnaire developed within this research for the X-Axis and associated scale of points.
The inal scoring algorithm in the X Axis was obtained by summing the scores obtained in questions 1 to 19 considering the associated weights, weighted by the sum of the maximum possible scores in each question multiplied by the associated weights (maximum score = 193 points) converted to maximum scale of 5 points, i.e.: Score Axis X = [(Σ Maximum scores 1-19 * weights) * 5] / 193.
Dependence of the enterprise in relation to the water resource - Z Axis
The deinition of the technical criteria that integrated the Z Axis evaluation (dependence of the enterprise on water resource) of the FARH was based on the association of the level of
Table 3. Questionnaire to characterize the water management status of the project (X-Axis).
Questions Answering options Score Weight
Physical Hazards
1 - What is the level of involvement of the top management of the enterprise with the water issue?
⎕ Board of Directors ⎕ General management
⎕ Operational management
⎕ Supervision /Operation
⎕ There is no involvement
⎕ One
⎕ Two
⎕ Three
⎕ Four
⎕ Five
2
2 - Does the strategic planning of the enterprise include guidelines
related to water management?
⎕ Yes, at corporate and local level
⎕Yes, at the corporate level
⎕Yes, at local level
⎕ No
⎕ One
⎕ Three
⎕ Two
⎕ Five
2
3 - Does the enterprise have goals related to the reduction of the
catchment / use of new water and increase of the recirculation?
⎕ Yes, at corporate and local level
⎕ Yes, at the corporate level
⎕ No
⎕ One
⎕ Three
⎕ Five
1
4 - Does the enterprise have a management plan that includes the
assessment of the risks associated with water use and establishes contingency measures for water crisis cases?
⎕ Yes, at corporate and local level
⎕ Yes, at the corporate level
⎕ No
⎕ One
⎕ Three
⎕ Five
3
5 - Does the enterprise have a water balance prepared according to a
standardized methodology?
Note: Used criterion based on adapting the adapted Water Accounting Framework (WAF) or similar methodology standardized at the corporate level
⎕ Yes
⎕ No
⎕ One
⎕ Five
3
6 - Based on the data of the water balance of the enterprise, what is the percentage of input and output data measured?
⎕ Less than 05%
⎕ From 06 to 25%
⎕ From 26 to 50%
⎕ From 51 to 75%
⎕ Greater than 75%
⎕ There is no evaluation
⎕ Five
⎕ Four
⎕ Three
⎕ Two
⎕ One
⎕ Three
3
7 - Based on the data of the water balance of the enterprise, what is the percentage of water reused?
⎕ Less than 05%
⎕ From 06 to 25%
⎕ From 26 to 50%
⎕ From 51 to 75%
⎕ Greater than 75% or better obtained index based on available technology
⎕ There is no evaluation
⎕ Five
⎕ Four
⎕ Three
⎕ Two
⎕ One
⎕ Three
3
8 - What percentage of the efluents generated and discarded by the
enterprise is returned to the same microbasin of catchment?
⎕ Less than 05%
⎕ From 06 to 25%
⎕ From 26 to 50%
⎕ From 51 to 75%
⎕ Greater than 75%
⎕ There is no evaluation
⎕ Five
⎕ Four
⎕ Three
⎕ Two
⎕ One
⎕ Three
1
9 - Does the enterprise have the mapping of the water situation of the
suppliers considered critical for the production process?
⎕ Yes
⎕ No
⎕ One
⎕ Three 1 10 - Is there a replacement route established for critical suppliers
located in areas of water scarcity?
⎕ Yes
⎕ No
⎕ One
dependence of the resource and its relation to potential inancial damages resulting from a possible interruption of the supply. This axis has no correlation with other conventional risk matrices, but it is associated with the inancial impact assessment criterion proposed by Bissacot and Oliveira (2016) for the development of an environmental risk management tool.
The Z-axis score was established based on the following classiication of the level of dependence of the enterprise in relation to the water resource:
• Low, correlation with low inancial impact;
• Medium, correlation with moderate inancial impact;
• High, correlation with high inancial impact.
Table 4 presents the questionnaire developed within this research for this mapping and the associated scale of points.
The inal score algorithm in the Z Axis was obtained by the sum of the scores obtained in questions 1 to 3 considering the associated weights, weighted by the sum of the maximum possible scores in each question multiplied by the associated weights (maximum score = 18 points) converted to the maximum scale of 3 points, i.e.: Score Axis Z = [(Σ Maximum scores 1-3 * weights) * 3] / 18.
Questions Answering options Score Weight
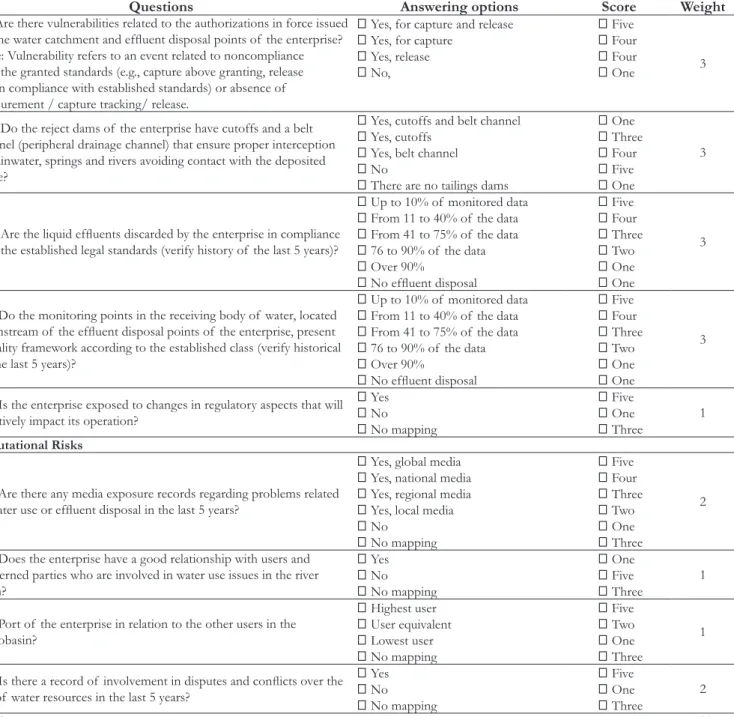
11- Are there vulnerabilities related to the authorizations in force issued
for the water catchment and efluent disposal points of the enterprise?
Note: Vulnerability refers to an event related to noncompliance with the granted standards (e.g., capture above granting, release not in compliance with established standards) or absence of measurement / capture tracking/ release.
⎕ Yes, for capture and release
⎕ Yes, for capture
⎕ Yes, release
⎕ No,
⎕ Five
⎕ Four
⎕ Four
⎕ One 3
12 – Do the reject dams of the enterprise have cutoffs and a belt
channel (peripheral drainage channel) that ensure proper interception of rainwater, springs and rivers avoiding contact with the deposited waste?
⎕ Yes, cutoffs and belt channel
⎕ Yes, cutoffs
⎕ Yes, belt channel
⎕ No
⎕ There are no tailings dams
⎕ One
⎕ Three
⎕ Four
⎕ Five
⎕ One
3
13 – Are the liquid efluents discarded by the enterprise in compliance
with the established legal standards (verify history of the last 5 years)?
⎕ Up to 10% of monitored data
⎕ From 11 to 40% of the data
⎕ From 41 to 75% of the data
⎕ 76 to 90% of the data ⎕ Over 90%
⎕ No efluent disposal
⎕ Five
⎕ Four
⎕ Three
⎕ Two
⎕ One
⎕ One
3
14 - Do the monitoring points in the receiving body of water, located downstream of the efluent disposal points of the enterprise, present
a quality framework according to the established class (verify historical of the last 5 years)?
⎕ Up to 10% of monitored data
⎕ From 11 to 40% of the data
⎕ From 41 to 75% of the data
⎕ 76 to 90% of the data ⎕ Over 90%
⎕ No efluent disposal
⎕ Five
⎕ Four
⎕ Three
⎕ Two
⎕ One
⎕ One
3
15 - Is the enterprise exposed to changes in regulatory aspects that will negatively impact its operation?
⎕ Yes
⎕ No
⎕ No mapping
⎕ Five
⎕ One
⎕ Three
1
Reputational Risks
16 - Are there any media exposure records regarding problems related
to water use or efluent disposal in the last 5 years?
⎕ Yes, global media
⎕ Yes, national media
⎕ Yes, regional media
⎕ Yes, local media
⎕ No
⎕ No mapping
⎕ Five
⎕ Four
⎕ Three
⎕ Two
⎕ One
⎕ Three
2
17 - Does the enterprise have a good relationship with users and
concerned parties who are involved in water use issues in the river basin?
⎕ Yes
⎕ No
⎕ No mapping
⎕ One
⎕ Five
⎕ Three
1
18 - Port of the enterprise in relation to the other users in the microbasin?
⎕ Highest user
⎕ User equivalent
⎕ Lowest user
⎕ No mapping
⎕ Five
⎕ Two
⎕ One
⎕ Three
1
19 - Is there a record of involvement in disputes and conlicts over the
use of water resources in the last 5 years?
⎕ Yes
⎕ No
⎕ No mapping
⎕ Five
⎕ One
⎕ Three
2
Maximum score 193
Classiication of water risk
The criteria listed in the previous items comprised the technical basis for the classiication of the water risk scale, developed within the scope of this research, according to the criteria described in Figure 5 and Figure 6, and consolidated in Figure 7.
The scores obtained in Axis Z correspond to the following levels of dependence of the resource: 1.00-1.99 (low); 2.00-2.99 (average) and> = 3 (high).
Validation and structuring of the FARH on a computerized basis from a pilot phase
After the development of the technical and structural basis of the FARH, a pilot stage was carried out to validate the established criteria. The pilot stage was carried out in 09 (nine) mining-metallurgical enterprises located in the states of Minas Gerais, Goiás and São Paulo, which mines and processes zinc, nickel and aluminum. Each enterprise responded individually to the questionnaires elaborated and the results obtained were Table 4. Questionnaire to characterize the level of dependence
of the enterprise in relation to the water resource (Z axis).
Questions Answering
options Score Weight
1 - What percentage of the total water required for the operation of the enterprise comes from the abstraction of surface or underground water?
⎕ Less than 25%
⎕ From 50 to 75%
⎕ Greater than 75%
⎕ One
⎕ Two
⎕ Three 3
2 - What is the percentage of the
low granted that has
been captured by the enterprise?
⎕ Less than 25%
⎕ From 50 to 75%
⎕ Greater than 75%
⎕ One
⎕ Two
⎕ Three 1
3 - In a situation of water scarcity (surface or underground water), does the enterprise have alternative sources for its supply?
⎕ Yes, for 100% of the operation
⎕ Only for critical activities
⎕ No
⎕ One
⎕ Two
⎕ Three 2
Maximum score 18
Figure 5. Risk Scale - River Basin Status vs. Water Management Status.
Caption: Exc. = Excellent; Conf. = Comfortable; Worry. = Worrying; Critic. = Critical.
plotted in a dashboard according to the associated scale. Table 5 presents the description of the projects where FARH was applied.
With the validation of the FARH criteria, the data platforms were inserted in “macro excel” to computerize their application.
RESULTS AND DISCUSSIONS
Results of the pilot phase
The water balance of the enterprises was elaborated according to a methodology adapted by Bissacot (2016). Figure 8 exempliies the application of the methodology in site # 2 and Table 6 presents the summary of the results obtained for all the enterprises evaluated.
To obtain those that make up Table 6, the criteria deined by SMI and MCA (2014) and the adaptations proposed by Bissacot (2016) were adopted, so that:
( )
new water withdrawn Inputs green boxes
87,886 3, 611 42 22 91, 561 ML
Σ = Σ =
+ + + = (1)
( )
Exits red boxes 1,895 434 89, 493
18 44 22 91, 906 ML
Σ = + + +
+ + = (2)
Closing of the balance Inputs Outputs 345 ML Storage in the Reject Dam
= − =
= (3)
Water volume used of all gray box entries 434 10, 539 42 22 11, 03
(
7M ) L
Σ Σ =
+ + + = (4)
( )
% of process water in the tailings dam
10, 519 / 87,886 10, 519 3, 611 10.3% =
+ + = (5)
( )
Vol. of reused water of all process to process lines, multiplied by the% process water in the tailings dam 434 10, 539 * 10
(
) , 3% 1,131 ML
Σ Σ − −
= + = (6)
Vol. of water used Vol. of new water used
Vol. of water reused
11, 037 – 1,131 9, 906 ML
Σ −
Σ =
Σ
=
(7)
% Reuse Vol. of reused water /
Total water volume used 1,131 / 11, 037 10.2% = Σ
Σ = = (8)
Figure 9 shows the inal product dashboard of the pilot phase performed in the 9 (nine) enterprises to validate the technical criteria that make up the FARH. The questionnaires answered Table 5. Description of the enterprises where FARH was applied.
N° Production Production process State
1 22.9 Underground mine Minas Gerais 2 134.0 Underground mine Minas Gerais
3 957.8 Open pit mine Minas Gerais
4 630.5 Open pit mine Minas Gerais
5 18.5 Open pit Goiás
6 363.8 Metallurgy São Paulo
7 183.9 Hydrometallurgy Minas Gerais
8 86.8 Hydrometallurgy Minas Gerais
9 22.7 Metallurgy São Paulo Note: Production data for the year 2015. Units of measurement - Production of underground mine = Kt contained metal; Production of open pit mine = Kt of room beneited; metallurgy production and hydrometallurgy = Kt of contained metal.
were kept conidential, to ensure the conidentiality of process data of these enterprises.
The situation of the basin in relation to the degree of water stress (Y Axis) was classiied as of critical concern in the evaluated projects, while the status of water management (X Axis) ranged from excellent to worrying according to the criteria listed, which culminated in the allocation of 08 (eight) enterprises in the moderate risk scale and 01 (one) in the high risk scale.
In relation to the level of dependence of the water resource (Z Axis), 03 (three) enterprises were identiied with low dependence on the water resource, 05 (ive) with medium dependency, and 01 (one) with a high level of dependence, where the scenario of water scarcity would signiicantly impact the unit’s operations, culminating in the inancial impact associated with a potential suspension of supply.
The questionnaires developed followed the stages deined by Schuman and Kalton (1985) and reinforced by Gunther (2003), the applied criteria presented technical adherence and were considered by the involved enterprises as corresponding to the operational reality, which demonstrated that the mapping provided by FARH was Suficient for the composition of a water risk assessment tool to be applied by the country’s metallurgical segment.
In addition, the correlation established with the severity and probability scales established by the FMEA (ZAMBRANO; MARTINS, 2007) demonstrated that the FARH results could be correlated to the mapping of the other environmental risks of these enterprises.
Guide to prepare the water management plan
With the results of the application of the pilot phase, the present research deined a guide for the elaboration of the water management plan of the mining-metallurgical enterprises. This guide was established based on the risk scale provided by FARH, taking into account aspects raised in the literature (ABIQUIM, 2016; ANA, 2016) and the multidisciplinary team involved in the discussion of the questionnaires and rational calculation of the tool. Tables 7 to 10 present prevention, follow-up, control, mitigation and contingency actions within the scope of this guide.
It should be emphasized that the proposed plan relects the designation of strategic actions that should be understood as general guidelines for detailing the individual actions that each venture of the segment should adopt.
Figure 8. Water balance of the site # 2.
Table 6. Summary of the results of the water balance.
Nº ∑ New water
withdrawal (ML)
∑ Total water used
(ML)
∑ New water used
(ML)
∑ Total water
reused (ML) % Reuse
1 2,296 2,885 769 2,116 73
2 91,561 11,037 9,906 1,131 10
3 2,267 2,478 1,314 1,164 47
4 28 28 28 0 0
5 7,124 9,456 5,502 3,954 42
6 5,560 27,592 4,896 22,696 82
7 5,309 4,881 3,699 1,182 24
8 3,878 2,969 2,706 263 9
Figure 9. Dashboard generated with FARH application in pilot phase.
Table 7. Prevention and follow-up actions for water management in enterprises classiied in the low water risk scale.
Actions Guide
Maintain the water balance of the enterprise updated (water
accounting). WAF Annual Mandatory Update - Adapted. Elaborate and implement the master plan of water measurement,
ensuring the installation of meters along the operational low of water
demand of the enterprise.
Based on the water balance, map the main lows of capture,
distribution, consumption, recirculation and disposal and establish the measurement plan.
Maintain hydrological and hydrogeological study of updated sources of supply.
Hire specialized consultancy to update the hydrological study of the sources of water capture of the Unit. Map alternative sources of supply
Establish a relationship agenda with the committees, agencies and technical groups related to the management of water resources.
Indicate a technical representative and a political representative to accompany these discussion forums.
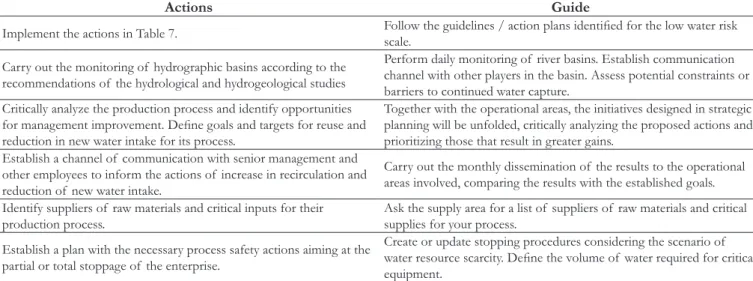
Table 8. Control actions for water management in enterprises classiied in the moderate water risk scale.
Actions Guide
Implement the actions in Table 7. Follow the guidelines / action plans identiied for the low water risk scale.
Carry out the monitoring of hydrographic basins according to the recommendations of the hydrological and hydrogeological studies
Perform daily monitoring of river basins. Establish communication channel with other players in the basin. Assess potential constraints or barriers to continued water capture.
Critically analyze the production process and identify opportunities
for management improvement. Deine goals and targets for reuse and
reduction in new water intake for its process.
Together with the operational areas, the initiatives designed in strategic planning will be unfolded, critically analyzing the proposed actions and prioritizing those that result in greater gains.
Establish a channel of communication with senior management and other employees to inform the actions of increase in recirculation and reduction of new water intake.
Carry out the monthly dissemination of the results to the operational areas involved, comparing the results with the established goals.
Identify suppliers of raw materials and critical inputs for their production process.
Ask the supply area for a list of suppliers of raw materials and critical supplies for your process.
Establish a plan with the necessary process safety actions aiming at the partial or total stoppage of the enterprise.
Create or update stopping procedures considering the scenario of
water resource scarcity. Deine the volume of water required for critical
Table 9. Mitigation and correction actions for water management in projects classiied in the high water risk scale.
Actions Guide
Implement the actions in Table 7 and Table 8. Follow the guidelines / action plans identiied for the low and moderate water risk scale.
Implement the necessary mechanisms to access alternative sources of supply mapped in hydrological and hydrogeological studies.
Implement alternative sources of identiied water resources in order to
maintain the productive process.
Insert the agenda of water shortages in the processes of qualiication
and contractual renewal of suppliers. Assess the need for alternatives to supply raw materials and inputs. Evaluate critical functions/activities that should be maintained in the
production unit if there is water rationing.
Each production unit should evaluate the minimum quota to maintain its operation in view of a possible rationing.
Complement the action plan with actions that ensure the continuity of the business.
Involve the planning, supply and commercial area, evaluating the possibility of inventory increase.
Table 10. Contingency actions for water management in enterprises classiied in the critical water risk scale.
Actions Guide
Implement the actions in Table 7, Table 8 and Table 9. Follow the guidelines/action plans identiied for the low, moderate and high water risk scale.
Establish the Crisis Management Committee.
The committee must be formed by professionals who work in areas such as: Human Resources, Communication, Production, Supplies, Commercial, Legal, Health, Safety and Environment, etc. with the objectives of mitigating the risks to health, safety and the environment and to maintain business continuity
Start the process of internal and external communication. Deine the communication strategy by considering key concerned parties in a transparent and clear way.
Communicate key customers and suppliers, employees and unions about the risk of disruption in the production process.
Prepare communication with support of the legal area (e.g., check contractual issues with clients, temporary suspension plan for employees, etc.).
If necessary, establish the emergency action plan to interrupt the production process in a safe manner, following the safety procedures
deined in the previous steps.
Stop the production process safely. Maintain applicable health, safety and environmental controls.
Figure 11. Characterization screen of the enterprise.
Figure 12. Y-axis questionnaire partial screen.
Figure 14. Z-Axis questionnaire partial screen.
Figure 15. Dashboard screen.
Computerization of FARH
Based on the results obtained in the pilot phase, after deining the criteria for the guide for the elaboration of the water management plan, FARH was inserted in excel database and the digital tool will be made available online.
Figure 10, Figure 11, Figure 12, Figure 13, Figure 14 and Figure 15 show the main views of the screens of the tool, which was developed in Portuguese.
CONCLUSION AND RECOMMENDATION
The criteria listed for FARH formulation were suficient and satisfactory for the development of a tool capable of identifying, analyzing and classifying the scale of hydrological risk of enterprises in the mining-metallurgical segment.
The dashboard generated allowed the consolidated visualization of the water risk of several enterprises on an
evaluation basis, providing comparisons between different operations and providing a technical basis for the prioritization of short, medium and long term actions and allocation of resources within the organization.
The tool developed was considered suficient to ill the existing gap of instruments that culminated in initial evaluations, providing technical elements for an integrated and speciic water risk assessment for the mining-metallurgical segment.
The guide developed for the water management plan can be incorporated as a tool allied to the strategic planning of these enterprises, serving as a subsidy for the implementation of preventive, control, mitigation and water contingency actions.
REFERENCES
AAKER, D.; KUMAR, V.; LEONE, R.; DAY, G. S. Marketing research. 11th ed. New York: John Wiley & Sons, Inc., 2011. 768 p.
ABIQUIM - ASSOCIAÇÃO BRASILEIRA DA INDÚSTRIA QUÍMICA. Guia para elaboração do plano de contingência hídrica. São Paulo, 2016. Available from: <http://www.abiquim.org.br/pdf/ guia_para_plano_de_contingencia_crise_hidrica.pdf>. Access on: 25 may 2016.
ABNT - ASSOCIAÇÃO BRASILEIRA DE NORMAS TÉCNICAS. ABNT NBR ISO 31000: 2009 - Gestão de riscos: Princípios e diretrizes. Rio de Janeiro, 2009. 32 p.
ABNT - ASSOCIAÇÃO BRASILEIRA DE NORMAS TÉCNICAS. ABNT NBR ISO 31010: 2012 - Gestão de riscos: Técnicas para o processo de avaliação de riscos. Rio de Janeiro, 2012. 96 p.
ANA - AGÊNCIA NACIONAL DE ÁGUAS. A gestão dos recursos hídricos e a mineração. Brasília, 2006. 334 p.
ANA - AGÊNCIA NACIONAL DE ÁGUAS. Planejamento estratégico da ANA: cartilha de orientações gerais. Brasília: CGE, 2011. 35 p.
ANA - AGÊNCIA NACIONAL DE ÁGUAS. Disponibilidade e demandas de recursos hídricos no Brasil. Brasília, 2016. Available from: <http://arquivos.ana.gov.br/planejamento/estudos/sprtew/2/2-ANA.swf>. Access on: 25 may 2016.
BICHUETI, R. S.; MADRUGA, L. R. R.; GOMES, C. M.; ROSA, L. A. B. O uso da água na mineração: uma análise da produção científica internacional. Revista de Gestão Ambiental e Sustentabilidade, v. 3, n. 2, p. 16, 2014.
BISSACOT, T. C. C. Desenvolvimento de ferramenta de gestão para avaliação de risco hídrico: aplicação no segmento mínero-metalúrgico no Brasil. 2016. 74 f. (Tese de doutorado)- Universidade Federal de Minas Gerais, Belo Horizonte, 2016.
BISSACOT, T. C. C.; OLIVEIRA, S. M. A. C. Instrumento para o gerenciamento de riscos ambientais. Engenharia Sanitaria e Ambiental, v. 21, n. 2, p. 227-232, 2016. http://dx.doi.org/10.1590/ s1413-41522016140442.
CEBDS - CONSELHO EMPRESARIAL BRASILEIRO PELO DESENVOLVIMENTO SUSTENTÁVEL. Gerenciamento de riscos hídricos no Brasil e o setor empresarial: desafios e oportunidades. São Paulo: CEBDES, 2015. 56 p.
COTE, C.; MORAN, C. A. Water accounting framework for the australian minerals industry. Sustainable development indicators for the mineral industry. Gold Coast, Australia: Australasian Institute of Mining and Metallurgy, 2009. p. 339-350. (Publication Series, 5).
DANOUCARAS, A. N.; WOODLEY, A.; VINK, S. Corporate sustainability reporting for water: water footprint, global reporting initiative and the water accounting framework. In: AGIOUTANTIS,
Z.; & KARMIS, M. (Eds.). INTERNATIONAL CONFERENCE ON SUSTAINABLE DEVELOPMENT INDICATORS IN THE MINERALS INDUSTRY, 6., 2013, Milos Island, Greece. Proceedings... Milos Island, Greece: Milos Conference, 2013. p. 1-12.
DANOUCARAS, A. N; WOODLEY, A. P.; MORAN, C. J. The robustness of mine water accounting over a range of operating contexts and commodities. Journal of Cleaner Production, n. 84, p. 727-735, 2014.
DUNJÓ, J.; FTHENAKIS, V.; VÍLCHEZ, J. A.; ARNALDOS, J. Hazard and operability (HAZOP) analysis. A literature review. Journal of Hazardous Materials, v. 173, n. 1-3, p. 19-32, 2010. PMid:19733970. http://dx.doi.org/10.1016/j.jhazmat.2009.08.076.
FONSECA, A.; MCALLISTER, M. L.; FITZPATRICK, P. Measuring what? A comparative anatomy of five mining sustainability frameworks. Minerals Engineering, v. 46-47, p. 180-186, 2013. http:// dx.doi.org/10.1016/j.mineng.2013.04.008.
GARGAMA, H.; CHATURVEDI, S. K. Criticality assessment models for failure mode effects and criticality analysis using fuzzy logic. IEEE Transactions on Reliability, v. 60, n. 1, p. 102-110, 2011. http://dx.doi.org/10.1109/TR.2010.2103672.
GOMES, L. F. A. M.; GOMES, C. F. S. Tomada de decisão gerencial: enfoque multicritério. 4. ed. São Paulo: Editora Atlas, 2012. 324 p.
GUNTHER, H. Como elaborar um questionário. Brasília: Laboratório de Psicologia Ambiental, UnB, 2003. 15 p. (Série Planejamento de Pesquisa nas Ciências Sociais, n. 1).
IBGC - INSTITUTO BRASILEIRO DE GOVERNANÇA CORPORATIVA. Guia de orientação para o gerenciamento de riscos corporativos. São Paulo, 2007. 48 p.
MUELLER, S. A.; CARLILE, A.; BRAS, B.; NIEMANN, T. A.; ROKOSZ, S. M.; MCKENZIE, H. L.; KIM, H. C.; WALLINGTON, T. J. Requirements for water assessment tools: an automotive industry perspective. Water Resources and Industry, n. 9, p. 30-44, 2015.
NOGUEIRA, A. C.; PERES, A. P.; CARVALHO, E. M. Avaliação do risco ambiental utilizando FMEA em um laticínio na região de Lavras – MG. Revista Produção On Line, v. 11, n. 1, p. 194-209, 2011.
ORR, S.; CARTWRIGHT, A.; TICKNER, D. Understanding water risks: a primer on the consequences of water scarcity for government and business. Gland, Suíça: WWF International, 2009. 40 p.
ORR, S.; SÁNCHEZ-NAVARRO, R.; SCHMIDT, G.; SEIZ-PUYUELO, R.; SMITH, K.; VERBERNE, J. Assessing water risk: a practical approach for financial institutions. Berlin: WWF Germany, 2011. 60 p.
SANCHEZ, L. H. Avaliação de impacto ambiental: conceitos e métodos. 2. ed. São Paulo: Oficina de Textos, 2013. 581 p.
SCHUMAN, H.; KALTON, G. Survey methods. Handbook of Social Psychology, v. 1, n. 3, p. 635-697, 1985.
SMI - SUSTAINALE MINERALS INSTITUTE; MCA - MINERALS COUNCIL OF AUSTRALIA. Water Accounting Framework for the Minerals Industry: user guide. Australia: SMI, 2014. 58 p.
STANDARDS AUSTRALIA; STANDARDS NEW ZEALAND. AS/NZS 4360: 1999 - Risk Management Standard. Australia: Standards Australia; New Zealand: Standards New Zealand, 2004. 120 p.
TIXIER, J. A.; DUSSERRE, G. A.; SALVI, O. B.; GASTON, D. Review of 62 risk analysis methodologies of industrial plants. Journal of Loss Prevention in the Process Industries, v. 15, n. 4, p. 291-303, 2002. http://dx.doi.org/10.1016/S0950-4230(02)00008-6.
WEF - Word Economic Forum. Water crises are a top global risk. 2015. Available from: <http://www.weforum.org/agenda/2015/01/ why-world-water-crises-are-a-top-global-risk/>. Access on: 22 feb. 2016.
WOODLEY, A. P.; DANOUCARAS, A. N.; MCCOMBE, C.; KUNZ, N. C.; COLLIN, N. A robust methodological approach for mine site water accounting. Water in Mining 2013 Proceedings, p. 335-342, 2013.
WWF - WORLD WIDE FUND FOR NATURE. Water risk ilter:
user guide. Gland, Suíça: WWF, 2014. 35 p.
ZAMBRANO, T. F.; MARTINS, M. F. Utilização do método FMEA para avaliação do risco ambiental. Gestão Produção, v. 14, n. 1, p. 295-309, 2007.
Authors contributions
The article was written base on one of the chapters of the Ph.D thesis of Thaiza Clemente Couto Bissacot, defended with the orientation of the Professor Sílvia Maria Alves Corrêa Oliveira.
Thaiza Clemente Couto Bissacot: Article author.