POTATO CROP GROWTH AS EFFECTED BY NITROGEN 939
POTATO CROP GROWTH AS AFFECTED BY NITROGEN
AND PLANT DENSITY1
CARLOS ALBERTO DA SILVA OLIVEIRA2
ABSTRACT - Growth and development variables and dry matter characteristics were studied for cultivar Snowden of potato (Solanum tuberosum L.) to evaluate nitrogen and plant density influence. Disregarding ending of season plant stress, the average number of actives haulms per plant was five and it was not affected by plant spacing. However, seasonal and final number of active haulms per plant were increased at 200 kg/ha of nitrogen. Maximum stem elongation was reached quickly with double density and had the tendency to keep constant at the highest and lowest nitrogen levels after 70 days after planting. Specific stem mass defined as mass per unit stem length was established as an indirect measure of stem thickness and load capacity. Specific leaf mass position in plant was higher at upper stem leaves, increased as plant density increased and did not vary markedly over time throughout the season. The rate of leaf appearance increased drastically due to more branching caused by high nitrogen level, and increased above ground dry matter per plant. Canopy growth and development influenced main tuber yield components. The number of active tubers per haulm decreased after 60 days after planting showing that tuberization is reversible. Tuber growth functions were established allowing the estimate of dry biomass partitioning coefficients for each plant organ.
Index terms: Snowden cultivar, plant nutrition, canopy, leaf area, tubers, stems, dry matter, plant population.
CRESCIMENTO DA BATATEIRA INFLUENCIADO POR NITROGÊNIO E DENSIDADE DE PLANTIO RESUMO - Foram estudadas variáveis de crescimento e desenvolvimento e características da matéria seca da batata (Solanum tuberosum L.), cultivar Snowden, com o objetivo de avaliar a influência do nitrogênio e da densidade de plantio. Desconsiderando o estresse da planta ao final da estação, o número médio de hastes ativas por planta foi de cinco, e não foi afetado pelo espaçamento entre plantas. Entretanto, o número médio estacional e final de hastes ativas por planta foi aumentado com 200 kg/ha de nitrogênio. O comprimento máximo do caule foi atingido rapidamente quando se dobrou a densidade de plantio, e apresentou a tendência de ficar constante nos níveis mais alto e mais baixo de nitrogênio, 70 dias após o plantio. A massa de caule específica, definida como massa por unidade de comprimento de caule, foi estabelecida como uma estimativa da espessura e capacidade de suporte do caule. A massa de folha específica, por posição na planta, foi maior nas folhas mais altas do caule, aumentou com a densidade de plantio, e não variou acentuadamente com o tempo durante o ciclo da cultura. A taxa de surgimento de folhas aumentou acentuadamente, em virtude da maior formação de ramos, causada pelo alto nível de nitrogênio, aumentando a matéria seca acima do solo, por planta. O crescimento e desenvol-vimento da parte aérea da planta influenciou os componentes de produção dos tubérculos. O número de tubérculos ativos por haste diminuiu depois de 60 dias após o plantio, o que mostra que a tuberização é reversível. Funções de crescimento de tubérculos foram ajustadas, permitindo estimar coeficientes de partição de biomassa seca de cada parte da planta.
Termos para indexação: cultivar Snowden, nutrição de planta, cobertura vegetal, superfície foliar, tubérculo, haste, matéria seca, população de planta.
INTRODUCTION
Plant growth analysis is usually based on total and plant parts dry matter, size and numbers of dif-1 Accepted for publication on May 28, 1999.
ferent parts per plant or per sample and number of shoots per unit ground area. From these values growth characteristics (various indexes, ratios and coefficients) are calculated. These growth charac-teristics allow to describe the growth of the plant or plant organ and the relationship between the assimilatory apparatus and dry matter production (Sands et al., 1983).
Potato is an undetermined growth plant in which leaves and branch architecture can be modeled in different ways depending on model complexity and the number of state variables involved. Neverthe-less, understanding and quantifying above and be-low ground plant phenology according to different environmental factors (Millard & MacKerron, 1986; Ojala et al., 1990) and cultivars (Zaag et al., 1990) is an important step toward an adequate modeling of potato growth and development.
Soil nitrogen sources and split N fertilizer appli-cations have a major role in maintaining an optimum plant canopy and tuber growth (Westermann & Davis, 1992). However, there is little quantitative in-formation available on how N affects expansion, fi-nal size and duration of different plant organs, fur-thermore, some results are contrasting. It was found (Firman & Allen, 1988) that leaves of field crops pro-vided with ample N had shorter life spans than com-parable ones from N deficient crops. In contrast, Vos & Biemond (1992) observed a positive effect of high rates of N supply on the leaf longevity for potted plants, in the order of three weeks.
Availability of N in the soil is highly dependent on N mineralization (Ritz et al., 1992) and N leaching processes. It may vary markedly during the growing season and somehow affect haulm branching (Millard & MacKerron, 1986) and crop productivity. Also, different plant densities play an important role on plant N uptake, affecting yield quality and quantity, especially when considering potato seed production, usually oriented to produce small size tubers by re-ducing plant spacing.
Snowden is a recently developed, long cycle pro-cessing potato cultivar that already accounted for 34% of total Michigan planted area in 1993 (Michi-gan Potato Industry Commission, 1994). However, information about its canopy growth and develop-ment characteristics is missing.
The main objective of this paper was to study Snowden growth, development and dry matter dis-tribution within the plant as affected by different lev-els of N and plant population and to establish char-acteristics necessary to current models of the pro-ductive process.
MATERIAL AND METHODS
On May 5, 1994, sprouted (about 2 mm) whole and tuber seed pieces with about 55 g were manually planted in 0.1 m deep furrows spaced 0.86 m apart on McBride sandy loam (Latitude 43.3 North). Treatments analyzed were part of a randomized complete block experiment. Single (SD) and double (DD) densities treatments used had 3.81 (0.3 m apart), and 7.62 plants per m2 (0.15 m
apart). Banding N treatments in kg/ha at planting, first and second side dresses were: 40-0-0 (window plot); 40-60-40; 40-160-0 and 40-80-30 and were designated 40SD, 140SD, 200SD and 150DD, respectively. First and second side dress were applied at 42 and 78 days after planting (dap). The emergency date was established when about 50% of the plants emerged. One vine killer was applied at 113 days after planting, and final harvest was done at 126 days after planting.
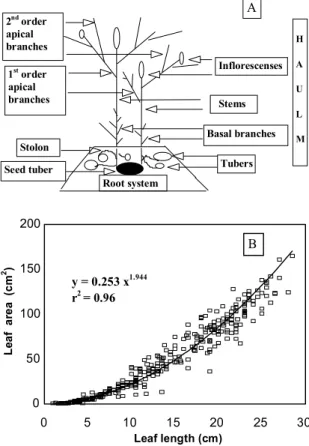
Fig. 1A shows adopted terminology and the morpho-logical scheme of the potato plant without considering leaves and leaf stipules (special leaves or leaflets emerging from axillas). First order apical branches developed from the second, third or fourth axile located right below the stem inflorescence. Second and higher order apical branches developed as shown. Basal branches emerged from lower axillas and developed earlier. Stems emerged from the seed tuber and terminated at the inflorescence or its rudiments. Secondary stems or branches, which originated from be-low ground axillas in small amounts (Allen & Wurr, 1973), were not differentiated from the stem. Thus, each haulm was formed by one stem, branches, inflorescence, leaves, leaf stipules, stolon, tubers, and roots. The root system was not evaluated in this study since it generally com-prises less than 3% of the total dry biomass (Manrique et al., 1991).
Plant organs were considered senescent when they were totally banded or fallen apart or when at least 50% of their extension had dried.
POTATO CROP GROWTH AS EFFECTED BY NITROGEN 941
Twelve plants per treatment were used to estimate the average number of active haulms per plant during the sea-son (42, 49, 55, 63, 77, 90, and 104 days after planting). Data were analyzed, considering time as a subplot addi-tional factor.
Six average active haulms per plant and treatment (two samples of three plants each collected with an interval of four days) were cut at the soil surface and analyzed allow-ing the evaluation of leaf length, area and mass. Active foliar area was measured with a LICOR-3100 area meter and dry matter (after 48 hours at 60ºC) in a 0.001 g bal-ance. Excluding leaf stipules, which were evaluated sepa-rately, leaf length was measured from petiole insertion on the stem to leaf tip. Such measurements allowed an esti-mate of leaf area by the equation stated in Fig. 1B. Leaf position on the stem and branches (leaf number) was num-bered in ascending order from one (bottom) to n (top), respectively. Top leaves smaller than 0.03 m were disre-garded to reduce measurement errors. Specific leaf mass (dry mass per unit of leaf area) was calculated for each
leaf. Leaf area (leaves + leaf stipules) per plant was esti-mated multiplying leaf area per haulm by the number of active haulms per plant, in order to compute leaf area index. Mass of senescent leaves was obtained from the last leaf mass average observed for the respective leaf num-ber. Dry mass of apical and basal branches were also evalu-ated.
The yield component number of tubers per haulm was obtained dividing total tubers per plant by the average number of active haulms per plant (excluding final values). Tuber growth was evaluated at 63, 77, 90 and 105 days after planting from ten plants sampled on an adjacent plot with 40 and 80 kg/ha of N applied at first and second side dress and designated 120SD. Only tubers from stolons with a swollen tip bigger than 0.001 m were counted and weighed. Mass and number of active stolons were also recorded.
A below ground or tuber growth logistic equation, Ft(dap), similar to the one described by Berger (1981), was given by Y = 1 / { D+ c. exp[u.(Xo - X)]} and used to fit data, where Ywas the tuber dry matter in g/plant, D was the reciprocal of maximum (final) yield for the treat-ment, c was obtained by the difference1 / yo - D where yo
was the average tuber dry matter at tuber bulking initia-tion, u is the average growth constant, Xo is the number of days after planting for the assumed yo,andX is any
num-ber of days after planting between tunum-ber initiation and harvest (Xo ≤ X ≤ Xfinal). In order to fit visually field
data, tuber bulking initiation was found by trial and error. Only three development stages were considered in this analysis: from planting to emergence (emergence), from emergence to tuber bulking initiation (vegetative) and from tuber bulking to harvest (bulking).
Measured field data allowed to fit above ground accu-mulated growth sigmoid functions for each plant organ and treatment stated as: active and senescent leaf plus leaf stipules growth functions, Flw(dap), stem growth func-tions, Fs(dap), and branches growth funcfunc-tions, Fb(dap).
Assimilate daily partitioning coefficients, for each plant organ, were defined by the ratio of the derivative of the plant organ dry matter function and the derivative of above and below ground accumulated growth functions, obtained by the sum of Flw(dap), Fs(dap), Fb(dap) and Ft(dap) since they had a common domain.
RESULTS AND DISCUSSION
Mean air temperature from planting till vine killer application was 18°C. Due to sufficient rainfall, complementary overhead irrigation was used only three times.
0 50 100 150 200
L
e
a
f
a
re
a
(c
m
2 )
0 5 10 15 20 25 30
Leaf length (cm) y = 0.253 x1.944
r2 = 0.96
B Stems 1st
order apical branches 2nd
order apical branches
Basal branches
Seed tuber
Inflorescenses
Tubers
Root system
H
A
U
L
M
A
Stolon
Haulm
Haulm life span and number of active haulms per plant were affected over time by N level but not by plant density treatments as shown by 104 days after planting and season data (Table 1). However, exclud-ing final (104 days after plantexclud-ing) measurements, time and treatment interaction was eliminated and the average number of active haulms per plant did not differ (p < 0.05). They were 5.1, 5.1, 5.3 and 4.6 for 40SD, 140SD, 200SD and 150DD treatments, respec-tively. Thus, disregarding any possible end-of-sea-son plant stress, the average number of haulms per plant for cultivar Snowden was five.
Considering all data for the season, there was dif-ference among treatments regarding the number of active haulms per plant. 200SD treatment showed a larger haulm life span than the other ones because of increased plant tolerance to Verticillium wilt of potato. The average number of active haulms per plant is a variable that is most affected by cultivar characteristics (Susnochi, 1982; Morena et al., 1994); however, diseases and environmental stresses play an important role too.
The number of active haulms per plant is a vari-able linked to the differences in total tuber yield among cultivars (Morena et al., 1994) and in tuber size
dis-tribution (Struick et al., 1990). It may vary a lot de-pending on seed age, mass, and number of growing eyes or sprouts (Gill et al., 1989). Thus, considering that sprouted tubers are usually not separated by sprout number before planting, and that calculation of the number of haulms per plant is not straightfor-ward, for known tubers properties and environmen-tal conditions (Reestman & Wit, 1959; Struick et al., 1990), this cultivar variable or its equivalent number of haulms per unit area must be an additional input data for more comprehensive and quality oriented potato yield modeling. Values should be recorded at least after first side-dressing and around 60 days after planting when below ground basal branches may develop.
It is also important to provide models with the ability to predict how a given N level, plant density or other factor may stress plants and influence haulm senescence. Effects of Verticillium wilt of potato, which is an N stress related disease (Davis et al., 1994), should also be considered.
Below ground stem growth before emergence
The average emergency was observed at 27 days after planting and it was not affected by plant den-sity. An average stem growth rate of 3.3 mm/day
1Averages with different letters within a column are significantly different at the 5% probability level using Tukeys test.
Treatment Haulms per plant -season
Haulms per plant -104 dap
Tubers per haulm
-126 dap
Average tuber mass
(g/tuber)
Total yield
(ton/ha) USDA #1yield (ton/ha)
Tuber dry matter
(%)
40-0-0 SD
3.4a 0.2a 1.9a 69.5b 25.5b 16.8b 21.1a
40-60-40 SD
3.8a 1.1a 2.0a 87.9ab 32.9ab 25.7ab 21.8a
40-160-0 SD
4.8b 3.6b 1.8a 107.9a 39.2a 33.1a 22.6a
40-80-30 DD
3.3a 0.5a 1.5a 79.0ab 40.6a 27.6ab 21.9a
C.V. (%) 14.4 14.4 10.2 12.7 11.3 17.4 4.2
POTATO CROP GROWTH AS EFFECTED BY NITROGEN 943
was obtained for this period, for a maximum sprout length of 90 mm.
Above ground stem growth
After 70 days after planting, above ground stem elongation (Fig. 2A) showed the tendency to keep constant for the highest and smallest N treatment but increased significantly (p < 0.01) before 70 days after planting, when using double density with 150 kg/ha of N. Thus maximum stem elongation was reached quickly for double density and slowly for single density treatments. Maximum stem lengths were 0.485, 0.550, 0.464, and 0.592 m for treatments 40SD, 140SD, 200SD, and 150DD, respectively.
Specific stem mass
Values (Fig. 2B) ranged from 30 to about 100 mg/cm for all treatments. The tendency of high values for treatment 200SD, after 70 days after plant-ing, probably allowed each haulm to support more branches and leaves. On the other hand, 150DD and 40SD treatments had a different pattern in compari-son with 140SD treatment, which showed small but uniform increasing rates along the season.
Stem growth and partitioning
Maximum stem length was reached faster for 150DD treatment as a natural plant response for light competition. However, the effect of closer spacing on increasing stem height at temperate sites may dif-fer at tropical sites as pointed out by Zaag et al. (1990). On the other hand, final stem size for 200SD treat-ment was reduced in favor of stem thickness and load capacity without changing much partitioning coefficients for this plant part (Fig. 3A and 3B). This was most probably due to the increased production of apical branches and leaves observed for this high N level. Thus, besides being cultivar and site depen-dent, maximum stem length is more drastically af-fected by soil nutrient availability (N level) than by competition for light (plant density).
Stem partitioning coefficients were modified by environmental stresses caused by nutrients and light competition. Plant organ partitioning coefficients have been used to replace the lack of knowledge on how biomass, formed by the incoming photosyn-thetically active radiation, is distributed within the plant. Grant (1989), working with maize, suggested that such coefficients are fairly independent of envi-ronment, which did not seem to be the case for the potato crop. It should be pointed out that instead of using derivatives to calculate plant organ partition-ing coefficients a better procedure is to consider the increment in plant organ dry mass over the incre-ment in total plant dry mass, during a short interval in days.
Leaf area and specific leaf mass
All treatments had the same amount of N per area until the first side dress, 42 days after planting. Thus, at this time, results reflect plant spacing responses. FIG. 2. A) Above ground stem elongation; B)
Spe-cific stem mass (SSM) seasonal variation for treatments combining nitrogen levels (kg/ha) and single and double density plant popula-tion (SD = 3.8 and DD = 7.6 plants/m2).
20 40 60 80 100 120
SS
M
(
m
g
/c
m
)
40 50 60 70 80 90 100
Days after planting
40SD 140SD 200SD 150DD
B
20 30 40 50 60 70
St
e
m
l
e
n
g
th
(
c
m
Leaf area and length (Fig. 4A) had high values at an intermediate position over the stem. Double density treatment decreased leaf area growth in comparison
with single density treatment. On the other hand, as a plant response to different photosynthetically ac-tive radiation regime due to haulm growth and com-petition interaction, specific leaf mass for individual leaf and position on the stem showed (Fig. 4B) the tendency to be higher for upper than lower leaves due to the increased ability of top leaves to intercept and absorb photosynthetically active radiation. This tendency was increased for upper leaves in the double density treatment certainly to the increased stem elongation observed. At this early time specific leaf mass averages for all leaves in the haulm were 5.1 and 5.2 mg/cm2 for single and double density treat-ments, respectively.
Seasonal leaf dry mass leaf area function
Leaf area was highly correlated (95%) with leaf dry biomass. The slope of the regression line
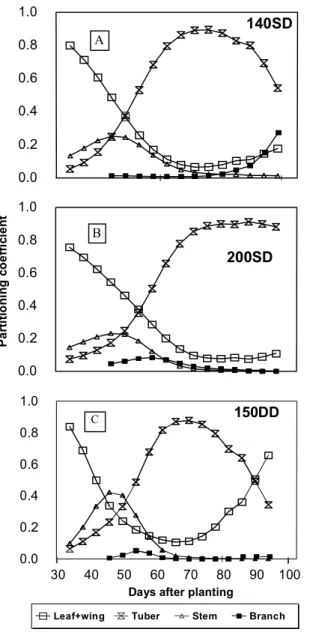
ad-FIG. 3. Plant dry matter partitioning coefficients for treatments combining nitrogen levels (kg/ha) and single and double density plant popula-tion (SD = 3.8 and DD = 7.6 plants /m2).
A) 140 kg/ha of nitrogen and single spacing treatment; B) 200 kg/ha of nitrogen and single spacing treatment; C) 150 kg/ha of nitrogen and double spacing treatment.
FIG. 4. A) Individual leaf area; B) Specific leaf mass (SLM) per position in the haulm at 42 days after planting for single and double density plant population (SD = 3.8 and DD = 7.6 plants/m2).
0 20 40 60 80
100
L
e
a
f
a
re
a
(
c
m
2 )
SD DD
A
3.5 4.5 5.5 6.5 7.5
SL
M
(
m
g
/c
m
2 )
0 2 4 6 8 10 12 14
Leaf number B
0.0 0.2 0.4 0.6 0.8 1.0
30 40 50 60 70 80 90 100
Days after planting
Leaf+wing Tuber Stem Branch
150DD C
0.0 0.2 0.4 0.6 0.8 1.0
P
a
rt
it
io
n
in
g
c
o
e
ff
ic
ie
n
t
200SD B
0.0 0.2 0.4 0.6 0.8 1.0
30 40 50 60 70 80 90 100
POTATO CROP GROWTH AS EFFECTED BY NITROGEN 945
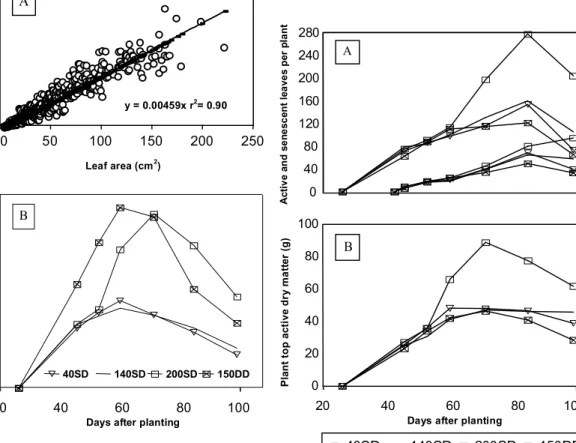
justed (Fig. 5A) with all data for the season provided a value of 4.59 mg/cm2. Average and maximum area of individual leaves for all the treatments were 48 cm2 and 217.2 cm2. Regression analysis of leaf dry mass versus leaf area at 42 days after planting provided a slope of 4.55 mg/cm2, which was similar to the one observed when considering all data for the season.
Leaf area index and leaf area per haulm
Throughout the season, because of the double number of haulms per unit area (Fig. 5B), leaf area index increased for 150DD in comparison to other treatments. After 60 days after planting leaf area per haulm and leaf area index were higher for 200SD than
the other treatments, as a plant response to high N amount in the soil.
Active and senescent leaves
Total number of above ground stem leaves ranged from 14 to 17 and it was affected by local differences between the soil surface (after hilling up) and seed tuber position. The number of active leaves (Fig. 6A) increased substantially with high N level applied at the first side-dressing and decreased with plant den-sity. Leaf appearance rate increased drastically due to more branching (1st and 2nd order apical branches) caused by the increased N level.
The senescence process started right after hilling up from bottom to upper leaves. Senescence showed little effect of treatments at the beginning but in-creased considerably late in the season. Leaf
dura-FIG. 5. A) Seasonal leaf dry mass area regression function; B) Leaf area index (LAI) for all treatments combining nitrogen levels (kg/ha) and single and double density plant popula-tion (SD = 3.8 and DD = 7.6 plants/m2).
FIG. 6. A) Seasonal number of active and senescent leaves per plant; B) Average above ground growth. 0 40 80 120 160 200 240 280 A c ti v e a n d s e n e s c e n t le a v e s p e r p la n t A 0 20 40 60 80 100 P la n t to p a c ti v e d ry m a tt e r (g )
20 40 60 80 100
Days after planting
40SD 140SD 200SD 150DD
B 0 1 2 3 4 5 L A I (m 2/m 2)
20 40 60 80 100
Days after planting
40SD 140SD 200SD 150DD
B 0.0 0.2 0.4 0.6 0.8 1.0 1.2
0 50 100 150 200 250
Leaf area (cm2)
L e a f d ry m a s s ( g )
y = 0.00459x r2 = 0.90
tion, obtained on the time axis by the difference be-tween actives and senescent leaves, showed in-creased leaf longevity for 150DD and dein-creased leaf longevity for 200SD treatments. All values were re-duced at season end due to number of active haulms per plant decrease.
Leaf growth and partitioning
Specific leaf mass varied according to position in the plant and treatments. Top leaves and increased plant population showed the tendency to have high specific leaf mass values, which agrees with Tooming & Tammets (1984), when studying plant population equal to or higher than 6.0 plants/m2. Minimum val-ues of specific leaf mass were observed at moder-ated depth in the haulm, which agrees with Gutschick & Wiegel (1988). Increased absorption of photosyn-thetically active radiation at high depth in the haulm (due to reduced leaf shading and leaf-angle distribu-tion, with more erected leaves at the top and more horizontal leaves toward the bottom) increases light penetration (Duncan et al., 1967) and helps explain such variation in specific leaf mass for different leaf number and treatment.
When simulating leaf area expansion using leaf dry mass increments divided by the respective spe-cific leaf mass value, it is important to keep in mind that specific leaf mass of an expanding leaf is higher at the top than at the bottom of the haulm. On the other hand, using the leaf dry mass leaf area func-tion, this simulation may be more simplified since throughout the season there was no significant en-vironmental effect, within the range under which data set was collected. It should also be allowed for re-duced leaf duration caused by N and plant spacing. Duration of a plant organ does not have a fully ac-cepted definition, and it makes comparisons with other results rather difficult.
Leaf (main source) partitioning coefficients de-creased systematically as tuber (main sink) partition-ing increased (Fig. 3). Thus, any eventual large re-duction in the main sink part observed early in the season may reverse this trend (Fig. 3C). Soil stresses (nutrients or water) caused by reduced amount of nitrogen available to plant were likely to occur with 150DD and 40SD treatments reducing or practically stopping tuber growth.
Branches
Maximum average dry mass per haulm observed for 40SD, 140SD, 200SD and 150DD treatments were 0.125, 0.059, 0.893 and 0.111 grams per haulm, for basal branches, and 0.862, 1.211, 2.244, 0.396 grams per haulm, for apical branches.
Branch growth and partitioning
Apical branches had a much more expressive growth than basal branches. The rate at which apical branches developed was reduced by the decreased N supply and by the increased plant population. Sufficient amounts of N in the soil early in the sea-son seem to induce growth of branches, which is later on reduced in favor of tuber production, as shown by partitioning coefficients (Fig. 3B). Redis-tribution of N in the canopy of N-replete plants (Millard & MacKerron, 1986) seems to allow growth of branches towards the end of the season (Fig. 3A) and it suggests that N-deficient plants may reduce this growth (Fig. 3C).
Above ground active dry matter per plant
Plant top active dry matter (Fig. 6B) was high for treatment 200SD after 60 days after planting and did not differ much for the other treatments in the same period.
Plant organ above ground dry matter functions
Treatment 40SD, not included, and 150DD showed similar data and functions. Accumulated growth functions obtained for each organ (Table 2) were used to estimate assimilate partitioning coeffi-cients (Fig. 3).
Top growth and partitioning
POTATO CROP GROWTH AS EFFECTED BY NITROGEN 947
there is little redistribution of N from the leaves (Millard & MacKerron, 1986) and that above and below ground growth seem to follow a unique prior-ity system for biomass and N partition (Biemond & Vos, 1992). In other words, as N supply becomes limited, root system growth may have a temporary priority over top growth causing extractable water and nutrients to increase or tuber sink is somehow reduced increasing N redistribution within the canopy. Both hypotheses lead to an increase in N availability within the plant top. Increased N miner-alization with time may play a significant role in this process too.
Tuber growth
From 63 days after planting till harvest (Fig. 7A) the number of active tubers per plant for the 120SD plot decreased from 17 to 11.
Considering an average of 20 tubers per plant, an average dry matter content of 15% and an average
specific gravity of 1.04, an estimate of yowas 1.63 g/plant, at tuber initiation (50% of tubers with the diameter larger than 10 mm). Thus, for the logis-tic equation fitted, tuber bulking initiation had al-ready started at 45 days after planting (Fig. 7B). On a per plant basis, double spacing (117.0 g/plant) pro-duced about half of the 200SD treatment yield (233.2 g/plant). However, on an area basis, both yields were about the same. 40SD and 140SD treat-ments produced 141.5 and 188.7 g/plant, respectively. For this rainy year maximum yield obtained at the experimental station was about 50 ton/ha, with the help of an extra amount of N.
Canopy growth and development, as affected by the treatments, influenced main tuber yield compo-nents (Table 1). However, final number of tubers (fi-nal number of active stolons) per haulm and tuber dry matter percentage at harvest were not modified by the treatments.
Treatment Parameter Leaf + wing Stem Branch
140SD a 53.3407 -0.5950 -0.5352
b -74.4611 22.9536 306.7387
c 42.7870 54.4240 175.9787
d -16.7697 7.4096 21.0630
r2 0.9870 0.9950 0.9890
x domain (dap) 35£x£ 95 35 £x£95 45 £x£ 95
200SD a -1.9669 0.0150 13.9533
b 79.4533 24.8496 -15.1562
c 54.9338 53.2627 61.1378
d 8.9027 5.6703 -5.4164
r2 0.9920 0.9980 0.9930
x domain (dap) 35 £x£ 95 35 £x£ 95 45 £x£ 95
150DD a -1247.5783 0.0526 -0.0287
b 1326.0007 22.0792 2.1397
c -173.9712 50.3896 55.4266
d 72.3865 4.3039 2.4111
r2 0.9820 0.9970 0.9970
x domain (dap) 35 £x£ 95 35 £x£ 95 45 £x£ 95
Cho & Iritani (1983). Even so, after tuber initiation, tuber growth had the preference on partitioning of dry matter in comparison with the stem and branches. It is important to notice that environmental factors may reduce tuber sink strength (Manrique & Bartholomew, 1991), altering partitioning of dry mat-ter to this plant part and reducing tuber yield.
Total recommended amount of N applied at the first side-dressing practically doubled maximum leaf area index and delayed the onset of tuber formation about 10 days. Similar results were obtained for the Russet Burbank cultivar (Kleinkopf et al., 1981).
Dynamic models of crop production usually simu-late biomass production on a dry mass basis. Since the tuber dry matter may vary from 14% to more than 25% (Midmore & Roca, 1992), according to many factors, it is necessary to multiply tuber yield dry mass by a factor of seven or four, suggesting that fresh matter yield simulation, large errors may occur if an inappropriate dry matter % (specific gravity or % starch) is provided. The tuber specific gravity was not changed by the treatments studied in contrast with other results (Westermann et al., 1988) suggest-ing that N and plant population did not play an im-portant role in tuber dry matter percentage estab-lishment in this study.
CONCLUSIONS
1. For cultivar Snowden the average number of haulms per plant is five.
2. Above ground stem elongation increases sig-nificantly before 70 days after planting, when using plant double density with 150 kg/ha of nitrogen and it is more affected by soil nitrogen availability than by competition for light.
3. Double density treatment decreases leaf area growth in comparison with single density treatment, at 42 days in the season.
4. Leaf area index increases for double density treatment, throughout the season, due to double number of haulms per unit area, and as a response for high nitrogen side-dressing; however, at the first side-dressing, the number of active leaves increases with high nitrogen level applied and decreases with plant density.
FIG. 7. A) Number of tubers per plant when using 120 kg/ha of nitrogen and single density plant population; B) Tuber growth for all treat-ments combining nitrogen levels (kg/ha) and single and double density plant population (SD = 3.8 and DD = 7.6 plants/m2).
Tuber specific gravity values ranging from 1.07 to 1.09 suggested that all treatments yielded tubers with good chipping quality.
Tuber development and partitioning
Bulking stage provided a large carbon and nutri-ent below ground sink. The actual size of this sink may be difficult to detect considering the fact that the number of active stolons and tubers per plant increase early and decrease late in the season ac-cording to environmental and genetic factors.
As previously mentioned, several tuber initials remained very small or were absorbed causing the number of active tubers to decline, as noted also by
0 50 100 150 200 250
T
u
b
e
r
d
ry
m
a
tt
e
r
(g
/p
la
n
t)
0 20 40 60 80 100 120
Days after planting
120SD 40SD 140SD 200SD 150DD
y = 1 / (d+c.exp(u.(xo-x)))
B 10 12 14 16 18
A
c
ti
v
e
t
u
b
e
rs
p
e
r
p
la
n
t
60 70 80 90 100 110 120 130
Days after planting
y = 6.42+1.1E-6x3 +41400/x2
r2 =0.99
A
POTATO CROP GROWTH AS EFFECTED BY NITROGEN 949
5. Leaf (main source) partitioning coefficients de-creases systematically as tuber (main sink) partition-ing increases; however, nutrient soil stress may re-verse this trend.
6. The rate at which apical branches develop is reduced by decreasing nitrogen supply and increas-ing plant population.
7. Canopy growth and development influence main tuber yield components; however, final number of tubers (active stolons) per haulm and tuber dry matter percentage at harvest are not modified by the treatments.
ACKNOWLEDGEMENTS
To Empresa Brasileira de Pesquisa Agropecuária (Embrapa) and Michigan State University for finan-cial support; to Dr. Joe Ritchie for technical support; to Mr. Laurent Gilet for helping collect field data; to Dr. Richardson Chase for the assistance in conduct-ing field work, and to Dr. June Wey for sharconduct-ing his experience in crop modeling.
REFERENCES
ALLEN, E.J.; WURR, D.C.E. A comparison of two meth-ods of recording stem densities in the potato crop. Potato Research, Wageningen, v.16, p.10-20, 1973. BERGER, R.D. Comparison of the Gomperts and logistic equations to describe plant disease progress. Phyto-pathology,Saint Paul, v.71, n.7, p.716-719, 1981. BIEMOND, H.; VOS, J. Effects of nitrogen on the
devel-opment and growth of the potato plant. 2. The par-titioning of dry matter, nitrogen and nitrate. Annals of Botany, London, v.70, p.37-45, 1992.
CHO, J.L.; IRITANI, W.M. Comparison of growth and yield parameters of russet burbank for a two year period. American Potato Journal, Orono, v. 60, p.569-575, 1983.
DAVIS, J.R.; STARCK, J.C.; SORENSEN, L.H.; SCHNEIDER, A.T. Interactive effects of nitrogen and phosphorus on Verticillium wilt of russet burbank potato. American Potato Journal, Orono, v.71, p.467-481, 1994.
DUNCAN, W.G.; LOOMIS, R.S.; WILLIAMS, W.A.; HANAU, R. A model for simulating photosynthe-sis in plant communities. Hilgardia, Berkeley, v.38, p.181-205, 1967.
FIRMAN, D.M.; ALLEN, E.J. Field measurements of the photosynthetic rate of potatoes grown with dif-ferent amounts of nitrogen fertilizer. Journal of Agricultural Science, Cambridge, Great Britain, v.111, p.85-90, 1988.
GILL, P.A.; ROSS, H.A.; WAISTER, P.D. The control of stem numbers in potato competition experiments using either whole tuber or seed-pieces. Potato Re-search, Wageningen, v.32, p.159-165, 1989. GRANT, R.F. Simulation of carbon assimilation and
par-titioning in maize. Agronomy Journal, Madison, v.81, p.563-571, 1989.
GUTSCHICK, V.P.; WIEGEL, F.W. Optimizing the canopy photosynthetic rate by patterns of invest-ment in specific leaf mass. The American Natural-ist, Chicago, v.132, p.67-86, 1988.
KLEINKOPF, G.E.; WESTERMANN, D.T.; DWELLE, R.B. Dry matter production and nitrogen utilization by six potato cultivars. Agronomy Journal, Madi-son, v.73, p.799-802, 1981.
MANRIQUE, L.A.; BARTHOLOMEW, D.P. Growth and yield performance of potato grown at three el-evations in Hawaii: II. Dry matter production and efficiency of partitioning. Crop Science, Madison, v.31, p.367-372, 1991.
MANRIQUE, L.A.; KINIRY, J.R.; HODGES, T.; AXNESS, D.S. Dry matter production and radiation interception of potato. Crop Science, Madison, v.31, p.1044-1049, 1991.
MICHIGAN POTATO INDUSTRY COMMISSION (Lansing, United States). Michigan potato acreage projection. Potato News Line, Lansing, v.6, n.10, p.1-3, 1994.
MIDMORE, D.J.; ROCA, J. Influence of production and storage conditions on subsequent growth and tuber yield of potato (Solanum spp.) in the hot tropics. Journal of Agricultural Science, Cambridge, Great Britain, v.119, p.45-58, 1992.
Ap-plied Biology, Wellesbourne, v.109, p.427-437, 1986.
MORENA, I. de la; GUILLEN, A.; MORAL, L.F.G. del. Yield development in potatoes as influenced by cul-tivar and the timing and level of nitrogen fertiliza-tion. American Potato Journal, Orono, v.71, p.165-173, 1994.
OJALA, J.C.; STARK, J.C.; KLEINKOPF, G.E. Influ-ence of irrigation and nitrogen management on po-tato yield and quality. American Potato Journal, Orono, v.67, p.29-43, 1990.
REESTMAN, A.J.; WIT, C.T. de. Yield and size distribu-tion of potatoes as influenced by seed rate. Nether-lands Journal of Agricultural Science, Wageningen, v.7, p.257-268, 1959.
RITZ, K.; GRIFFITHS, B.S.; WHEATLEY, R.E. Soil mi-crobial biomass and activity under a potato crop fertilized with N with and without C. Biology and Fertility of Soil, Berlin, v.12, p.265-271, 1992. SANDS, P.J.; HACKETT, C.; NIX, H.A. A model of the
development and bulking of potatoes (Solanum tuberosum L.). I. Derivation from well-managed field crops. Field Crops Research, Amsterdam, v.2, p.309-331, 1983.
SINCLAIR, T.R.; HORRIE, T. Leaf nitrogen, photosyn-thesis and crop radiation use efficiency: a review. Crop Science, Madison, v.29, p.90-98, 1989. STRUICK, P.C.; HAVERKORT, A.J.; VREUGDENHIL,
D.; BUS, C.B.; DANKERT, R. Manipulation of
tu-ber-size distribution of a potato crop. Potato Re-search, Wageningen, v.33, p.417-432, 1990. SUSNOCHI, M. Growth and yield studies of potatoes
developed in a semi-arid region. I. Yield response of several varieties grown as a double crop. Potato Research, Wageningen, v.25, p.59-69, 1982. TOOMING, K.G.; TAMMETS, T. K. Relationship of
specific leaf weight to the irradiation density of ad-aptation and par regime in some plant species. So-viet Plant Physiology, Moscow, v.31, n.2, p.201-207, 1984.
VOS, J.; BIEMOND, H. Effects of nitrogen on the devel-opment and growth of the potato plant. 1. Leaf ap-pearance, expansion growth, life spans of leaves and stem branching. Annals of Botany, London, v.70, p.27-35,1992.
WESTERMANN, D.T.; DAVIS, J.R. Potato nutritional management changes and challenges into the next century. American Potato Journal, Orono, v.69, p.753-767,1992.
WESTERMANN, D.T.; KLEINKOPF, G.E.; PORTER, L.D. Nitrogen fertilizer efficiencies on potatoes. American Potato Journal, Orono, v.65, p.377-386, 1988.