ISSN 1516-635X Oct - Dec 2012/ v.14 / n.4 / 233-304
Review
Author(s) Patricio I S1 Mendes A A2 Ramos A A2 Pereira DF3
1 Poultry production consultant 2 Professor, UNESP CAMPUS BOTUCATU 3 Professor, UNESP CAMPUS TUPÃ
Mail Adress
Corresponding author e-mail address [email protected]
Keywords
Poultry production, production efficiency, genetics, livability.
Submitted: January/2012 Approved: October/2012
ABSTRACT
This article describes the genetic evolution of commercial broilers between 1990 and 2009, considering live performance, in particular, in terms of weight gain and feed conversion ratio. In order to determine if the assumption that the relationship between body weight gain and feed conversion ratio is increasing and positive, information on all broiler strains reared in Brazil were collected from several companies present in five Brazilian regions. This survey aimed at evaluating broiler live performance as a function of genetic improvement with time. Broiler performance improved, as shown by the statistical differences obtained for the following parameters: livability, live weight, daily weight gain, feed conversion ratio, and production efficiency index between 1990 and 2009. However, live weight gain and feed conversion ratio are emphasized due to the significant differences found along the studied period.
INTRODUCTION
During the last few years, Brazilian poultry production has developed with broiler genetic improvement. Its live performance results are among the best in the world as a result of modern technologies applied in rearing management, nutrition, housing, and health control. The data obtained from the Brazilian companies evaluated in the present study demonstrate this. Many Brazilian broiler companies present better results than those obtained in the US, Italy, France, Canada, Argentina, Chile, among others (Teeter, 2010). Weight gain and feed efficiency are genetically correlated (Mendonça & Michelan, 2001), and this correlation is positive, even under unfavorable conditions. Production factors, such as feedstuffs, labor, equipment, environment, production methods, and measurement accuracy directly influence broiler growth, and may reduce weight gain in up to 1.6 g/day and increase feed conversion ratio in 0.02 (Patrício, 2007). These factors result in differences between the expected capacity and the actual results obtained in the field. Mendes et al. (1988) showed 145 g
This applied study reviews the history of Brazilian broiler production and analyzes performance results obtained between 1990 and 2009, aiming at describing their actual performance during the last 20 years, with emphasis on feed conversion ratio (FCR) and daily weight gain (DWG).
BRAZILIAN POULTRY PRODUCTION
HISTORY
The first broiler performance data were recorded in the American continent in the 1920s in the USA (Leeson & Summers, 1997). At that time, broilers weighed 1.0 kg and presented 5:1 feed conversion ratio at 120 days of age. Mortality was around 20%, according to those authors. In the 1920s and 1930s, chickens were reared for egg production or for ornamental and cockfight purposes. Breed crossbreeding for meat production started only in the 1940s. In the 1930s, broilers weighed about 1.5 kg at 105 days of age, with a FCR of 3.5.
The 1940s were important for the development of global commercial poultry production with the launching of the “Chicken of Tomorrow” by the US government. This was the beginning of the modern broiler, a crossbred between Cornish, of British origin, and New Hampshire, of US origin. The US “Standard of Perfection” recorded for the Cornish breed the following data: 4.8 kg rooster weight, 3.9 kg hen weight, 3.7 kg male broiler weight, and 3.0 kg of female broiler weight. In 1944, Brazilian farmers became interested in poultry production and imported hatchable eggs from the United States (Arashiro, 1989). By the end of the 1940s, processing plants in Rio de Janeiro and in São Paulo annually slaughtered about 1.5 million and 1.0 million broilers, respectively, determining the beginning of commercial broiler production in Brazil. Through an agreement between Brazil and the United States, the ETA 42 project, a Brazilian committee went to the US in 1957 and brought back birds from the main pure US breeds (Arashiro, 1989).
At that time, broiler performance was 1.5 kg live weight at 75 days, and feed conversion ratio between 2.5 and 3.2, according to data recorded in Brazil and in the USA. Specific crosses for meat or egg production were already known in Brazil and other countries of the world. Brazil reared Arbor Acres hybrids from the USA. Broiler breeder farms, hatchery, and feed mills were included in the commercial poultry production circle. Complete feedstuffs were usually manufactured in feed mills belonging to foreign companies.
High-technology supplies, such as vaccines, antibiotics, performance-enhancing additives, amino acids and vitamins, were imported.
In the 1970s, during the so-called “economic miracle”, the Brazilian government stimulating poultry production through loans and incentives to integrated companies, particularly in southern Brazil. After that, the integration system was spread to other regions, up to the Amazon, where it stared in the state of Pará in 1978. At that time, the best broiler genetic companies were competing for the Brazilian market, and broiler performance had significantly improved: 1.8 kg live weight in 56 days, with a feed conversion ratio of 2.5. At that time, carcass yield was not important; only live weight mattered. Brazilian chicken meat started to be exported in 1975, when 3,500 tons were exported to the Middle East. At the end of the 1970s, 81,100 tons were exported, which represents an extraordinary 25 fold increase (Gonzales, 1990).
In the 1980s, Brazilian commercial poultry production established itself as competitive, organized, integrated in more than 75%, annually exporting more than 200,000 tons of chicken meat, and competing with the United States and European countries. Performance results obtained in Brazil during that period were competitive with those obtained in the US, where, 49-d-old males weighed 2.08 kg with a FCR of 1.87 and 56-d-old females weighed 1.98 kg with a FCR of 2.04 (North, 1984).
Chicken exports started to change in the beginning of the 1980s, when Brazil exported the first special cuts to Japan. According to Mior (2005), the greatest innovation in the 1980s was the introduction of the cut-up line in the processing plants, i.e., transforming the whole chicken in to parts, bone-in or deboned. Consequently, high yield genetic strains, with high meat yield of valuable parts, high weight gain, and excellent feed conversion ratio, were prioritized.
in 2009 (UBA, 2009). In 2010, there was the most significant merger in Brazilian poultry production, when SADIA and PERDIGÃO formed the company BR FOODS, one of the largest broiler companies in the world, with 1.6 billion broilers processed annually. Moreover, the companies JBS and MARFRIG migrated to poultry production, and became major beef, pork, and poultry meat producers.
QUANTITATIVE AND QUALITATIVE
ANALYSIS
The quantitative and qualitative analysis presented here gathers Brazilian chicken meat production from five regions (North, Northeast, Central-West, Southeast, and South), collected between 1990 and 2009 from poultry companies. The following data were analyzed: number of birds, age, mortality rate, average body weight, weight gain, feed conversion ratio, genetic strain, and region. In total, data on about 4.6 billion broilers were considered between 1990 and 2009.
The comparative study between actual and adjusted feed conversion ratio considered live weights of 1.7, 2.0, and 2.5 kg. These data were correlated to verify the development of commercial broilers performance during the studied period. Aiming at standardizing data to allow more accurate analysis, feed conversion ratio was adjusted to 2.5 kg live weight, which is closest to the standard market weight in 2009. Live weight as adjusted by dividing total flock weight by days until slaughter (Froilano, 2001) feed conversion ratio (FCR) was calculated dividing total flock feed intake by total flock weight gain during the growout. Corrected feed conversion ratio (CFCR), using FCR for 2.5 standard live weight, was calculated using Eq. 1 (FLOIRANO, 2001).
CFCR SW = (SW – AW) x 64/20 + FCR Eq. 1 where: CFCR SW = feed conversion ratio adjusted for standard weight; SW = standard weight, kg; AW= average flock weight, kg; 64/20 = correction factor; FCR = flock feed conversion ratio
Eq. 1 was simplified, resulting in Eq. 2:
CFCR = (SW-AW) /3.2 + FCR Eq. 2 Considering broiler genetic evolution, it should be mentioned that, in 2009 or eight years after this formula was first published, correction factor was corrected from 64/20 to 70/20, i.e., for every 70 g weight gain, feed conversion ratio increased 20 g. Therefore, a new equation was applied (Eq. 3):
CFCR = (SW-AW) /3.5 + FCR Eq. 3 Daily weight gain was calculated dividing total flock weight on market day by the number of rearing days.
Livability was calculated by subtracting the number of processed birds from the initial number of birds housed, and was expressed as percentage (%). Because these are biological values, that is, they cannot be predicted, actual data were used in the present study.
Production efficiency index (PEI) was calculated according to Eq. 4:
PEI = LB x DWG x 100/FCR Eq. 4 where: LB = livability; DWG = daily weight gain; FCR = feed conversion ratio
The mean values of the following characteristics were analyzed: live weight, daily weight gain, observed feed conversion ratio, feed conversion ratio adjusted to 1,700 g; 2,000 g; and 2,500 g body weight, production efficiency index, and mortality (Table 1).
Samples collected between 1990 and 2009 were statistically analyzed, including 4.6 billion broilers produced in five Brazilian regions, 193 samplings, 23 companies, and eight genetic strains. Linear and quadratic least square models were applied, with collection year and region as causes of variation and market age as covariate. The procedure described in the GLM of SAS (Amorim, 2010) was used to verify trends of the evaluated characteristics with co-variance adjusted data as a function of processing year to determine the coefficient of regression, indicating increase or decrease rate as a function of year (Amorim, 2010).
RESULTS AND DISCUSSION
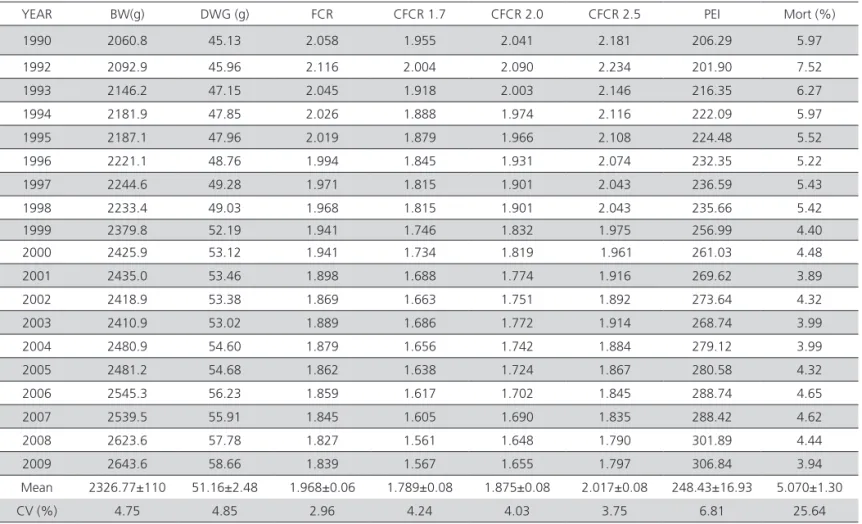
The cumulative annual performance results were extracted from annual tables and consolidated (Table 1). The following average values were obtained in 1990: 2,060 kg live weight, 45.13 g weight gain, 45.55 days to market, 5.97% mortality, 2,058 feed conversion ratio, and 206.29 production efficiency index (PEI). Twenty years later, in 2009, average values were: 2,643 kg live weight, 58.66 g weight gain, 45.05 days to market, 3.94% mortality, 1,839 feed conversion ratio, and 306.84 production efficiency index (PEI).
Average live weight increased from 2.060 kg in 1990 to 2.643 kg in 2009, representing a 0.583 kg or 28.4% increase in 20 years. The trend in Brazil is to process 2.5 to 2.7 kg broilers to supply the demand of the parts and further-processed markets. The exception is the 1.5-1.7 kg broiler exported to the Middle East. This is why 2.5 kg was used for production cost comparison.
21.9 points or 10.6% better feed conversion ratio during those 20 years. This CFCR is not consistent with the results obtained in the field, which usually represent the best flocks produced during the best seasons, individual flocks, or 25% of the best flocks. There are FCR field results of 1.65 at 2.5 kg market weight, but these do not represent the average. FCR below 1.6 for 2.5 kg birds processed at 37.5 are frequently recorded. In this sample, under field conditions, broilers gained 2.41 g/h, while their genetic potential is to gain up to 2.91 g/h. That gain is approximately 83% of their genetic potential. Currently, it is possible to obtain 68 g DWG at a 44.5 market age or a weight gain of 2.83 g/h in many companies.
Estimated average live weight, daily weight gain, observed feed conversion ratio, feed conversion ratio adjusted to 1,700 g; 2,000 g; and 2,500 g body weight, production efficiency index, and mortality values in the studied population were: 2326.77±110.59 g, 51.16±2.48 g, 1.968±0.06 g, 1.789±0.08, 1.875±0.08 g, 2.017±0.08 g, 248.43±16.93 g, and 5.07±1.30%, respectively, and coefficients of variation were, in the same order: 4.75%, 4.85%, 2.96%, 4.24%, 4.03%, 3.75%, 6.81%, and 25.64% (Table 1).
Market age linearly influenced body weight, daily weight gain, feed conversion ratio, mortality and production efficiency index and also a quadratic effect on body weight, daily weight gain, feed conversion ratio, mortality and production efficiency index. Such results showed that the development rate of these characteristics decreased as birds age (Table 1). Average live weight (ALW) annually increased in 23.275 g, which is significant, considering bird size (p < 0.0003). During the studied period, there was a decline in 1998, after a period of continuous increase, possibly due to environmental, nutritional or genetic problems. However, it recovered in 2002 and 2003, and then was reduced again due to the reduction in market age to supply the Middle East market.
DWG presented an annual average ±SD of 51.48 ± 0.69, with high reliability (R2 = 0.97; CV = 1.35%; p
< 0.0001 (Table 1). This characteristic is very important because it shows the effective development of broiler performance capacity.
Table 1 shows feed conversion ratio values of Brazilian broilers between 1990 and 2009. In 1992, the highest feed conversion ratio was recorded: 2.116 kg
Table 1 – Average body weight at 45.55 days (BW), average daily weight gain (DWG), feed conversion ratio (FCR Obs) and adjusted for 1,700 (FCR 1.7), 2,000 (FCR 2.0), and 2,500 g (FCR 2.5), production efficiency index (PEI) and mortality (Mort) of broilers between 1990 and 2009.
YEAR BW(g) DWG (g) FCR CFCR 1.7 CFCR 2.0 CFCR 2.5 PEI Mort (%)
1990 2060.8 45.13 2.058 1.955 2.041 2.181 206.29 5.97
1992 2092.9 45.96 2.116 2.004 2.090 2.234 201.90 7.52
1993 2146.2 47.15 2.045 1.918 2.003 2.146 216.35 6.27
1994 2181.9 47.85 2.026 1.888 1.974 2.116 222.09 5.97
1995 2187.1 47.96 2.019 1.879 1.966 2.108 224.48 5.52
1996 2221.1 48.76 1.994 1.845 1.931 2.074 232.35 5.22
1997 2244.6 49.28 1.971 1.815 1.901 2.043 236.59 5.43
1998 2233.4 49.03 1.968 1.815 1.901 2.043 235.66 5.42
1999 2379.8 52.19 1.941 1.746 1.832 1.975 256.99 4.40
2000 2425.9 53.12 1.941 1.734 1.819 1.961 261.03 4.48
2001 2435.0 53.46 1.898 1.688 1.774 1.916 269.62 3.89
2002 2418.9 53.38 1.869 1.663 1.751 1.892 273.64 4.32
2003 2410.9 53.02 1.889 1.686 1.772 1.914 268.74 3.99
2004 2480.9 54.60 1.879 1.656 1.742 1.884 279.12 3.99
2005 2481.2 54.68 1.862 1.638 1.724 1.867 280.58 4.32
2006 2545.3 56.23 1.859 1.617 1.702 1.845 288.74 4.65
2007 2539.5 55.91 1.845 1.605 1.690 1.835 288.42 4.62
2008 2623.6 57.78 1.827 1.561 1.648 1.790 301.89 4.44
2009 2643.6 58.66 1.839 1.567 1.655 1.797 306.84 3.94
Mean 2326.77±110 51.16±2.48 1.968±0.06 1.789±0.08 1.875±0.08 2.017±0.08 248.43±16.93 5.070±1.30
feed were required to produce 1 kg of body weight, after which It significantly decreased in 14.6 g annually (p < 0.0001), achieving 1.839 kg of feed to produce 1 kg body weight in 2009 (Table 1). There was a positive evolution in feed conversion ratio during the 20 years evaluated. This means that less feed is required, and this is very relevant in terms of costs, because feed accounts for 70% of the total live broiler production costs.
When feed conversion ratio was corrected for 1.7 kg and 2.5 kg market weight, it linearly decreased in 23.5 points per year during the studied period for both final weights, and explains 97.01%.
Production efficiency index showed consistent growth between 1990 and 2009 (Table 1). On the other hand, PEI was not influenced by geographic region. Although the production efficiency index is questioned by some farmers and poultry professionals, it is still frequently used as a reference to pay contracted farmers and to evaluate flock performance. For instance, a PEI of 300 means compensation to the farmer of about R$ 0.35, indicating that the flock presented the following results: 95.5% livability, 58 g DWG, and 1.83 FCR. Production cost for this PEI was US$ 0.11/kg. During the period evaluated in the present study, PEI increased in 101 points. This difference, however, can reach 150 points when considering the results of the best companies. The analysis of variance showed influence of year on mortality (Table 1). There was an impressive reduction from 5.97% in 1990 to 3.94% in 2009, representing a 2.03% reduction. Several factor contributed to this development, particularly reduction in the incidence of physiological disorders and diseases. From the 1970s until the end of the 1980s, chronic respiratory disease caused by Mycoplasma gallisepticum and complicated with E. coli, accounted for 9.5% mortality rates up to market age. In the 1990s, leucosis J was detected in broilers, further increasing mortality. This and other diseases were controlled, and mortality rates dropped to 4% in 2009, that is, there was a 2.03% reduction, stabilizing livability in 96.06%.
Also, physiological disorders, such as ascites and sudden death syndrome, as well as infectious bursal disease, increased mortality in 2000, but were controlled. Improvements in livability were obtained mainly by excellent biosecurity measures, vaccination programs against the main diseases, Mycoplasma gallisepticum control and the absence of Newcastle disease for more than 20 years in Brazilian broiler flocks.
FINAL CONSIDERATIONS
The follow-up of the live performance of Brazilian broilers between 1990 and 2009 showed that there was effective genetic improvement, although the results obtained in the field did not always match those presented in the genetic company tables. It was observed that, in the field, better or worse results are often obtained. In 1990, independently of region, genetic strain, or nutrition, Brazilian broilers needed 45 days to achieve 2.060 kg, whereas in 2009, this weight was achieved at 35.12 days. The consistency of results among the different geographic regions during the last few years is due to the rapid dissemination of management techniques among broiler companies.
Broiler strains genetically improved during that period to supply market demands. In 1990, 2.058 kg of feed were required to produce 1kg body weight, and this number decreased to 1.839 in 2009, showing a significant improvement in feed conversion ratio.
Feed intake reduction between 1990 and 2009 was 0.384 kg of feed per kg body weight. Considering a feed production of 10.9 million tons (UBA, 2009), this represents 4 million tons or 10% less feed, or savings of US$ 1.18 million annually for feed conversion ratio corrected for 2.5 kg body weight.
There is a mismatch between the data presented in the tables of the genetic company manuals and the performance results obtained in the field. There are two main reasons for this: either the manual is published for one generation of broilers and those reared already belong to the next generation, or table data are relative to a small experimental flock with excellent results, which may be better than those obtained on the farm.
The analyzed data showed a 0.384 kg reduction in feed intake to produce one kg body weight when data were adjusted for 2.5 kg average body weight. Also, annual average daily weight gain (DWG) was approximately 30 g, feed conversion ratio improved 0.01 point per year and mortality was reduced in 0.10% annually.
10 years, which was used to evaluate performance results between 1920 and 1940, is considered to long to compare the evolution of broiler productivity. Considering that every four years a new generation is completed and that a new generation is annually launched in the market, this study recorded and analyzed data per year.
The performance results of broilers during the studied year presented as determinant factors: genetic improvement, health control, and improvements in nutrition and rearing management.
REFERENCES
Arashiro O. A história da avicultura do Brasil. Porto Feliz: Gessulli; 1989. 301 p.
Froilano A. Manejo Final e da Retirada. Anais da 19ª Conferência Apinco de Ciência e Tecnologia Avícolas; 2001, Campinas, SP. Brasil: FACTA; 2001. 59-66 p.
Gonzales E. Produção avícola brasileira: evolução, situação atual e perspectiva. Botucatu. In press 1990.
Lesson S, Summers JD. Commercial poultry nutrition. 2nd ed. Guelph: University Books; 1997. 350 p.
Mendes AA, Garcia EA, Patricio IS. Desempenho e rendimento de carcaça de cinco linhagens comerciais de frangos de corte. Boletim Técnico Big Birds 1988; 1:1-10.
Mendonça ES, Michelan T. Formação e características das linhagens atuais de frango. Anais da 19ª Conferência Apinco de Ciência e Tecnologia Avícolas; 2001; Campinas, SP. Brasil: FACTA; 2001. 23-35 p.
Mendonça ES. Perspectivas do melhoramento genético do frango para o médio e longo prazo. Anais da Conferência Apinco de Ciência e Tecnologia Avícolas; 2008; Campinas, SP, Brasil: FACTA; 2008. p.401-405.
Mior LC. Agricultores Familiares, agroindústrias e redes de desenvolvimento rural. Chapecó: Argos; 2005. 338 p.
North MO. Commercial Chicken Prodution Manual. 3rd ed. Westport: The Avi Publishing Company; 1984. 710 p.
Oliveira MAO. Desempenho produtivo e econômico da codorna (Cotornix cotornix japonica) submetida a diferentes rações comerciais [dissertação]. Recife (PE): Universidade Federal Rural de Pernambuco; 1999. 77 p.
Patricio IS. Dezessete anos da avicultura brasileira. Revista Avicultura Brasileira 2007; 5: 35 -37.
Romanov MN, Sazon AA, Smirnov AF. First century of chicken gene study and mapping – a look back and forward. World`s Poultry Science Journal 2004; 60: 19-41.
Rostagno HS. Composição dos alimentos e exigências nutricionais: tabelas brasileiras para aves e suínos. Viçosa: Universidade Federal de Viçosa; 2005. 186 p.
SAS Statistical Analysis Sistems User`s Guide: Stat. Version 6.4. CARY; 1996. v.2.
Teeter YZ. Seminar on Nutrition for Tomorron. Foz del Yguazú; 2010. p.194.