http://dx.doi.org/10.1590/18069061-2015-0017
Production in Turkey
Author(s)
Tandoğan MI
Çiçek HI
I Afyon Kocatepe University, Faculty of
Veterinary Medicine, Department of Animal Health Economics and Management Afyonkarahisar/Turkey
Mail Address
Corresponding author e-mail address Murat Tandoğan
Afyon Kocatepe University, Faculty of Veterinary Medicine, Department of Animal Health Economics and Management
Afyonkarahisar - Turkey – 03100 Phone: (0090) 2722281312 Email: [email protected]
Keywords
Broiler production, cost analysis, technical performance, Turkey.
Submitted: February/2015 Approved: May/2015
ABSTRACT
In this study, the live performance and costs of broiler production was examined and cost analysis were assessed in the Balıkesir, Bolu and Sakarya Provinces, which are the most important broiler-producing regions of Turkey. Annual (years 2012-2013) production data of 125 broiler farms were analyzed. Farms were scaled according to the irrearing capacities as small (1-10,000 broilers), medium (10,001-30,000) and large (30,001 and above). Cost and performance differences among farm scales and research centers were tested by one-way analysis of variance. Average live weight (LW), livability (LA), slaughter age (SA), feed conversion ratio (FCR), and production efficiency factor (PEF) values were calculated as 2.436 ± 0.006 kg; 93.502 ± 0.133%; 42.293 ± 0.079 days; 1.805 ± 0.004 kg; 298.802 ± 1.298, respectively. Feed and chicks accounted for 80.3% of the total cost per kg live weight (TLWC). There were no statistical differences among farm scales and provinces in terms of technical indicators and production performance (p>0.05). Farm size affected the TLWC (p<0.05). The results showed that broiler production in Turkey achieved similar performance levels as the main global broiler-producing countries; however, the cost of producing 1 kg live weight is 13%-60%more expensive in Turkey.
INTRODUCTION
Pork still has the largest share of the global meat market. However, poultry meat has presented the fastest growth in terms of production potential. Poultry meat production was increased by 1,144% in the last 50 years. It is forecasted that poultry meat production will surpass pork and that this demand will be supplied by developing countries in the following years (Desouzard, 2013).
The USA, China, and Brazil account for 50% of the global broiler production. Turkey has a 2% share of this market, with an annual production of 1.8 million tons. The broiler industry has an annual turnover of USD 4.5 billion, while poultry meat exports accounts for USD656 million, with a 10-fold increase in the production volume in the last 23 years (USDA, 2014; BESD-BİR, 2014).
Turkey poultry production has good performance indices and revenues. However, it is dependent on two main inputs (feed raw materials and parent stock chicks) from abroad. This increases production costs and reduces the competitiveness of chicken meat prices. Argentina, the USA, and Brazil have the lowest feed and chick costs. In those countries, sufficient production of corn and soybean provides price advantage in these feedstuffs, reducing feed costs (Van Horne & Bondt, 2013).
as bio-diesel and ethanol energy sources and as of consequence of the drought in 2007 (Çınar, 2007). For example, global corn and soybean prices have increased 3-fold between 2000-2013 (IGC, 2014). As a result, poultry meat prices have increased by 92% over the last decade (FAO, 2014). These developments in costs and product prices have provided a competitive advantage to Turkey. Turkey’s chicken meat export has increased about 8-fold over the last six years and reached 5th place in global chicken meat trade
(BESD-BİR, 2014).
In Turkey, there is a poultry production integration model which implements the contract production. The basic inputs of the production (feed, chicks, vaccines-medicines, and veterinary services) are provided by the integrator, the other inputs (energy, labor, etc.) are paid by the producer. The integrator is responsible for processing and marketing (BESD-BİR, 2014).
Broiler meat production in Turkey is concentrated in certain areas (Marmara, Aegean, Central Anatolia and the Mediterranean) due to the proximity to major consumption centers, climate, geographical availability, and ease of transportation (Demirci, 2008). Some provinces are highlighted regarding production potential and number of farms: for example, the provinces of Balıkesir, Bolu and Sakarya account for 64% of the total production and have 47% of the total number of farms (TÜİK, 2014a).
There are some studies on technical and economic performance of the broiler industry in Turkey (Yeni, 2012; Yeni and Dağdemir, 2011; Alkurt, 2010 and Özgül, 2006). This study evaluated the technical performance and analyzed the costs of the broiler industry in the Provinces of Balıkesir, Bolu and Sakarya, which are the most important centers of the Turkish broiler industry. It is the first study that compared these results with those of the main broiler-producing countries.
MATERIALS AND METHODS
Data collection
Annual (2012-2013 years) production data of broiler farms in the Provinces of Balıkesir, Bolu and Sakarya were evaluated. Data were collected from the farmers using a face to face questionnaire performed during the research period. The production report of each production period was also used.
Determining the number of samples
A stratified random sampling method was used to determine the number of farms, according to the following formula (Yamane, 1967):
N x ∑N
hx S
h2n =
N
2x D
2+ ∑N
h
x S
h2where
n = number of samples
N = number of broilers per farm
N
h= the number of units on h
thscale
S
h= the standard deviation of h
thscale
S
h2= the variance of h
thscale
D
2= (d
2/ z
2); “d” indicates a specific rate
(5%) of deviation from the population mean (X =
16778.31), “z” indicate the z table value (1.96) at
95% confidence interval.
According to the calculation results, a sample number of n = 100.71 was found and the total number of farm was identified as 125 by adding in the number of backup sample.
The farms were scaled according to the capacity as small (1-10000), medium (10001-30000) and large (30001 and above).
Measurement of production performance
Live weight (LW), livability (LA), slaughter age (SA) and feed conversion ratio (FCR) were accepted such as technical indicators of production, and production efficiency (PEF) was calculated with the following formula (Marcu et al., 2013):
LW (kg) x LA (%)
PEF = --- x 100 SA (days) x FCR (kg)
where;
LW (kg) = Live weight at the end of the rearing period,
LA (%) = Livability (number of birds alive at the end of the rearing period relative to the number of chicks placed),
SA (days) = Slaughter age of chicks,
FCR (kg) = Cumulative feed intake (kg) / total weight gain (kg).
Cost analysis
The following equations were used for farm cost calculations (Yeni, 2012). The values were calculated in Euro (€) for cost and price comparison among countries (1€ = 2.3282 Turkish Lira-TL):
other (cleaning and disinfection + litter + transport + other),
TFC (eurocents/kg LW): total fixed costs; labor + housing (maintenance and repair + general management,
TLWC (eurocents/kg LW): Total live weight cost; TVC + TFC.
Cost differences among farm scales and provinces (Kaps & Lamberson, 2004) were tested by one-way analysis of variance.
RESULTS
During the inspection period, there were 660 production cycles in 125 farms, a total of 13.9 million broilers were produced, and about 32,000 tons of LW were obtained. Relative to genetic strains, 54.4% Ross, 22.4% Cobb, 20.8% Ross+Cobb and 2.4% Hubbard hybrid broilers were reared. Performance results are presented according to farm scale and province in Tables 1 and 2, respectively.
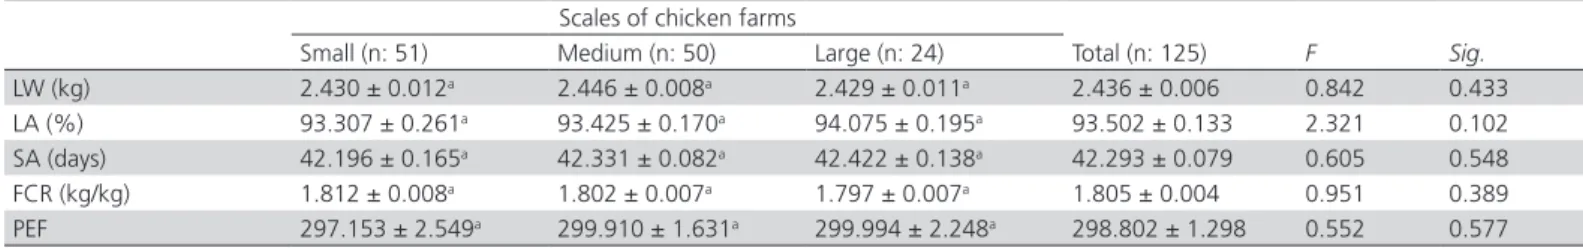
Table 1 – Technical indicators and production performance according to scales of chicken farms Scales of chicken farms
Total (n: 125) F Sig.
Small (n: 51) Medium (n: 50) Large (n: 24)
LW (kg) 2.430 ± 0.012a 2.446 ± 0.008a 2.429 ± 0.011a 2.436 ± 0.006 0.842 0.433
LA (%) 93.307 ± 0.261a 93.425 ± 0.170a 94.075 ± 0.195a 93.502 ± 0.133 2.321 0.102
SA (days) 42.196 ± 0.165a 42.331 ± 0.082a 42.422 ± 0.138a 42.293 ± 0.079 0.605 0.548
FCR (kg/kg) 1.812 ± 0.008a 1.802 ± 0.007a 1.797 ± 0.007a 1.805 ± 0.004 0.951 0.389
PEF 297.153 ± 2.549a 299.910 ± 1.631a 299.994 ± 2.248a 298.802 ± 1.298 0.552 0.577
LW: live weight; LA: livability; SA: slaughter age; FCR: feed conversion ratio; PEF: production efficiency factor. a means with the same superscripts in the same row are not different (p>0.05).
Table 2 – Technical indicators and production performance according to province Provinces
Total (n: 125) F Sig.
Balıkesir (n: 25) Bolu (n: 69) Sakarya (n: 31)
LW (kg) 2.446 ± 0.012ab 2.445 ± 0.007b 2.410 ± 0.016a 2.436 ± 0.006 3.188 0.045
LA (%) 93.770 ± 0.277a 93.371 ± 0.149a 93.578 ± 0.362a 93.502 ± 0.133 0.710 0.494
SA (days) 42.225 ± 0.152a 42.376 ± 0.077a 42.165 ± 0.242a 42.293 ± 0.079 0.695 0.501
FCR (kg) 1.796 ± 0.005a 1.810 ± 0.006a 1.801 ± 0.012a 1.805 ± 0.004 0.902 0.408
PEF 302.571 ± 1.969a 297.942 ± 1.641a 297.675 ± 3.392a 298.802 ± 1.298 1.059 0.350
LW: live weight; LA: livability; SA: slaughter age; FCR: feed conversion ratio; PEF: production efficiency factor. a, b, c means with the same superscripts in the same row are different (p<0,05).
Table 3 – Costs of broiler production according to farm scale (eurocents/kg LW) Farm scale
Total (n: 125) F Sig.
Small (n: 51) Medium (n: 50) Large (n: 24) TVC
Day old chicks 15.0±0.001a 14.5±0.001b 14.7±0.002ab 14.8±0.001 4.651 0.011
Feed 70.2±0.005a 71.7±0.004b 71.8±0.006ab 71.1±0.003 3.633 0.029
Veterinary and medicine 1.7±0.000a 1.7±0.000a 1.7±0.000a 1.7±0.000 0.613 0.543
Energy 5.9±0.003a 4.9±0.001b 4.4±0.001b 5.2±0.001 10.373 0.000
Other 7.5±0.002a 6.8±0.001b 6.6±0.001b 7.0±0.001 14.283 0.000
TFC
Labor 2.3±0.001a 1.3±0.001b 1.1±0.001b 1.7±0.001 46.614 0.000
Housing + general management 5.8±0.001a 5.3±0.001b 5.0±0.001b 5.5±0.001 10.635 0.000
TLWC (TVC+TFC) 108.4±0.004a 106.4±0.005b 105.2±0.007b 107.0±0.003 9.172 0.000
TVC: total variable costs; TFC: total fixed costs; TLWC: total live weight costs. a, b means with the same superscripts on the same row are different (p<0.05).
Production performance parameters were not significantly different among farm scales or provinces (p>0.05), except for LW among provinces, in which Sakarya province produced lighter birds compared with Bolu (p<0.05).
However, no significant difference between medium – and large – scale farms was found in terms of producer’s input costs or TLWC (p>0.05).
Likewise, there were no statistical TLWC differences among provinces (p>0.05) (Table4).
Table 4 – Costs of broiler production according to province (eurocents/kg LW) Provinces
Total
(n: 125) F Sig.
Balıkesir (n: 25)
Bolu (n: 69)
Sakarya (n: 31) TVC
Day old chicks 14.2±0.001a 14.9±0.001b 14.9±0.001b 14.8±0.001 7.873 0.001
Feed 73.0±0.005a 70.7±0.004b 70.5±0.004b 71.1±0.003 6.110 0.003
Veterinary and medicine 1.6±0.000a 1.7±0.000a 1.8±0.000b 1.7±0.000 9.107 0.000
Energy 4.8±0.002ab 5.6±0.002b 4.7±0.002a 5.2±0.001 4.943 0.009
Other 7.0±0.001a 7.2±0.001a 6.8±0.001a 7.0±0.001 2.539 0.083
TFC
Labor 1.4±0.001a 1.7±0.001a 1.8±0.001a 1.7±0.001 2.750 0.068
Housing + general management 5.0±0.002a 5.5±0.001b 5.8±0.001b 5.5±0.001 9.464 0.000
TLWC (TVC+TFC) 107.0±0.006a 107.3±0.004a 106.2±0.006a 107.0±0.003 0.994 0.373
TVC: total variable costs; TFC: total fixed costs; TLWC: total live weight costs. a, b, c means with the same superscripts on the same row are different (p<0.05).
DISCUSSION
The goal of commercial broiler production is to achieve optimal slaughter weight at maximum profitability. The average slaughter age in the surveyed area (42.293 days) determined in the present study indicates that good profitability can be obtained. In two studies related to this subject, optimal SA was reported as about 41 days (Dağdemir et. al., 2007) for Cobb hybrids, and 40 days for Hubbard male hybrids (Samarakoon & Samarasinghe, 2012).
The calculated LW (2.436 kg) and FCR (1.805 kg) shows the broiler production in Turkey achieved similar technical performance of that of major broiler-producing countries, and even better than other countries. Table shows performance parameter values and costs in some countries (Van Horne & Bondt, 2013).
Table 5 – Prices and technical performance of broiler production in some countries
EU USA THA BRA ARG RUS UKR LW (kg) 2.276 2.500 2.300 2.625 2.600 2.100 2.480 FCR (kg) 1.76 1.93 1.75 1.79 1.95 1.80 1.81 Feed price
(eurocents / kg) 34.5 25.7 32.9 26.5 23.1 33.9 28.0 Day old chick
(eurocents) 32.2 19.6 28.0 27.0 24.0 32.3 26.0
EU: European Union; USA: United States of America; THA: Thailand; BRA: Brazil; ARG: Argentina; RUS: Russia; UKR: Ukraine
Broiler integrators and farmers around the world commonly use PEF as a performance indicator (Shane, 2013). In one study, PEF was calculated as 346 for
42-d-old Ross hybrids and as 376 for Cobb hybrids (Marcu et al., 2013). The performance of those hybrids, in terms of LW (2.598-2.648), LA (99-100) and FCR (1.770-1.676), is not much better than that determined in the present study. Therefore, it can be said that PEF value is adequate in this study (298.8).
The lack of performance differences among farm scales and provinces may be explained by the integration model. The farms included in this study had contracts with eight integrators. The integrators inspect production continuously, with no distinction of farm scale or production region. Also, the supply of feeds of the same quality and proper management applied by the farmers may have affected this situation.
The 93.3% share of TLWC is due to variable inputs, with a significant contribution (80.3%) of feed and day-old chicks. Considering that the production cost of a country determines its world trade potential, Turkey’s competitiveness seems to be low (Table 6) (Van Horne & Bondt, 2013).
Table 6 – Costs of broiler production in some countries (eurocents / kg LW)
Cost elements EU USA THA BRA ARG RUS UKR Day old chicks 14.9 8.2 12.8 10.7 9.8 16.3 11.0 Feed 60.8 49.5 57.6 47.5 45.0 61.1 50.7 Other 7.9 5.5 5.7 2.8 4.1 8.0 5.3 Labor 3.4 2.7 1.2 2.7 2.2 0.7 0.5 Housing 6.4 3.5 4.9 3.7 5.2 4.9 5.9 General 1.0 0.9 0.6 0.5 0.6 0.6 0.5 Total LW costs 94.6 70.3 82.8 67.9 66.8 91.6 73.9
Considering the costs of different countries in Table 6, the cost of producing 1 kg of LW is between 13%-60% more expensive in Turkey. Similarly to Turkey, feed and day-old chicks account for 80-86% of the total costs in those countries, but the cost of feed per kg of LW is 16%-58% higher and the cost of chicks per kg LW (except for the EU and RUS) is 16%-80% higher in Turkey compared with the other countries. The main reasons of these differences are the higher feed prices (39.4 eurocents / kg) or 14%-71% more expensive, and chick prices (33.6 eurocents / chicken) or 4%-71% more expensive that the mentioned countries.
This higher production costs are due to the fact that Turkey imports feed raw materials (corn, soybean, vitamins, minerals and premixes) and parent stock chicks from abroad. About 25-35% of the corn, 90% of the soybeans, and all of the parent stock chicks are imported due to insufficient domestic production (Eşidir & Pirim, 2013; Sarıca et al., 2012).
Labor costs identified in this study are lower than in the European Union, America, Brazil, and Argentina, may be a result of the lower wages and insurance policies. In the European Union, the social security system and high employees’ wage have a strong effect on labor costs (Van Horne & Bondt, 2013).
Turkey has significant disadvantages compared with the other countries in terms of energy, broiler health, and other costs. The main reasons are that Turkey imports a significant share of the required vaccines and drugs inputs (Daştan, 2010), and the energy price changes over the years. During the last 13 years, the prices of electricity, coal, wood, and fuel increased about 620-909%, (TÜİK, 2014b).
As detected in the present study, farmers do not have control of the inputs supplied by the integrators (feed, day-old chick, and drugs), and therefore, farms of all the three evaluated scales presented a similar base cost. Increasing farm scale, however, reduced the costs of other inputs. In particular, medium and large farms cost less than the small ones. This reflected in the cost of total body weight.
CONCLUSIONS
The results showed that broiler production in Turkey achieved similar performance levels as the main global broiler-producing countries. Broiler production is completely vertically integrated, with the integrator providing the basic inputs (feed raw materials, parent stock chicks), which are imported, increasing the production costs. Unless Turkey reduces its international
dependence on those inputs, it will not be able to increase its share in world trade of chicken meat in the short term. For instance, while Brazil (the world’s largest exporter) exports 31% of its production to 150 countries, Turkey exports only 17% of its production to 11 countries (Junior & Bruno, 2013; BESD-BİR, 2014).
Considering the scope of this study, the findings maybe extended to the broiler production in Turkey. Further studies on the other stages (slaughter and marketing) need to be conducted to evaluate the entire Turkish broiler industry.
ACKNOWLEDGEMENTS
This study was obtained from Murat TANDOĞAN’s doctoral thesis. This research was supported by a grant from Afyon Kocatepe University, Scientific Research Coordination Unit, Afyonkarahisar, Turkey (Project no: 11.SAĞ.BİL.01).
REFERENCES
Alkurt, K. Bolu İli ve İlçeleri etlik piliç üretim işletmelerinde üretim dönemleri arasındaki maliyet unsurlarının incelenmesi [dissertation]. Bolu: Abant
İzzet Baysal Üniversitesi, Sosyal Bilimler Enstitüsü; 2010.
BESD-BİR. Piliç eti sektör raporu (üretim, tüketim, dış ticaret, sorunlar, görüşler). Ankara: Beyaz Et Sanayicileri ve Damızlıkçıları Birliği; 2014.
Çınar H. Kanatlı eti ve yumurta. TEAE Bakış 2007;9:14.
Dağdemir V, Demir O, Macit M. Estimation of optimum fattening period in broilers. Journal of Applied Animal Research 2007;31:159-160.
Daştan Z. Kanatlı eti üretiminde sorunlar ve beklentiler. Proceedings of the Kümes Hayvanları Kongresi; 2010 Oct 7-9; Kayseri; 2010.
Demirci Ö. Ankara’da faaliyet gösteren kimi broyler entegrasyonlarının piliç eti ürünleri pazarlama stratejilerinin piliç eti fiyatları üzerine etkisi [dissertation]. Ankara: Ankara Üniversitesi, Sağlık Bilimleri Enstitüsü; 2008.
Desouzard O. Dünya tavuk eti ticareti; zorluklar, gelişmeler ve stratejiler. II. Proceedings of the Uluslar arası Beyaz et Kongresi; 2013. Antalya; 2013.
Eşidir A, Pirim L. Kanatlı hayvancılık sektör raporu. Fırat Kalkınma Ajansı. 2013 [cited 2013 Dec 11]. Available from: http:// w w w. f k a . o r g . t r / C o n t e n t D o w n l o a d / K a n a t l % C 4 % B 1 % 2 0 Hayvanc%C4%B1l%C4%B1k%20Sekt%C3%B6r%20Raporu.pdf.
FAO. International meat price indices. 2014 [cited 2014 Feb 18]. Available from: http://www.fao.org/fileadmin/templates/est/COMM_MARKETS_ MONITORING/Meat/Documents/Revised_Meat_prices__graphs_and_ tables_2014_NEW_INDEX.pdf.
IGC – Grais and Oilseeds Index. International Grains Council. 2014 [cited 2014 Feb 06]. Available from: http://www.igc.int/en/grainsupdate/ igcgoi.aspx.
Kaps M, Lamberson, W. Biostatistics for animal science. Wallingford: CABI Publishing; 2004.
Marcu A, Vacaru-Opriş I, Dumitrescu G, Ciochina LP, Marcu A, Nicula M, et al. The influence of genetics on economic efficiency of broiler chickens growth. Animal Science and Biotechnologies 2013;46(2):339-346.
Özgül N. Bolu İli Göynük İlçesi etlik piliç üretimi, örgütlenme yapısı, sosyo-ekonomik boyutu ve ilçe halkına katkıları [dissertation]. Edirne: Trakya Üniversitesi, Fen Bilimleri Enstitüsü, Edirne; 2006.
Samarakoon SMR, Samarasinghe K. Strategies to improve the cost effectiveness of broiler production. Tropical Agricultural Research 2012;23(4):338-346.
Sarıca M, Camcı Ö, Mızrak C, Akbay R, Türkoğlu M, Yamak US. Türkiye’de kanatlı ıslah stratejilerine bakış. Proceedings of the Ulusal Kümes Hayvanları Kongresi, 2012 Oct 3-5; İzmir; 2012.
Shane S. What’s your “pef”. 2013 [cited 2013 Sep 22]. Available from: http:// www.datapoul.co.uk/wp-content/uploads/ProductionEfficiencyFactor. pdf.
TÜİK - Turkish Statistical Institute. Kümes hayvanları kesilen sayısı ve et miktarı. 2014a [cited 2014 Jan 02]. Available from: http://www.tuik. gov.tr/PreTablo.do?alt_id=1002.
TÜİK - Turkish Statistical Institute. Tüketici fiyatları endeksi (TÜFE), madde fiyatları. 2014b [cited 2014 Jan 02]. Available from: http://tuikapp.tuik. gov.tr/tufedagitimapp/.
USDA - United States Department of Agriculture. Livestock and poultry: world markets and trade. Foreign Agricultural Service; 2014 [cited 2014 Dec 18]. Available from: http://apps.fas.usda.gov/psdonline/ circulars/livestock_poultry.pdf.
Van Horne PLM, Bondt N. Competitiveness of the EU poultry meat sector. LEI Report 2013-068, 65 p. 2013
Yamane T. Statistics: an introductory analysis. 2nd ed. New York: Harper and Row; 1967.
Yeni A. Türkiye broyler sektöründe üretim kümeslerinin ekonomik yapısı ve etkinlik analizi: Doğu Marmara Bölgesi örneği [thesis]. Erzurum: Atatürk Üniversitesi, Fen Bilimleri Enstitüsü; 2012.