PEDOTRANSFER FUNCTIONS TO ESTIMATE PROCTOR
TEST PARAMETERS UNDER DIFFERENT TILLAGE
SYSTEMS
(1)Carina Rosa Álvarez(2), Federico Guillermo Micucci(3), Carolina Bustingorri(2) & Miguel Angel Taboada(2, 4)
SUMMARY
The Proctor test is time-consuming and requires sampling of several kilograms of soil. Proctor test parameters were predicted in Mollisols, Entisols and Vertisols of the Pampean region of Argentina under different management systems. They were estimated from a minimum number of readily available soil properties (soil texture, total organic C) and management (training data set; n = 73). The results were used to generate a soil compaction susceptibility model, which was subsequently validated using a second group of independent data (test data set; n = 24). Soil maximum bulk density was estimated as follows: Maximum bulk density (Mg m-3) = 1.4756 - 0.00599 total organic C (g kg-1) + 0.0000275 sand (g kg-1)
+ 0.0539 management. Management was equal to 0 for uncropped and untilled soils and 1 for conventionally tilled soils. The established models predicted the Proctor test parameters reasonably well, based on readily available soil properties. Tillage systems induced changes in the maximum bulk density regardless of total organic matter content or soil texture. The lower maximum apparent bulk density values under no-tillage require a revision of the relative compaction thresholds for different no-tillage crops.
Index terms: soil organic carbon, soil compaction, soil texture.
(1) Received for publication in January 2010 and approved in October 2010.
(2) Cátedra de Fertilidad y Fertilizantes; Facultad de Agronomía; Universidad de Buenos Aires. Av. San Martín 4453; C1417DSE; Ciudad Autónoma de Buenos Aires, Argentina. E-mail: [email protected]
(3) Merk Crop Bioscience Argentina S.A.
(4) Instituto de Suelos, INTA, Castelar, CONICET.
RESUMO: FUNÇÕES DE PEDOTRANSFERÊNCIA PARA ESTIMAR PARÂMETROS DA PROVA DE PROCTOR SOB DIFERENTES
SISTEMAS DE PREPARO DE SOLO
A prova de Proctor consome tempo e requer a amostragem de grande quantidade de solo. Neste estudo, os parâmetros da prova de Proctor foram preditos em Molisols, Entisols e Vertisols da região do Pampa Argentino sob diferentes manejos. Para isso, partiu-se de um número mínimo de propriedades do solo facilmente disponíveis, como textura do solo e teor de matéria orgânica, e do manejo adotado. Os resultados foram usados para gerar um modelo de suscetibilidade, que foi logo validado utilizando um segundo grupo de dados independentes. O manejo foi igual a 0 para os solos não trabalhados e sob plantio direto e 1 para os solos manejados sob plantio convencional. Os modelos obtidos predisseram razoavelmente os parâmetros da prova de Proctor partindo de propriedades do solo facilmente disponíveis. Os sistemas de preparo induziram mudanças na máxima densidade aparente apesar dos conteúdos de matéria orgânica e textura do solo. Os menores valores máximos de densidade aparente do solo obtido sob plantio direto tornam necessária uma revisão dos limites de compactação relativa para diferentes cultivos manejados com plantio direto.
Termos de indexação: carbono orgânico do solo, compactação do solo, textura do solo.
INTRODUCTION
Intensive agriculture has resulted in excessive and often deep-reaching soil compaction in many fertile lands around the world (Gupta & Almaras, 1987; Taboada et al., 1998; Lipiec & Hatano, 2003; Hamza & Anderson, 2005; Álvarez et al., 2009). Repeated passing of tractors and other heavy equipment for seedbed preparation, sowing, crop protection and harvesting operations has led to unprecedented levels of soil compaction (Gupta & Allmaras, 1987). The impact is greatest when the soil is wet and/or high-pressure tires are used with heavy equipment (Botta et al., 2004; Hamza & Anderson, 2005). Soil susceptibility to compaction is a function of different inherent soil properties, e.g., organic C content, texture class, and mineralogy, among others (Gupta & Allmaras, 1987). The risk of excessive soil compaction can be predicted in the laboratory by generating Proctor parameters in compactability tests (ASTM, 1982). This standardized soil engineering procedure determines how bulk density is affected by the water content in response to standardized energy input and compaction procedure (Mueller et al., 2003). The main parameters derived from a Proctor or compaction test include soil maximum bulk density (MAXBD), critical water content (CWC) and soil compaction susceptibility. Soil MAXBD may be used as a reference value to estimate the relative compaction of a soil (Carter, 1990; Beutler et al., 2005). Soil MAXBD is reached at a specific critical water content. Generally, both MAXBD and CWC are related to the soil texture class, determined by the proportion of clay, silt and sand particles in the soil. However, soil total organic C content (TOC) is most closely correlated
with MAXBD and CWC in Pampas soils (Díaz Zorita & Grosso, 2000; Aragón et al., 2000).
MATERIALS AND METHODS
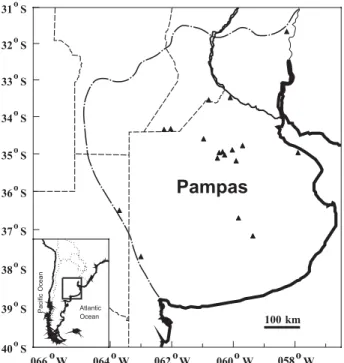
This study was conducted in the Pampas region of Argentina, which is a vast plain covering approximately 60 million ha of soil derived from aeolian (loess-like) sediments under grassland vegetation (Soriano et al., 1991). Mean annual precipitation varies from 1000 mm in the East to 600 mm in the Western part of the region. In the Southwest, the soil texture of the topsoil is loamy sand and of the A horizon silty loam and silty clay loam, while a strong Bt horizon was observed in the Northeast (Salazar Lea Plaza & Moscatelli, 1989).
The data analyzed in this study consisted of the field data recorded in this study (62 cases) and others taken from previous studies in the region (Kruger, 1996; Aragón et al., 2000). Soils were largely Mollisols (Typic, Abruptic and Vertic Argiudolls; Typic and Entic Hapludolls) and a smaller proportion of Entisols and Vertisols (Figure 1). The management systems included uncropped sites (pastures, reforestation and ornamental parks) and agricultural sites under CT and NT tillage systems. The CT soils were managed under disk, chisel or plow tillage and after seeding, weeds were mechanically (rotary harrow and row cultivator) and chemically controlled. No-tillage planters were used for NT and weeds controlled with herbicides. At each site, the following data were determined: total soil organic C (TOC) by the Walkley and Black method (Walkley & Black, 1965), and particle size distribution by the pipette method (Gee
& Or, 2002). Depending on the data origin, topsoil samples were taken from the 0–0.10 or 0–0.20 m layer. Furthermore, each specific management system was assessed. All soil samples were subjected to a compaction test (Proctor test) in the laboratory, as proposed by the “American Society for Testing Materials” standard method (ASTM, 1982). Approximately 3 kg of dry and disturbed soil sub-samples were moistened to reach a range of different water contents. Each moistened sub-sample was compacted in three layers in a compaction chamber (943 cm3). Each layer was exposed to 25 impacts of a
hammer (2.5 kg) falling from a height of 30.5 cm. Water content and bulk density were determined after oven-drying of the moistened and compacted soil samples at 105 ºC. MAXBD (Mg m-3) and CWC (g kg-1)
indexes were calculated by plotting the water content-bulk density relationship.
The entire dataset was randomly divided into two groups to form two independent datasets: a training set (n =73) and a test data set (n =24). The training data set was used to construct different MAXBD and CWC soil compaction predictive models, using soil variables that are easily determined in routine soil survey laboratories. The test data setwas used to validate the models developed with the training set. The associations between soil properties were evaluated using simple and multiple regressions (stepwise method) (Neter & Wasserman, 1974). Additionally, it was tested if the introduction of a dummy variable (qualitative - related to management systems) would contribute to the fitness of the multiple regression model. Two different groupings were tested: uncropped vs cropped (CT and NT) and uncropped/NT vs CT. Values of 0 were assigned to uncropped and uncropped/NT and 1 to cropped and CT. Finally, the model was validated when the intercept of the linear regression between predicted and measured values was 0 and the slope 1.
RESULTS
The mean, range and standard errors of soil properties used to develop the models (training set) are shown in table 1. A wide variation in soil properties was observed, with maximum values consistently 5.6–10 times greater than minimum values. Clay content varied from 61 to 429 g kg-1, sand
from 73 to 773 g kg-1, and TOC from 5.73 to 61.28 g kg-1.
The training data set included 14 uncropped soils and 21 soils under CT and 38 under NT.
The MAXBD values varied widely (1.14–1.76 Mg m-3),
similarly to the CWC values (150–431 g kg-1). A negative
significant relationship was found between MAXBD and CWC:
CWC (g kg-1) = 845–409 MAXBD (Mg m-3);
R2 = 0.717, p < 0.0001, n = 73
where MAXBD represents the Proctor test maximum bulk density, and CWC the critical water content at MAXBD.
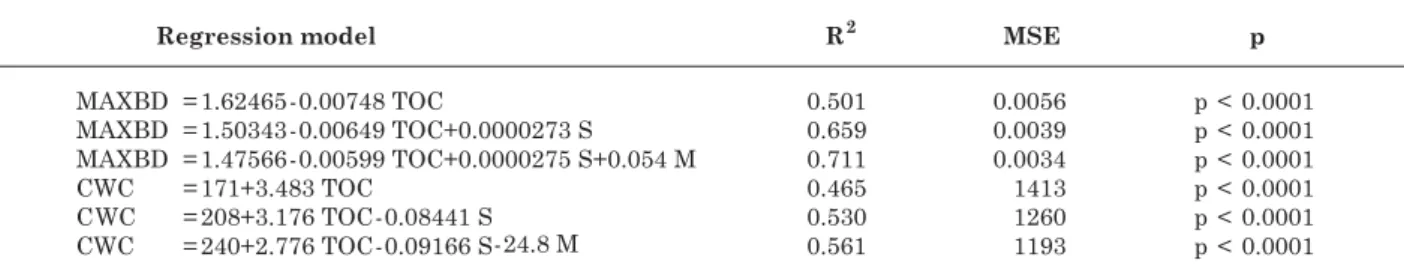
Different models were adjusted to predict the Proctor test parameters (Table 2). For soil MAXBD, the simplest model included TOC as the only predicting variable. Soil TOC explained approximately half the variation in MAXBD (R2 = 0.501). The R2 coefficient
increased 15.8 % with the addition of sand content as a second independent variable in the model. A more complex model was obtained by including a dummy as a third independent variable. The dummy variable distinguished uncropped and untilled soils (dummy value = 0) from CT soils (dummy value = 1). This model explained nearly 70 % of the variation in MAXBD (R2 = 0.711). The same independent
variables were included to predict soil CWC, but with opposing signs. However, a lower adjustment was obtained for CWC because only half the CWC variation
(R2 = 0.561) was explained when three independent
variables were included in the model.
The range of variation, means and minimum square errors of the selected soil properties were used to validate the predictive models (Table 3). The test data set consisted of 24 entries: two uncropped, six CT and 16 NT soils.
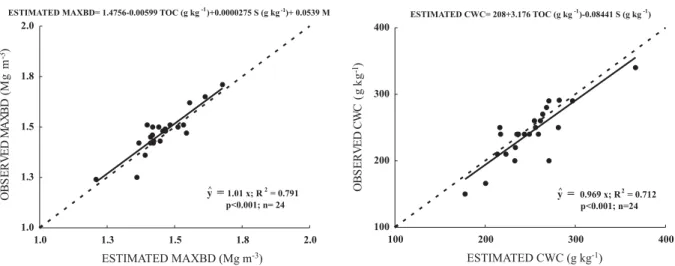
The estimated and observed values for all models were adjusted (Table 4). The fit to the line intercept did not differ from 0 and the slopes did not deviate from 1. Adjustments in the test data set had even higher R2 coefficients and lower mean standard error
– MSE values than those in the training set(Tables 2 and 4). These results indicated that the proposed models predicted Proctor test parameters reasonably well in the studied soils. The best MAXBD predictive model included three variables (Figure 2). In the case of CWC, the dummy variable “soil management” was dropped from the model on the basis of the calculated R2 coefficients and MSE values. The best fit was
obtained when soil TOC and sand content were included.
Table 3. Mean, maximum, minimum and mean standard error (MSE) values for the test data set. TOC: total organic carbon; MAXBD: maximum bulk density by Proctor Test; CWC: critical water content at which MAXBD was reached. Number of cases = 24
Table 1. Mean, maximum, minimum and mean standard error (MSE) values of the training data set. TOC: total organic carbon; MAXBD: maximum bulk density by Proctor Test; CWC: critical water content at which MAXBD was reached. Number of cases = 73
MSE is mean standard error.
Table 2. Linear regression models obtained with the training data set. MAXBD: maximum bulk density by Proctor Test (Mg m-3); CWC: critical water content at which MAXBD was reached (g kg-1); TOC: Total
organic carbon (g kg-1); S: sand content (g kg-1); M: soil management, dummy variable. M = 0 for pasture,
region (Quiroga et al., 1999; Aragón et al., 2000; Diaz Zorita & Grosso, 2000) and elsewhere (Wagner et al., 1994; Thomas et al., 1996; Braida et al., 2006). TOC acts as a shock absorber, resulting in the dissipation of part of the energy applied to soil in the Proctor test. It also contributes to the following processes: binding forces between particles and within aggregates, bonding, friction and dilution (Soane, 1990; Braida et al., 2006). These are the main reasons that explain the reduction of MAXBD as TOC increases. The reduction of MAXBD per unit increase in TOC (g kg-1)
was 0.00748 Mg m-3 for our training set. This result
is similar to Quiroga et al. (1999), but 50 % lower than Thomas et al. (1996) and Wagner et al. (1994)
DISCUSSION
The surface texture of the soils in the Pampas region varies extensively. This is a consequence of the distribution of the original sediments, gradually changing from coarse to finer texture from Southwest to Northeast (Díaz Zorita et al., 2002; Álvarez et al., 2009). The studied sites can be considered a good representation of all texture groups found in the region (Tables 1 and 3). Soil TOC was the single independent variable that best predicted MAXBD in regression model fitted for the training set (Table 2), and later validated with the test data set (Table 4). These results are consistent with previous studies in the Pampas
Figure 2. Relationships between observed and estimated values of maximum bulk density (MAXBD) and critical water content (CWC) using the test data set using the models that showed the best performance with the test dataset. MAXBD: maximum bulk density by Proctor Test; CWC: critical water content at which MAXBD was reached; TOC: Total organic carbon; S: sand content; M: soil management, dummy variable. M = 0 for pasture, forest, parks and no-tillage systems and M =1 for soils under tillage. Table 4. Validation of the different models presented in table 2 using an independent test data set.
Adjustments between estimated and observed maximum bulk density (MAXBD) and critical water content (CWC). MAXBD: maximum bulk density by Proctor Test (Mg m-3); CWC: critical water content at which MAXBD was reached (g kg-1); TOC: Total organic carbon (g kg-1); S: sand content (g kg-1); M:
soil management, dummy variable. M = 0 for pasture, forest, parks and no-tillage areas and M =1 for soils under tillage. Number of cases = 24
reported. This suggests that the impact of TOC on soil compaction may differ regionally, depending on other soil variables (Aragón et al. 2000; Braida et al., 2006) or management (Quiroga et al., 1999). This study demonstrated that soil texture fractions was the second independent variable that best predicted MAXBD. This result confirms those obtained by Aragón et al. (2000) and Diaz Zorita & Grosso (2000). However, our study indicated that sand fractions best described the variation in both MAXBD and CWC. Former studies reported silt content (Pecorari et al., 1993; Aragón et al., 2000), or silt or sand (Díaz Zorita & Grosso, 2000) as the best estimators for Pampas soils. In African soils, Nhantumbo & Cambule (2006) found that MAXBD variation was largely associated with changes in clay or silt plus clay content.
The inclusion of soil management as a dummy variable made the predictive model more robust. This result indicated that with the same amount of energy applied in the Proctor test, MAXBD values were higher in CT than uncropped and NT areas, despite the TOC and sand contents. This might be due to the higher instability of soil structure in CT than in uncropped and NT soils. Alvarez et al. (2009) found that the soil structural instability in CT was 62 % higher than in uncropped and NT soils. Soil structural instability is one of the most sensitive soil variables to management changes. Generally, slight differences in TOC content may be found between NT and CT soils, along with wide variations in structural instability (Alvarez & Steinbach, 2009; Alvarez et al., 2009). A soil with high structural stability better resists applied compressive energy, resulting in lower MAXBD values (Dexter, 1975).
MAXBD has been used as reference bulk density value to calculate relative soil compaction (RC; RC = (field bulk density / MAXBD) 100). Carter (1990) and Beultler et al. (2005) investigated the relationship between RC and potential crop yield in tilled soils and found that optimum crop growth was reached at a RC range of 75–83 % and that values exceeding 90 % affected crops negatively. In the Pampas region, the RC values ranged from 60 to 83 % under different tillage managements (Micucci & Taboada, 2006). However, considering that MAXBD values in uncropped and NT soils are lower, the actual bulk density can easily surpass the RC threshold, resulting in an overestimation of crop yield losses. Therefore, Reichert et al. (2009) proposed higher thresholds of RC for NT soils. Future research is needed to determined the optimum RC values for tilled and untilled soils in the Pampas region, where more than half the soils are cultivated under continuous NT (Díaz Zorita et al., 2002; Álvarez et al., 2009).
Typically, soil MAXBD is negatively associated with CWC (Quiroga et al., 1999; Aragón et al., 2000), which explains why the variability in both parameters was predicted by the same variables, TOC and sand
content (Tables 2 and 4). Aragón et al. (2000) found that CWC values close to saturation were highest (74– 97 %) in fine-textured soils or soils with a higher TOC content. Mueller et al. (2003) found that maximum soil water content for optimum workability was equal to CWC in both cohesive and non-cohesive soils. Consequently, soil CWC is an important parameter of soil trafficability, because the risk of compaction is greatest when water content approaches CWC (Gupta & Allmaras, 1987).
CONCLUSIONS
The present study successfully predicted Proctor test parameters (soil maximum bulk density and critical water content) in Mollisols, Entisols, and Vertisols under different tillage management systems. Predictions can be based on routine soil analysis or data available in soil surveys, e.g., total organic C and sand content. Predictions are more accurate if soil management is included in the model as a dummy variable. Maximum bulk density values were higher in conventionally tilled than in uncropped and untilled areas, regardless of the total organic C and sand contents. This study presents new information on the behavior of no-tillage soils under mechanical stress. Soil compaction can be avoided either by reducing traffic or increasing soil resistance to applied loads. Consequently, soil organic matter and no-tillage reduce maximum bulk density. Besides, farmers should avoid soil traffic when soil reaches maximum bulk density at the critical water content.
LITERATURE CITED
ÁLVAREZ, C.R.; TABOADA, M.A.; GUTIÉRREZ BOEM, F.H.; BONO, A.; FERNÁNDEZ, P.L. & PRYSTUPA, P. Topsoil properties as affected by tillage systems in the Rolling Pampa region of Argentina. Soil Sci. Soc. Am. J., 73:242-1250, 2009.
ALVAREZ, R. & STEINBACH, H.S. A review of the effects of tillage systems on some soil physical properties, water content, nitrate availability and crops yield in the Argentine Pampas. Soil Till. Res., 104:1-15, 2009. ARAGÓN, A.; GARCÍA, M.G.; FILGUEIRA, R.R. &
PACHEPSKY, Y.A. Maximum compactibility of Argentina soils from the Proctor test: The relationship with organic carbon and water content. Soil Till. Res., 56:197-204, 2000. ASTM. Standard test methods for moisture relations using a 5.5 lb (2.5 kg) hammer and 12 inch (304.8 mm) drop. In: ASTM Standards in Building Codes. Philadelphia, 1982. 836-842.
BOTTA, G.F.; JORAJURIA, D.; BALBUENA, R. & ROSATTO, H. Mechanical and cropping behaviour of direct drilled soil under different traffic intensities: Effect on soybean (Glycine max L.) yields. Soil Till. Res., 78:53-58, 2004. BRAIDA, J.A.; REICHERT, J.M.; DA VEIGA, M. & REINERT,
D.J. Resíduos vegetais na superfície e carbono orgânico do solo e suas relações com a densidade máxima obtida no ensaio Proctor. R. Bras. Ci. Solo, 30:605-614, 2006. CARTER, M.R. Relative measures of soil bulk density to
characterize compaction in tillage studies on fine sandy loams. Canadian J. Soil Sci., 70:425-433, 1990.
DEXTER, A.R. Uniaxial compression of ideal brittle tilths. J. Terramech., 12:3-14, 1975.
DÍAZ ZORITA, M. & GROSSO, G.A. Effect of soil texture, organic carbon and water retention on the compactability of soils from the Argentinean pampas. Soil Till. Res., 54:121-126, 2000.
DÍAZ ZORITA, M.; DUARTE, G.A. & GROVE, J.H. A review of no-till systems and soil management for sustainable crop production in the subhumid and semiarid Pampas of Argentina. Soil Till. Res., 65:1-18, 2002.
FRANZLUEBBERS, A.J. & STUEDEMANN, J.A. Soil physical responses to cattle grazing cover crops under conventional and no tillage in the southern Piedmont, USA. Soil Till. Res., 100:141-153, 2008.
GEE, G.W. & OR, D. Particle-size analysis. In: DANE, J.H. & CLARKE TOPP, G., eds. Methods of soil analysis: Physical methods. Madison, Soil Science Society of America, 2002. Part 4. p.255-293 (Book Series, 5)
GUPTA, S.C. & ALLMARAS, R.R. Models to assess the susceptibility of soils to excessive compaction. Adv. Soil Sci., 6:65-100, 1987.
HAMZA, M.A. & ANDERSON, W.K. Soil compaction in cropping systems. A review of the nature, causes and possible solutions. Soil Till. Res., 82:121-145, 2005. KRUGER, H.R. Compactación en Haplustoles del sudoeste
bonaerense (Argentina) bajo cuatro sistemas de labranza. Ci. Suelo, 14:104-106, 1996.
LAL, R.; REICOSKY, D.C. & HANSON, J.D. Evolution of the plow over 10000 years and the rationale for no-till farming. Soil Till. Res., 93:1-12, 2007.
LIPIEC, J. & HATANO, R. Quantification of compaction effects on soil physical properties and crop growth. Geoderma, 116:107-136, 2003.
MICUCCI, F.G. & TABOADA, M.A. Soil physical properties and soybean (Glycine max, Merrill) root abundance in conventionally- and zero-tilled soils in the humid Pampas of Argentina. Soil Till. Res., 86:152-162, 2006.
MUELLER, L.; SCHINDLER, U.; FAUSEY, N.R. & LAL, R. Comparison of methods for estimating maximum soil water content for optimum workability. Soil Till. Res., 72:9-20, 2003.
NETER, J. & WASSERMAN, W. Applied linear statistical models: Regression analysis of variance and experimental design. Homewood, IRWIN, R. D., 1974. 842p.
NHANTUMBO, A.B.J.C. & CAMBULE, A.H. Bulk density test as a function of texture for agricultural soils in Maputo Province of Mozanbique. Soil Till. Res., 87:231-239, 2006. PECORARI, C.; ANDRIULO A. & AUSILIO, A. Aptitud físico-mecánica de los suelos para el laboreo. II Efectos de la textura y de la materia orgánica sobre la densidad aparente máxima de algunos suelos de la región pampeana Argentina. Buenos Aires, INTA, 1993. 16p. (Informe Técnico INTA, 281)
QUIROGA, A.R.; BUSCHIAZZO, D.E. & PEINEMANN, N. Soil compaction is related to management practices in the semi-arid Argentine pampas. Soil Till. Res., 52:21-28, 1999. REICHERT, J.M.; SANCHES SUZUKI, L.E.A.; REINERT, D.J.; HORN, R. & HÅKANSSON, I. Reference bulk density and critical degree-of-compactness for no-till crop production in subtropical highly weathered soils. Soil Till. Res., 102:242-254, 2009.
SALAZAR LEA PLAZA, J.C. & MOSCATELLI, G. Soil map of Buenos Aires province. Scale: 1:500000. SAGyP – INTA. Buenos Aires, 1989. 527p.
SOANE, B.D. The role of organic matter in soil compactability: A review of some practical aspects. Soil Till. Res., 16:179-201, 1990.
SORIANO, A.; LEÓN, R.J.C.; SALA, O.E.; LAVADO, R.S.; DEREGIBUS, V.A.; CAUHÉPÉ, M.A.; SCAGLIA, O.A.; VELÁZQUEZ, C.A. & LEMCOFF, J.H. Río de la Plata grasslands. In: COUPLAND,R.T., ed. Natural grasslands of ecosystems of the world. Amsterdam, Elsevier Scientific Publishing, 1991. p.367-407.
TABOADA, M.A.; MICUCCI, F.G.; COSENTINO, D.J. & LAVADO, R.S. Comparison of compaction induces by conventional and zero tillage in two soils of the Rolling Pampa of Argentina. Soil Till. Res., 49:57-63, 1998. THOMAS, G.W.; HASZLER, G.R. & BLEVINS, R.L. The effect
of organic matter and tillage on maximum compactability of soils using the Proctor test. Soil Sci., 161:502-508, 1996. WAGNER, L.E.; AMBE, N.M. & DING, D. Estimating a Proctor density curve from intrinsic soil properties. Trans. Am. Soc. Agric. Eng., 37:1121-1125, 1994.
![Solubility of Benzo[a]pyrene and Organic Matter of Soil in Subcritical Water](data:image/gif;base64,R0lGODlhAQABAIAAAP///wAAACH5BAEAAAAALAAAAAABAAEAAAICRAEAOw==)