Food Science and Technology ISSN 0101-2061
DI:
D http://dx.doi.org/10.1590/1678-457X.0026
1 Introduction
Brazil is characterized by low fish consumption, 10.6 kg per capita (Sociedade Nacional da Agricultura, 2015), in contrast to the world average per capita fish consumption of 19.2 kg (Food and Agriculture Drganization of the United Nations, 2014).
Previous research showed the low consumption of fish in some regions on Brazil (Mitterer-Daltoé et al., 2013a, b). Mitterer-Daltoé et al. (2013a) showed that out of the 200 participants in the study, 38% said they never consume fish or that they consume it only once a month; 27.5% said they consume fish every month and stressed that Brazilians are potential fish consumers, not only due to their positive attitude regarding the intention to consume it but also to the plentiful supply that the country can offer.
Fish has a high nutritional value and its chemical composition shows high protein rates and low amounts of fat, which makes it important in a healthy diet (Cicero et al., 2014). Although it is an important source of nutrients, it is highly perishable due to the almost neutral pH, high water activity in the tissues and fast emergence of the rigidity stage (rigor mortis) and high rate of nutrients that favor the development of micro-organisms (Amaral & Freitas, 2013).
Strategic solutions to overcome the short useful life of fresh fish can be adopted, such as the development of quality fish-based products that respond to consumer demand (Mitterer-Daltoé et al., 2014).
The process of development of new products is an indispensable segment of the foodstuff industry for the survival of companies
and for market economies. This is even truer for food industries that must often launch new products to attract the consumer’s eye Consumer expectation increases with regard to novelties in the food sector, awaiting different products and thus generating a more competitive market as they abandon brand fidelity.
The development of new products requires planning about the product to be elaborated, the carrying out of research on the subject, control and use of systematic methods to standardize the elaboration process, able to integrate and optimize the different aspects involved (Bruzzone et al., 2015). According to Kleef et al. (2005), the consumer’s role is fundamental on each stage of the development of new products, mainly because the product must be in accordance with the preferences of consumers so that acceptance is achieved.
In this context, innovative techniques in the field of sensorial analysis have sprung up in search of a direct link with consumers. The CATA (check all that apply) methodology consists in sentences/statements used by arbiters to mark out as many options as are needed to express their opinion about the product under analysis (Ares et al., 2010; Jaeger et al., 2015; Meyners et al., 2013). Such methodologies are descriptive, not lengthy, flexible and can be apply on the consumers without the need for trained appraisers.
Techniques involving consumers are apply in an attempt to narrow the relationship among several factors and help interpret the perception of food by the human being linked to the pleasure experienced in its consumption (Naes et al., 2010). In this
Check all that apply (CATA) as an instrument for the development of fish products
Anne Caroline BELUSSD1, Barbara Arruda NDGUEIRA1, Leandra Schuastz BREDA1,
Marina Leite MITTERER-DALTDÉ1*
Received 08 Oct., 2015 Accepted 05 May, 2016
1 Departamento de Química, Universidade Tecnológica Federal do Paraná – UTFPR, Pato Branco, PR, Brazil *Corresponding author: [email protected]
Abstract
The objective of this paper is to develop a fish-based product. Through the innovative sensorial check all that apply (CATA) technique, employed in two stages of the development of the product – market research and the sensorial and hedonistic characterization of the final product – the aim was to develop a fish by-product that could respond to the needs of the consumer market. Results showed that the CATA technique is an important instrument for researching the consumer market and indicated the kind of fish by-product to be developed and its desired features. Nugget was the resulting by-product. The second application of CATA made possible the sensorial description of the by-product as being crisp, with little fish odor, light in color, well-seasoned and tasty. Therefore, the CATA technique proved to be an important research instrument in the fish consumption market as well as a quick technique for the complete description of fish nuggets.
Keywords: cata; market; nuggets; product development; sensory perception.
sense, the science of the consumer comes up as an important instrument to assess the potential of insertion into the market, a very important stage when dealing with the development of new products. Within this perspective, the aim of the present paper was to develop a fish-based product through the application of the check all that apply technique (CATA). The CATA methodology was applied in two stages of the development of the product: market research and the sensorial and hedonistic characterization of the final product.
2 Materials and methods
2.1 Market research – CATA (check all that apply)
With the intention of finding out expectations, preferences and perceptions of consumers regarding a fish product, a market research was carried out, using the CATA technique, with 60 citizens between 14 and 65 years of age of the town of Pato Branco, located in southwest of the state of Paraná, Brazil. Approximately 50% of the participants were male and 50% female.
The CATA questionnaire included 20 sentences and for each statement an opposing sentence was presented, with a view to obtaining trustworthy results. The sentences regarded sensorial characteristics, types of products and consumer habits related to fish consumption. Responses that marked both the statement and its opposite were discarded.
The sentences were randomly presented, with the generation of four questionnaires organized in different forms in order to avoid any mistake related to the order (Ares & Jaeger, 2013)
2.2 Elaboration of a fish-based product
In accordance with the results of the market research that will be presented in the first section (3.1) of the results, the product to be developed was fish nugget. The species of fish used for the elaboration of the product was the grass carp (Ctenopharyngodon idella), due to its farming potential in the region under study.
These initial results also indicated the need for a process of washing the fish in order to attain two sensorial features desired by consumers (light meat and weak fish odor). The washing of the fillet was carried out according to (Furlan et al., 2009).
A nugget is an industrialized meat product obtained from the meat of different animals sold in butcher shops, with the addition of ingredients, either molded or not, coated in an appropriate cover that characterizes it. It may be raw, semi-cooked, cooked, semi-fried, fried or under other forms of preparation (Brasil, 2001).
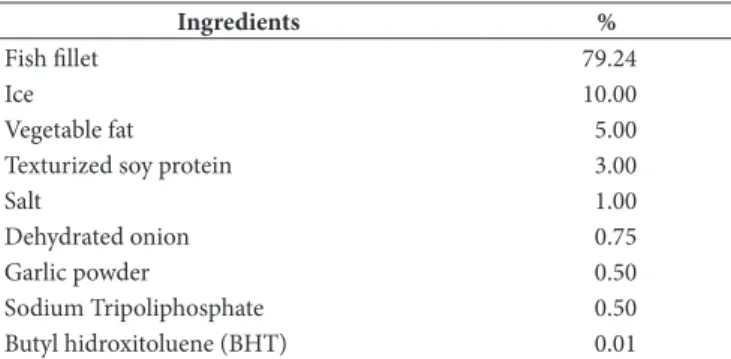
The basic formulation to be used in the elaboration of fish nugget is shown in Table 1, a product develop from a homogeneous paste made with the ingredients. After elaboration, the paste was frozen for 24 hours at a temperature of -18 °C in order to attain the desired consistency. After this period, the frozen paste was cut in the form of a nugget. After the elaboration of the nugget the battering operation was performed in three stages. In the first, called predust, the product was coated with wheat flour, with the intention of coupling the product with the next stage, known as batter. The product was bathed in a mixture of
water and wheat flour (2:1) in order to make the flour adhere (breading). In the third stage, breading, the product was coated with ground corn flour flakes passed through a sieve.
Next, the nugget was pre-fried for 30 seconds according to Bonacina & Queiroz, (2007) at a temperatures between 150 and 189 °C, a temperature range indicated for a not significant non-absorption of oil (Dobarganes et al., 2000).
For the carrying out of the sensorial tests described below, the nugget samples previously frozen were taken out of the freezer and then prepared in two ways: fried and baked.
2.3 Acceptance and purchase intention of grass carp nuggets
A proposed 9-point hedonic scale was used to evaluate the acceptance of the grass carp nugget. The methodology of intention to purchase used was the attitude scale (Mucci et al., 2004) based on the choices “definitively would not buy” to “would buy”. A sample of the fish-based product was handed to the consumers. Half of the arbiters received the fried sample and the other half received the baked one.
2.4 Sensorial and hedonic characterization of grass carp nugget – CATA (check all that apply)
In order to characterize the elaborated product, another CATA questionnaire containing sensorial and hedonistic attributes related to the nuggets was applied. Dpposing sentences were presented for all attributes.
The results of research involving humans were approved by the Ethics Committee for Human Research at the Universidade Tecnológica Federal do Paraná (case number 084859/2014).
2.5 Statistical analysis
The data were analyzed using Statistica 12.7. Analysis of the cata data was performed by the Z test for two proportions. Dn the first cata the test was carried out among all statements with a 5% significance level (α= 0.05).
The acceptance index (A) of grass carp nuggets was calculated from the average obtained, with the maximum value of the scale (9) representing 100%.To assess the acceptance of breaded fish multinomial logistic regression was performed (González et al., 2011; Hair et al., 2009).
Table 1. Formulation of grass carp nugget.
Ingredients %
Fish fillet 79.24
Ice 10.00
Vegetable fat 5.00
Texturized soy protein 3.00
Salt 1.00
Dehydrated onion 0.75
Garlic powder 0.50
Sodium Tripoliphosphate 0.50
Dn the second cata, z test (α = 0.05) was performed to study differences between opposite sensory attributes and conditions of preparation baked/fried. Correspondence analysis was used to determine the association between CATA and hedonic answers.
3 Results and discussion
3.1 Market research – CATA (Check all that apply)
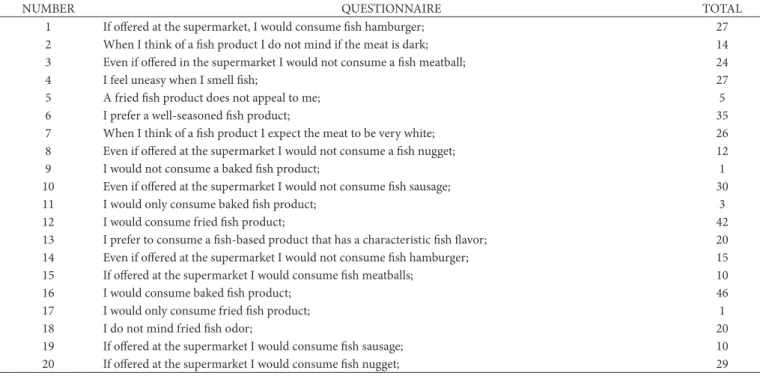
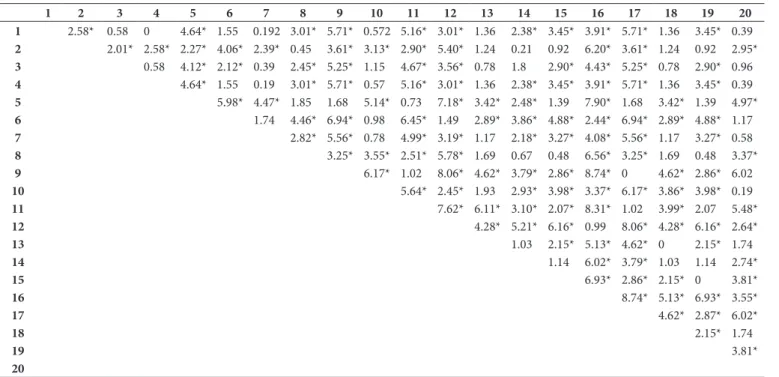
Respondents answered the CATA questionnaire that contained sentences about the product to be developed and presented sensorial attributes that catered to their preferences regarding fish products. Table 2 shows the number of times that consumers marked each statement. Test Z (Table 3) presents the significance of the difference between each statement. The most quoted statements were 1, 3, 4, 6, 7, 10, 12, 16 and 20.
The results of the CATA analysis clearly indicate the direction of the kind of product to be developed, since consumers rejected the fish products “sausage” and “meatball”, judging from the low frequency note regarding statements 15 and 19. These statements presented a significant difference regarding statements 1 and 20, related to the consumption potential of fish hamburgers and nuggets, respectively.
The high frequencies recorded for statements 1 and 20 and the low level of assiduity (p ≤ 0.05) for its opposing phrases (statements 14 and 8) corroborate the consumption potential for the products “fish hamburgers” and “nuggets”.
As for the conditions of preparation, no preference in fish consumption was recorded, since both statements, 12 and 16, showed high frequency (p ≥ 0.05) and presented significant differences with their opposites, suggesting the possibility of eating both fried or baked.
In this sense, taking into account the results discussed above, it is suggested that the product to be develop should be fish nugget, since its manner of preparation may receive the preference of the public that wishes to eat it either fried or baked.
Important sensorial attributes were conclusive, such as in the case of offering a well-seasoned product. Seasoning is essential for the product to be elaborated, as seen by the high frequency of markings for statement 6 and low for statement 13, with p ≤0.05 among the alternatives. This result may be related to fish odor. The practice of seasoning often intends to mask or weaken some undesired flavors or odors. In what regards fish foods it is common for people to feel uneasy, which makes its consumption more difficult (Drake et al., 2010; Leek et al., 2000). For consumers involved in this research – although without a significant difference between statement 4 “fish odor makes me uneasy” and its opposite 18 – there was a remarkable rejection of this attribute, with a participation of 45% of individuals. Besides, often the undesirable fish odor relates to the deterioration of the raw material.
An important perception obtained by the CATA technique related to the color condition of a fish by-product. The importance of light meat color becomes evident in the comparison between statements 2 and 7, with p ≤ 0.05. In a research carried out by Mitterer-Daltoé et al. (2013b) a clear relationship between the white color and fish by-products among consumers was found. The authors presented fish hamburgers of light and dark color and investigated through the test of association of words the immediate cognitions of the two kinds of stimuli. Among the associations that arose for the dark meat by-product the word “doubt” stands out with regard to color.
Therefore, the data obtained by the CATA technique suggested the fish product to be elaborated, with defined characteristics
Table 2. Results of check all that apply questionnaire. Frequencies for each sentence.
NUMBER QUESTIDNNAIRE TDTAL
1 If offered at the supermarket, I would consume fish hamburger; 27
2 When I think of a fish product I do not mind if the meat is dark; 14
3 Even if offered in the supermarket I would not consume a fish meatball; 24
4 I feel uneasy when I smell fish; 27
5 A fried fish product does not appeal to me; 5
6 I prefer a well-seasoned fish product; 35
7 When I think of a fish product I expect the meat to be very white; 26
8 Even if offered at the supermarket I would not consume a fish nugget; 12
9 I would not consume a baked fish product; 1
10 Even if offered at the supermarket I would not consume fish sausage; 30
11 I would only consume baked fish product; 3
12 I would consume fried fish product; 42
13 I prefer to consume a fish-based product that has a characteristic fish flavor; 20 14 Even if offered at the supermarket I would not consume fish hamburger; 15
15 If offered at the supermarket I would consume fish meatballs; 10
16 I would consume baked fish product; 46
17 I would only consume fried fish product; 1
18 I do not mind fried fish odor; 20
19 If offered at the supermarket I would consume fish sausage; 10
that respond to the needs of the consumers. Fish nuggets were indicated as the kind of product to be developed since it pleases both the public that prefers to consume the fried or the baked product and there was no significant difference in the intention to consume between hamburgers and nuggets, neither between the fried and the baked product.
Besides the kind of product, it was clear that this fish by-product must be presented with light meat, preferably with weak fish odor and well-seasoned. In a study carried out by Simões et al. (2004) it was seen that the process of washing fish fillets reduces the characteristic odor and flavor of fish due to the removal of sarcoplasmatic proteins, to the advantage of the development of the product.
3.2 Acceptance and intention to purchase grass carp nuggets
A total of 77 arbiters participated in the emotion tests for
grass carp nuggets. Demographic features of the sampling are presented in Table 4. With a view to verifying the acceptance of the two different forms of preparation, 36 arbiters received fried samples and 41 received baked ones. The dimension of the samples were 1.5 x 1.5 cm and coded with three random digits. Table 4 shows the demographic features of the sampling.
In order to look for a correspondence between the acceptance of the fish nugget and the consumer, the multivariate statistical technique of multinomial logistic regression (Mitterer-Daltoé et al., 2013c). Multinomial logistic regression is an adjusted statistic in a situation where the dependent variable is related to quality, while independent variable are either categorical or a mixture of all of them (González et al., 2011). Multivariate techniques of analysis are widely used in sensorial and arbiter data in order
to point out features of the product and arbiters most closely related to acceptance (Symoneaux et al., 2012).
Table 5 shows the statistical significance for each independent variable in the acceptance of fish nugget. Significance is obtained by Wald’s statistical analysis; if the logistic coefficient is statistically significant its interpretation is given in terms of how it affects the dependent variable. In accordance with the results obtained, it can be seen that the variables did not have a significant interference in the acceptance of grass carp nugget for the sample group.
The result that stands out is the non-significant effect for the variable “preparation of the sample” for the acceptance of the nugget, confirming the consumer’s indifference with regard to the form of preparation of the fish product, either fried or baked. This behavior can be better clarified through the results of the acceptance indexes, of 87.7% for fried and 85.9% for baked nuggets.
Table 3. Significance level between hypotheses for the z test.
1 2 3 4 5 6 7 8 9 10 11 12 13 14 15 16 17 18 19 20
1 2.58* 0.58 0 4.64* 1.55 0.192 3.01* 5.71* 0.572 5.16* 3.01* 1.36 2.38* 3.45* 3.91* 5.71* 1.36 3.45* 0.39
2 2.01* 2.58* 2.27* 4.06* 2.39* 0.45 3.61* 3.13* 2.90* 5.40* 1.24 0.21 0.92 6.20* 3.61* 1.24 0.92 2.95*
3 0.58 4.12* 2.12* 0.39 2.45* 5.25* 1.15 4.67* 3.56* 0.78 1.8 2.90* 4.43* 5.25* 0.78 2.90* 0.96
4 4.64* 1.55 0.19 3.01* 5.71* 0.57 5.16* 3.01* 1.36 2.38* 3.45* 3.91* 5.71* 1.36 3.45* 0.39
5 5.98* 4.47* 1.85 1.68 5.14* 0.73 7.18* 3.42* 2.48* 1.39 7.90* 1.68 3.42* 1.39 4.97*
6 1.74 4.46* 6.94* 0.98 6.45* 1.49 2.89* 3.86* 4.88* 2.44* 6.94* 2.89* 4.88* 1.17
7 2.82* 5.56* 0.78 4.99* 3.19* 1.17 2.18* 3.27* 4.08* 5.56* 1.17 3.27* 0.58
8 3.25* 3.55* 2.51* 5.78* 1.69 0.67 0.48 6.56* 3.25* 1.69 0.48 3.37*
9 6.17* 1.02 8.06* 4.62* 3.79* 2.86* 8.74* 0 4.62* 2.86* 6.02
10 5.64* 2.45* 1.93 2.93* 3.98* 3.37* 6.17* 3.86* 3.98* 0.19
11 7.62* 6.11* 3.10* 2.07* 8.31* 1.02 3.99* 2.07 5.48*
12 4.28* 5.21* 6.16* 0.99 8.06* 4.28* 6.16* 2.64*
13 1.03 2.15* 5.13* 4.62* 0 2.15* 1.74
14 1.14 6.02* 3.79* 1.03 1.14 2.74*
15 6.93* 2.86* 2.15* 0 3.81*
16 8.74* 5.13* 6.93* 3.55*
17 4.62* 2.87* 6.02*
18 2.15* 1.74
19 3.81*
20
*Presented a significant difference; α = 0.05 Zα = 1.96.
Table 4. Demographic features of the sampling.
Variables n = 77
Gender Female 52
Male 25
Age* G1 26
G2 37
G3 14
Preparation of the Sample Fried 36
Baked 41
By comparing these results with those obtained in the evaluation of the intention to purchase, 80.3% for fried and 80.0% for baked nuggets, one observes similar results and positive attitudes with regard to grass carp nuggets.
3.3 Evaluation of the product – CATA (check all that apply)
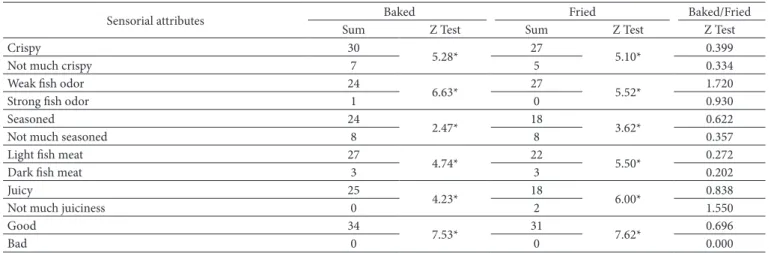
CATA questionnaires have proved to be simple alternatives in order to assess consumers’ perceptions with regard to food products (Ares et al., 2010). In order to evaluate the perception of fish nugget in relation to sensorial attributes pre-defined by the first CATA, another CATA questionnaire was applied to the same 77 arbiters. Table 6 shows the frequencies of markings for each term of the CATA questionnaire. The most marked terms were “crispness”, “weak fish odor”, “seasoned”, “light fish meat” “juicy” and “good”, and ≤ 0.05 for their opposites. It can be seen, therefore, that the attributes proposed in the first CATA for a fish by-product were attained in the developed product. As in the acceptance test, no difference was noted for the present technique (≤ 0.05) in the description of fried or baked nuggets for all sensorial and hedonic attributes, indicating dual possibilities for consumption.
In order to better appreciate the relationship between the CATA terms and the hedonic points, a correspondence analysis (CA) (Beh et al., 2011; Guerrero et al., 2010) was conducted. CA is a multidimensional scaling multivariate technique that uses non-metric data in the crossed design to create percentage maps including all variable categories (Hair et al., 2009). Dnce participants made their marks on the hedonic scale, starting
from point 6, the correspondence analysis was carried out only with points 6, 7, 8 and 9.
Figure 1 shows the results of the correspondence analysis carried out for CATA sentences. The first two dimensions explain 96.41% of the association between the sentences and the points in the hedonic scale.
The definition of groups is observed from the indicator “quality” which varied from 59.5% to 99.9% between samples, confirming the good relationship between sensorial attributes and hedonic evaluation. The “quality” indicator shows the sum of relative contributions and is the part of each profile explained by both axes; the closer it is to 1, the better will be the representation of this profile (González et al., 2011). Negative sensorial attributes “not much juicy”, “dark fish meat” and “not much seasoned” were positioned close to point 6 of the hedonic scale, meaning “I liked a little”, which corroborates and
Table 5. Statistical significance for each variable based on the acceptance
of grass carp nuggets.
Effect Wald p
Age 0.146 0.986
Gender 0.290 0.962
Preparation of the sample 0.667 0.881
Preparation of the sample X Gender 4.238 0.237 p ≤ 0.05: significant variable.
Table 6. Results of check all that apply questionnaire. Frequencies for each attribute and evaluated samples.
Sensorial attributes Baked Fried Baked/Fried
Sum Z Test Sum Z Test Z Test
Crispy 30
5.28* 27 5.10* 0.399
Not much crispy 7 5 0.334
Weak fish odor 24
6.63* 27 5.52* 1.720
Strong fish odor 1 0 0.930
Seasoned 24
2.47* 18 3.62* 0.622
Not much seasoned 8 8 0.357
Light fish meat 27
4.74* 22 5.50* 0.272
Dark fish meat 3 3 0.202
Juicy 25
4.23* 18 6.00* 0.838
Not much juiciness 0 2 1.550
Good 34
7.53* 31 7.62* 0.696
Bad 0 0 0.000
*Show significant difference (α = 0.05; Zα = 1.96).
Figure 1. Analysis of the correspondence between CATA sentences
and points in the hedonic scale. o Sensory attributes; ▲ Answers
helps understanding the perception of the developed product. Regarding points 7, 8 and 9 of the hedonic scale that goes from “I did like” to “I liked very much”, one remarks a relationship with the positive sensorial attributes “seasoned”, “crisp”, “light fish meat” and “weak fish odor”, except regarding the term “not much crisp” which also appears well related to these points of the scale.
4 Conclusion
The CATA technique proved to be an important tool for researching the consumer market as a quick technique for the complete description of the fish nugget, and the alliance between CATA sentences, hedonic scale and correspondence analysis made possible the understanding acceptance and sensorial attributes. Fish nugget arises as an alternative for the introduction of a fish by-product in the market as well as an important strategy to stimulate fish farming in the southwest of Paraná.
Acknowledgements
The authors are grateful to the National Council for Scientific and Technological Development – CNPq – Brasil (Process Universal nᵒ 456102/2014-0).
References
Amaral, G., & Freitas, D. (2013). Método do índice de qualidade na
determinação do frescor de peixes. Ciência Rural, 43(11), 2093-2100.
http://dx.doi.org/10.1590/S0103-84782013001100027.
Ares, G., & Jaeger, S. R. (2013). Check-all-that-apply questions: Influence
of attribute order on sensory product characterization. Food
Quality and Preference, 28(1), 141-153. http://dx.doi.org/10.1016/j.
foodqual.2012.08.016.
Ares, G., Barreiro, C., Deliza, R., Giménez, A., & Gámbaro, A. (2010). Application of a Check-All-That-Apply Question To the Development
of Chocolate Milk Desserts. Journal of Sensory Studies, 25(1), 67-86.
http://dx.doi.org/10.1111/j.1745-459X.2010.00290.x.
Beh, E. J., Lombardo, R., & Simonetti, B. (2011). A European perception
of food using two methods of correspondence analysis. Food
Quality and Preference, 22(2), 226-231. http://dx.doi.org/10.1016/j.
foodqual.2010.10.001.
Bonacina, M., & Queiroz, M. I. (2007). Elaboração de empanado a
partir da corvina (Micropogonias furnieri). Ciência e Tecnologia
de Alimentos, 27(3), 544-552.
Brasil, Ministério da Agricultura, Pecuária e Abastecimento. (2001).
Instrução Normativa nº 6, de 31 de julho de 2000. Regulamentos técnicos de identidade e qualidade de paleta cozida, produtos cárneos salgados, empanados, presunto tipo serrano e prato elaborado pronto contendo
produtos de origem animal. Brasília: Ministério da Agricultura e do
Abastecimento.
Bruzzone, F., Vidal, L., Antúnez, L., Giménez, A., Deliza, R., & Ares, G. (2015). Comparison of intensity scales and CATA questions in new product development : Sensory characterisation and directions for
product reformulation of milk desserts. Food Quality and Preference,
44, 183-193. http://dx.doi.org/10.1016/j.foodqual.2015.04.017. Cicero, L., Furlan, E., Tomita, R., Prisco, R., Savoy, V., & Neiva, C.
(2014). Estudo das metodologias de destilação na quantificação do Nitrogênio das Bases Voláteis Totais em pescada, tilápia e camarão Study of distillation methodologies for the quantifi cation of nitrogen in the total volatile bases of hake, tilapia and shrimp.
Brazilian Journal of Food Technology, 17(3), 192-197. http://dx.doi.
org/10.1590/1981-6723.5713.
Dobarganes, C., Márquez-ruiz, G., & Velasco, J. (2000). Interactions between
fat and food during deep-frying. European Journal of Lipid Science
and Technology, 102(8-9), 521-528.
http://dx.doi.org/10.1002/1438-9312(200009)102:8/9<521::AID-EJLT521>3.0.CD;2-A.
Drake, S., Drake, M., Sanderson, R., Daniels, H., & Yates, M. (2010). the Effect of Purging Time on the Sensory Properties of Aquacultured
Southern Flounder (Paralichthys Lethostigma). Journal of Sensory Studies,
25(2), 246-259. http://dx.doi.org/10.1111/j.1745-459X.2009.00255.x. Food and Agriculture Drganization of the United Nations – FAD. (2014)
The state of world fisheries and aquaculture. Roma: FAD. Retrieved
from http://www.fao.org/3/a-i3720e/index.html
Furlan, V., Silva, A., & Queiroz, M. I. (2009). Avaliação da eficiência de extração de compostos nitrogenados da polpa de anchoíta (Engraulis anchoita) Evaluation of the efficiency of nitrogen compounds
extraction from the anchovy (Engraulis anchoita) pulp. Ciência e
Tecnologia de Alimentos, 29(4), 834-839.
González, C., Liste, A., & Felpeto, A. (2011). Tratamiento de datos
con R, Statistics y SPSS (1st ed., pp. 978). Espanha: Diaz de Santos.
Guerrero, L., Claret, A., Verbeke, W., Enderli, G., Zakowska-biemans, S., Vanhonacker, F., & Hersleth, M. (2010). Perception of traditional food
products in six European regions using free word association. Food
Quality and Preference, 21(2), 225-233. http://dx.doi.org/10.1016/j.
foodqual.2009.06.003.
Hair, J., Black, W., Babin, B., Anderson, R., & Tatham, R. (2009). Análise
multivariada de dados (6th ed.). Porto Alegre: Bookman.
Jaeger, S. R., Beresford, M. K., Paisley, A. G., Antúnez, L., Vidal, L., Cadena, R. S., Giménez, A., & Ares, G. (2015). Check-all-that-apply (CATA) questions for sensory product characterization by consumers: Investigations into the number of terms used in CATA
questions. Food Quality and Preference, 42, 154-164. http://dx.doi.
org/10.1016/j.foodqual.2015.02.003.
Kleef, E., Trijp, H. C. M., & Luning, P. (2005). Consumer research in the early stages of new product development: a critical review of
methods and techniques. Food Quality and Preference, 16(3),
181-201. http://dx.doi.org/10.1016/j.foodqual.2004.05.012.
Leek, S., Maddock, S., & Foxall, G. (2000). Situational determinants of
fish consumption. British Food Journal, 102(1), 18-39. http://dx.doi.
org/10.1108/00070700010310614.
Meyners, M., Castura, J. C., & Carr, B. T. (2013). Existing and new
approaches for the analysis of CATA data. Food Quality and Preference,
30(2), 309-319. http://dx.doi.org/10.1016/j.foodqual.2013.06.010. Mitterer-Daltoé, M. L., Latorres, J. M., Queiroz, M. I., Fiszman, S., &
Varela, P. (2013a). Reasons underlying low fish consumption where availability is not an issue. A case study in Brazil, one of the world’s
largest fish producers. Journal of Sensory Studies, 28(3), 205-216.
http://dx.doi.org/10.1111/joss.12037.
Mitterer-Daltoé, M. L., Carrillo, E., Queiroz, M. I., Fiszman, S., & Varela, P. (2013b). Structural equation modelling and word association
as tools for a better understanding of low fish consumption. Food
Research International, 52(1), 56-63. http://dx.doi.org/10.1016/j.
foodres.2013.02.048.
Mitterer-Daltoé, M., Latorres, J., Treptow, R., Pastous-Madureira, L., & Queiroz, M. (2013c). Acceptance of breaded fish (Engraulis anchoita)
in school meals in extreme southern Brazil. Acta Alimentaria, 42(2),
275-282. http://dx.doi.org/10.1556/AAlim.42.2013.2.15.
Mitterer-Daltoé, M. L., Queiroz, M. I., Fiszman, S., & Varela, P. (2014). Are fish products healthy? Eye tracking as a new food technology
e Tecnologia de Alimentos, 24(1), 23-26. http://dx.doi.org/10.1590/ S0101-20612004000100005.
Sociedade Nacional da Agricultura – SNA. (2015). Consumo de pescado
no Brasil está abaixo do recomendado pela OMS. Retrieved from
http://sna.agr.br/consumo-de-pescado-no-brasil-esta-abaixo-do-recomendado-pela-oms/
Symoneaux, R., Galmarini, M., & Mehinagic, E. (2012). Comment analysis of consumer’s likes and dislikes as an alternative tool to preference
mapping. A case study on apples. Food Quality and Preference, 24(1),
59-66. http://dx.doi.org/10.1016/j.foodqual.2011.08.013.
Science and Technology, 55(2), 459-465. http://dx.doi.org/10.1016/j.
lwt.2013.10.013.
Mucci, A., Hough, G., & Ziliani, C. (2004). Factors that influence purchase intent and perceptions of genetically modified foods among
Argentine consumers. Food Quality and Preference, 15(6), 559-567.
http://dx.doi.org/10.1016/j.foodqual.2004.02.004.
Naes, V., Brockhoff, P., & Tomic, D. (2010). Statistics for sensory and
consumer science (pp. 282). United Kingdom: John Wiley and Sons.
Simões, D., Queiroz, M. I., Volpato, G., & Zepka, L. (2004). Desodorización