ISSN: 1809-4430 (on-line)
_________________________
2 Universidade Estadual Paulista/ Jaboticabal - SP, Brasil.
3 Universidade Estadual de Mato Grosso do Sul/ Aquidauana - MS, Brasil.
CALIBRATION AND TESTING OF CS-CROPGRO MODEL FOR COMMON BEANS Doi:http://dx.doi.org/10.1590/1809-4430-Eng.Agric.v36n6p1239-1249/2016
MIQUÉIAS G. DOS SANTOS1*, ROGÉRIO T. DE FARIA2, LUIZ F. PALARETTI2,
GEFFSON DE F. DANTAS2, ALEXANDRE B. DALRI2, ADRIANO DA S. LOPES3
1*Corresponding author. Universidade Estadual Paulista/ Jaboticabal - SP, Brasil. E-mail:[email protected]
ABSTRACT: Simulation models of crop growth enable estimating crop yield and water balance components with low cost and high precision. This study aimed to calibrate and evaluate the performance of the CS-CROPGRO model for common beans under the conditions of Jaboticabal city (SP), Brazil. The model was calibrated and tested with data previously collected from two experiments conducted in 2002 and 2003. In these experiments, treatments corresponded to two irrigation scheduling methods (tensiometers and class A pan evaporation) and two cropping systems (conventional and no-till). For calibration, data from the experiment carried out in 2002 were used. For testing, we used data from the experiment conducted in 2003. By using the genetic coefficients calibrated for cultivar IAC-Carioca, the model could correctly simulate phenology, leaf area, dry matter and grain yield during both, calibration and testing, under no-till and conventional systems, combined with tensiometer and class A pan irrigation scheduling methods. Conversely, the model did not show the same performance for soil moisture simulations.
KEYWORDS: simulation, DSSAT, Phaseolus vulgaris, irrigation, planting system
INTRODUCTION
Despite the great importance for agricultural research, field experiments have great difficulties to be conducted given the time required or logistical difficulties. In addition, these studies are limited to answer promptly further questions generated, mainly involving weather and its interaction with crop production factors. In such a context, computer models are alternative tools to predict crop yields as function of weather conditions and crop and soil management practices instantly (OLIVEIRA et al., 2012).
Examples of such computer models are those included in the Decision Support System for Agrotechnology Transfer (DSSAT), which are able to simulate growth, development and water balance of different crops, in compliance with soil, plant and atmosphere characteristics (HOOGENBOOM et al., 2012).
Among these computer models, one includes the CS-CROPGRO, which enables simulating main physiological processes of several crop species. The model considers crop growth and development in a daily basis. It is a mechanistic and deterministic model that simulates the length of vegetative and reproductive stages, biomass accumulation and grain yield for a given cultivar, according to soil type, climatic conditions and management practice adopted. Specific crop coefficients (provided in a program file) and genetic coefficients of cultivars (calibrated for the genotype of interest) enable simulations of further responses of a given cultivar under varied environmental conditions.
In Brazil, the DSSAT software has been used to evaluate growth and production of crops such as common beans (OLIVEIRA et al., 2012; DALLACORT et al., 2011), cowpea beans (LIMA FILHO et al., 2013), soybeans (RODRIGUES et al., 2012; CHEVARRIA et al., 2013), corn (ALVES et al., 2011), sugarcane (NASSIF et al., 2012; MARIN et al., 2013; GOMES et al., 2014.), and perennial forages (PEDREIRA et al., 2011; LARA et al., 2012).
dynamics in soil, especially involving tillage systems (conventional and no-till). LIU et al. (2011) observed the ability of DSSAT in simulating soil moisture within surface layers, using the model for corn and soybeans.
Besides soil characteristics and climate data, DSSAT model application will require previous calibration of cultivar genetic coefficients, if it is unavailable in the system database. After calibration, its reliability has to be set through a validation process under the use conditions and with data different from those used in calibration.
The objective of this study was to calibrate and evaluate the performance of the CS-CROPGRO model for common bean crop, test the water balance module under two sol tillage systems and two irrigation scheduling methods, under soil and climatic conditions of Jaboticabal city - SP, Brazil.
MATERIAL AND METHODS
Field data from two experiments, conducted in 2002 and 2003, were used to input the CS-CROPGRO model. The experiments were conducted in Jaboticabal - SP (Brazil), at the geographical coordinates of 21°14'48'' S and 48°16'44'' W, and average altitude of 557 m. Local soil is classified as eutrophic Red Latosol - EUTRUDOX (Oxisol), clayey texture, A moderate horizon, kaolinitic hypoferric, on a gentle to corrugated relief. The regional climate is hot and humid tropical, with a rainy season between October and March, and dry between April and September. The local climatological normal from 1971 to 2000 is defined as average annual rainfall of 1,424 mm, average annual temperature of 22.2 °C and relative humidity of 70.8%.
The experimental design was randomized blocks in a 2 x 2 factorial with three blocks. The treatments consisted of two irrigation scheduling methods and two soil tillage systems: conventional till with tensiometer scheduling (CT-TENS), no-till with tensiometer scheduling (NT-TENS), conventional till with class A pan evaporation (CT-CAP) and no-till with class A pan evaporation (NT-CAP).
Common beans (Phaseolus vulgaris, L) cultivar IAC-Carioca were sown on June 8, 2002 and
on July 02, 2003, in rows spaced of 0.45 m, and at densities of 31.2 and 41.4 seeds m-2 for the
experiments in 2002 and 2003, respectively. The area was managed under crop succession of common beans in the winter and corn in the summer, under no-till (NT) and conventional till (CT).
Average straw dry weight left from previous crop was of 2,000 kg ha-1 in 2002 and 3,500 kg ha-1 in
2003, incorporating 100% in conventional till up to a 20-cm depth. Soil fertilization was accomplished according to chemical analysis of the soil and following crop recommendations. The other crop practices applied in the field experiments are found in LOPES (2006).
For calibration of the genetic coefficients, the GenSelect/ GenCalc application included in DSSAT system was used, using data from experimental treatments conducted in 2002. Model simulation testing using the calibrated genetic coefficients was performed by comparing the simulated values with independent data obtained in the experiment performed in 2003.
Model calibration was started with genetic coefficients of Carioca cultivar, available in the program, simulating the crop development throughout the same experimentation period. The process consisted in adjusting crop-related genetic coefficients to minimize gaps between stages flowering, first pod emergence and physiological maturity, simulated by the model, and observed experimentally. Afterwards, calibrations of genetic coefficient related to crop growth were carried out to match the estimates of dry mass and grain yields, leaf area index, and yield components (number of pods per plant, number of grains per pod and one grain mass) to the experimental data.
(1)
(2)
(3)
In which:
is the value estimated by the model;
is the value observed experimentally;
is the number of observations;
is the arithmetic mean of the estimated values, and
the arithmetic mean of the observed values.
RESULTS AND DISCUSSION
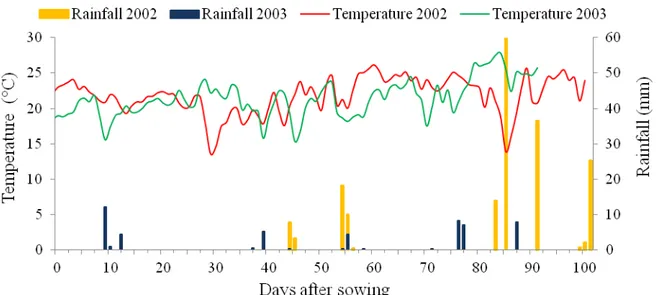
Seasonal temperature patterns were similar in both years, averaging 21.8 and 21.9 °C in 2002 and 2003, respectively (Figure 1). As usual, crop water demand were not met by local rainfall in both growing years. The annual rainfall totals were 166 mm in 2002 and 82 mm in 2003.
FIGURE 1.Mean temperature and rainfall during 2002 and 2003 crop seasons, in Jaboticabal, SP (Brazil).
Model calibration
The calibrated genetic coefficients used in the CS-CROPGRO model for IAC-Carioca cultivar are shown in Table 1. By assuming cultivar photoperiod insensitivity (PPSEN = 0), thermal time required to achieve flowering from emergence (EM-FL) was calibrated in photothermal days (ptd) as 24 ptd. From flowering to the onset of the first pod (FL-SH), the requirement was 6 ptd, up to the first seed (FL-SD) it was 18 ptd, until pod addition (PODUR) equal 10 ptd, and to the end of leaf growth (FL-LF) equal 30 ptd. The seed feeling duration period (SFDUR) and the period for physiological maturity since first seed (SD-PM) were of 20 and 16 ptd, respectively. The
coefficients corresponding to leaf characteristics were equal to 300 cm2 g-1 for maximum leaf area
cultivar has a photosynthetic efficiency (LFMAX) of 1.0 mg CO2 m-2 s-1, unit seed weight
(WTPSD) of 0.275 g, with mean seed number per pod (SDPDV) equal to 4. Finally, a maximum fraction of daily growth shared between seeds and pods (XFRT) were set equal to one.
TABLE 1. Genetic coefficients used to calibrate CS-CROPGRO model for common beans IAC-Carioca cultivar.
Cultivar CSDL PPSEN EM-FL FL-SH FL-SD SD-PM FL-LF
IAC-Carioca 12.17 0.0 24.0 6.0 18.0 16.0 30.0
LFMAX SLAVR SIZLF XFRT WTPSD SFDUR SDPDV PODUR
1.00 300 133.0 1.00 0.275 20.0 4.0 10.0
CSDL – critical day length, above which reproductive development is not affected (h); PPSEN – plant response to photophase over time (1 h-1); EM-FL – period between plant emergence and the onset of the first flower (R1) (photothermal days); FL-SH – period between the onset of the first flower and the appearance of the first pod (R3) (photothermal days); FL-SD – period between the onset of the first flower and the start of seed formation (R5) (photothermal days); SD-PM – period between the start of seed formation and physiological maturity (R7) (photothermal days); FL-LF – period between the onset of the first flower (R1) and the end of leaf expansion; LFMAX - maximum leaf photosynthesis rate at an optimal temperature of 30 ºC; SLAVR - specific leaf area under standard growth conditions (cm2); SIZLF – maximum size of a completely expanded leaf (cm2); XFRT – maximum fraction of daily growth shared between seeds and pods; WTPSD – maximum weight per seed (g); SFDUR – duration of grain swelling period in pods under standard growth conditions (photothermal days); SDPDV – mean seeds per pod under standard growth conditions; PODUR –
time required for a cultivar to reach ideal pod conditions (photothermal days)
Because of low temperatures during crop cycle, in order to improve estimates of flowering date the coefficients OPTBI and SLOBI-1 were adjusted to 20 °C and 0.05 °C, respectively. OPTBI corresponds to the minimum temperature above which there is no delaying effect on the period between emergence and flowering; yet SLOBI stands for the delay in phenological phases by temperature unit below the one set for OPTBI. FARIA et al. (2002) had also adopted this procedure to simulate properly the length of vegetative phase in common beans grown in Paraná state during winter.
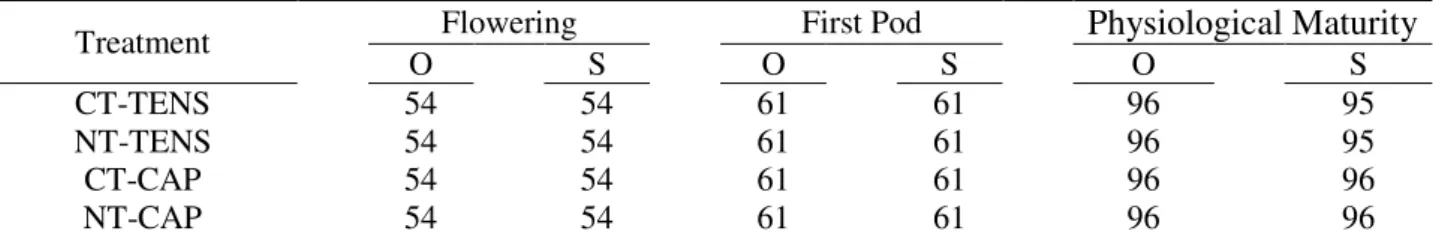
The model correctly estimated the crop cycle length as well as the dates of phenological stages (Table 2). The simulated and the observed dates coincided satisfactorily. The flowering was estimated as 54 days after sowing (DAS), the onset of the first pod as 61 DAS and the physiological maturity as 96 DAS. Other studies had already proved the ability of this model in simulating the phenology of other cultivars of beans, corroborating our findings (MEIRELES et al., 2002; OLIVEIRA et al., 2012).
TABLE 2. Number of days required for the occurrence of bean phenological stages, observed and simulated by CS-CROPGRO model for the calibration phase.
Treatment Flowering First Pod Physiological Maturity
O S O S O S
CT-TENS 54 54 61 61 96 95
NT-TENS 54 54 61 61 96 95
CT-CAP 54 54 61 61 96 96
NT-CAP 54 54 61 61 96 96
O – observed; S – simulated
Through the statistical indices shown in Figure 2, there was a good fit for leaf area between the simulated and the observed data, in all treatments. The magnitude of the errors, expressed in RMSE, presented results between 0.70 m2 m-2 to 1.01 m2 m-2, indicating a high accuracy of the
simulation. The model also showed good accuracy with R-values ranging from 0.86 to 0.87.
Moreover, regressions showed low deviations as inferred by MEE values, between 0.11 and 0.79 m2
Le
af
are
a index
(m
2 m -2 )
Days after sowing
FIGURE 2. Leaf area index of common beans, field-observed data vs. simulated data for the
calibration phase of CS-CROPGRO model.
Dry mass simulations were also quite accurate with RMSE values ranging from 1,031 kg ha-1
to 1,659 kg ha-1 (Figure 3). These simulations had low deviations compared to field observations,
with a maximum MEE of 1,320 kg ha-1. Furthermore, the model properly predicted field crop
grown, with R-values between 0.96 and 0.99. Dry matter yields were underestimated by about 21%, 24%, 26% and 23%, for all treatments CT-TENS, NT-TENS, CT-CAP and NT-CAP, respectively.
The simulated maximum value (5,914 kg ha-1) took place in NT-CAP treatment, at 96 DAS;
however, the most productive treatment in the field was CT-CAP, with 7,977 kg ha-1, at 88 DAS.
Dr
y biom
as
s (kg
ha
-1 )
Days after sowing
Table 3 demonstrates that the model simulated adequately crop yield, with maximum variation of 5.0%, reflecting the accuracy occurred in model calibration. OLIVEIRA et al. (2012), calibrating the same model for different bean cultivars, found variations of up to 15.94% between simulated and field-observed yields.
TABLE 3. Grain yield of common beans, field-observed data vs. simulated data by CS-CROPGRO,
for the calibration phase.
.
Treatment Simulated Observed Deviation Deviation (%)
(kg ha-1)
CT-TENS 2311 2397 -86 -3.6
NT-TENS 2225 2342 -117 -5.0
CT-CAP 2594 2630 -36 -1.4
NT-CAP 2593 2471 122 4.9
% = [(Simulated – Observed) / Observed] x 100
Model testing
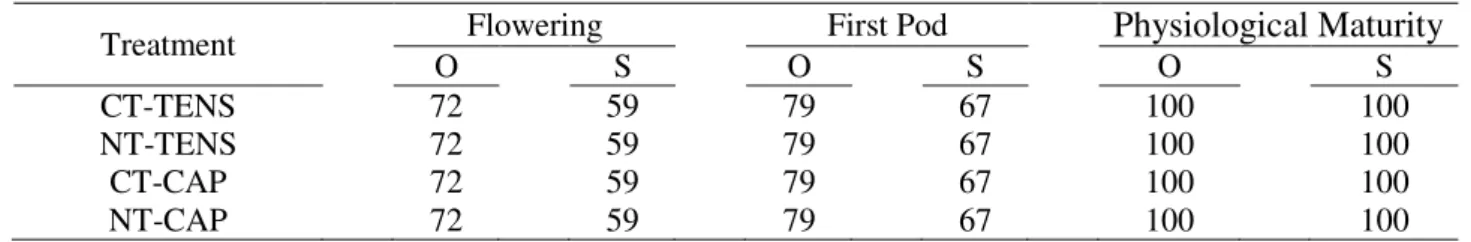
As in calibration phase, the model was also precise to estimate the length of crop cycle (Table 4). However, the dates of flowering and onset of the first pod were underestimated. By the model, flowering occurred at 59 DAS, while in the field it was at 72 DAS. The first pod appearance was simulated as 67 DAS, but in the field, it was at 79 DAS. Such discrepancy between the data can be explained by inaccuracy of the model or even, by the way field observations were carried out. In field, evaluations were visually made, so it was assumed a given phenological stage if 50% of the plants had at least one flower or pod.
TABLE 4. Number of days required for each phenological stage of common beans, field-observed data vs. simulated data by CS-CROPGRO model for the testing phase.
Treatment Flowering First Pod Physiological Maturity
O S O S O S
CT-TENS 72 59 79 67 100 100
NT-TENS 72 59 79 67 100 100
CT-CAP 72 59 79 67 100 100
NT-CAP 72 59 79 67 100 100
O – observed; S – simulated
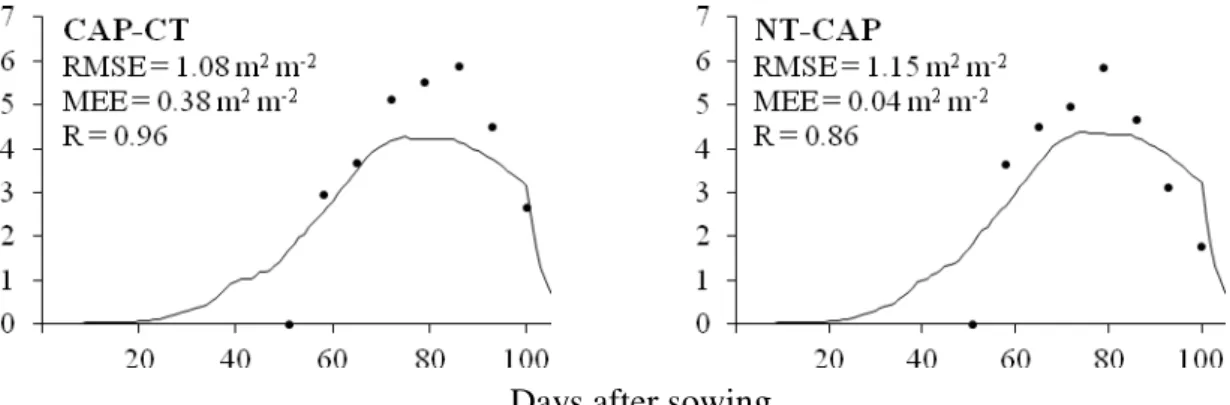
The model properly simulated leaf area index (Figure 4), as given by RMSE of 0.96 m2 m-2
(NT-TENS) to 1.19 m2 m-2 TENS). The R-values ranged from 0.86 (NT-CAP) to 0.96
(CT-CAP), and MEE reached a maximum of -1.08 m2 m-2 for CT-TENS, but in the other treatments
values were up to 0.38 m2 m-2.
Le
af
are
a index (
m
Days after sowing
FIGURE 4. Leaf area index of common beans, field-observed data vs. simulated data by CS-CROPGRO model for the testing phase.
The highest leaf area index (LAI) was estimated for a treatment under no-till (4.39 m2 m-2) at
75 DAS. It was underestimated by 26% compared to the experimentally observed, which occurred
at 86 DAS (5.89 m2 m-2). On the other hand, lowest estimate (4.27 m2 m-2) was simulated under
conventional till, also at 75 DAS, overestimating by 22% the field observation (3.82 m2 m-2 at 86
DAS). These results are superior those found by DALLACORT et al. (2011), who observed a
maximum simulated LAI of 2.55 m2 m-2, testing the correlation between CS-CROPGRO estimates
and field observations conducted at various planting dates, in the city of Maringa - PR (Brazil). In another study, DALLACORT et al. (2005) studied different planting dates of beans, and observed a
maximum LAI of 3.34 m2 m-2 during the best growing season. However, these results are lower
than those observed by MEIRELES et al. (2002), who found IAFs of up to 6.47 m2 m-2 in
simulations.
The accumulated dry mass was underestimated by the model for all treatments except the CT-TENS (Figure 5), however, the simulations follow the course of observed data during the crop cycle. Thus, similarly for the variables previously analyzed, the parameterization of the genetic
coefficients was suitable, as given by maximum values for RMSE of 1,613 kg ha-1, MEE of 1,335
kg ha-1, and R-values ranging from 0.91 to 0.95.
Dr
y biom
ass
(kg h
a
-1 )
Days after sowing
The largest estimates of dry matter production were found under NT, reaching 7,466 kg ha-1 at
100 DAS, regardless of irrigation scheduling method. In field, CT-CAP and CT-TENS showed the
highest and lowest biomass production, reaching yields of 10,614 kg ha-1 and 7,345 kg ha-1,
respectively, also at 100 DAS. The variations between simulated and observed values were of 0.9%, 18.5% 31.4% and 23.2%, for CT-TENS, NT-TENS, CT-CAP and NT-CAP, respectively. Yet, these values are higher than the ones reported by DALLACORT et al. (2005), in which it was simulated
an amount of 4,423 kg ha-1 for the best growing season in the Midwestern of the Paraná state.
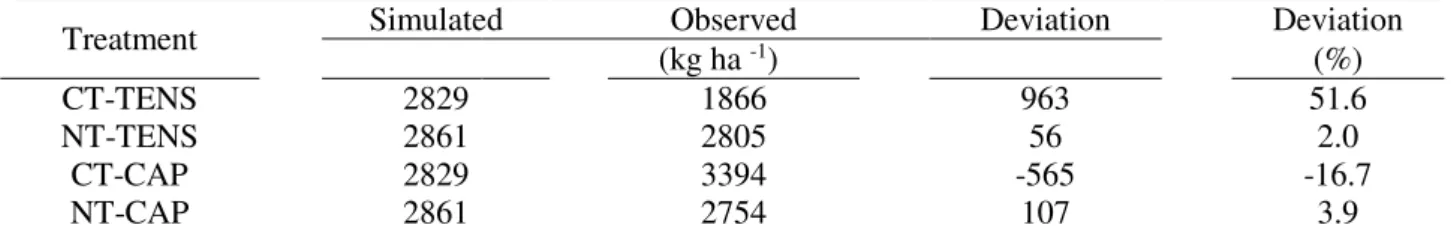
Grain yield estimates were close to the observed values, except in CT-TENS, which was overestimated in 51.6% by the model, when compared to field observation (Table 5). For the other treatments, there was a high correlation from estimates to the field-observed data, with variations of 2.0%, 16.7% and 3.9% for NT-TENS, CT-CAP and NT-CAP, respectively, thus highlighting the ability of the model to simulate crop yield.
TABLE 5. Grain yield of common beans, field-observed data vs. simulated data by CS-CROPGRO model during the testing phase.
Treatment Simulated Observed Deviation Deviation
(kg ha -1) (%)
CT-TENS 2829 1866 963 51.6
NT-TENS 2861 2805 56 2.0
CT-CAP 2829 3394 -565 -16.7
NT-CAP 2861 2754 107 3.9
% = [(Simulated – Observed) / Observed] x 100
DALLACORT et al. (2005) simulated yield of common beans Carioca cultivar, and found a
range of 2,127 kg ha-1 to 3,197 kg ha-1. Likewise, MEIRELES et al. (2002), calibrating and testing
the model CS-CROPGRO for Carioca beans at varied planting row spacing and fertilizer doses, observed that simulations surpassed experimental data in 10.8% to 15.4%. In turn, DALLACORT et al. (2011) found a variation of up to 29%.
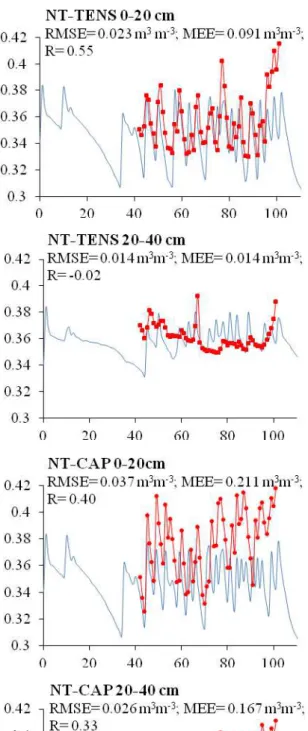
The model presented low accuracy in estimating soil moisture (Figure 6) with R-values reaching up to 0.55. There was a large gap between simulated mean values and field observations,
with MEE of up to 0.21 m3 m-3. Regarding accuracy, the simulation showed a low degree of
proximity to the field values, evidenced by RMSE values that ranged from 0.014 m3 m-3 until 0.037
m3 m-3. Overall, the model underestimated the experimentally observed values.
Using CS-CROPGRO to simulate soil moisture in common beans, DALLACORT et al. (2010) found correlation coefficients of 0.70 and 0.74. Nonetheless, they still point out for differences between predictions and values measured in field with TDR. In line with this, other published reports have associated such discrepancy to inefficiency of the model in predicting water absorption and redistribution throughout the soil (FARIA & BOWEN, 2003; DALLACORT et al., 2011).
S
oil
moi
sture
(m
3 m -3 )
Days after sowing
CONCLUSIONS
The calibrated model could satisfactorily simulate phenology, leaf area, dry matter and grain yield during calibration and testing, for common beans grown under no-till and conventional till systems, combined with irrigation scheduling with tensiometer and class A pan.
The fitting between simulations and soil moisture field-observations did not show the same performance as the other variables.
REFERENCES
ALVES, M.E.B.; ANDRADE, C.L.T.; CÁRDENAS, R.R.; AMARAL, T.A.; SILVA, D.F. Identificação e quantificação do efeito de fatores ambientais na produtividade da cultura do milho
na região de JANAÚBA, MG. Revista Brasileira de Agricultura Irrigada, Fortaleza, v.5, n. 3,
p.188- 201, 2011.
CHEVARRIA, V.V.; DEL PONTE, E.M.; JAHNKE, S.M. Número de gerações de um percevejo e seu parasitoide e da severidade da ferrugem asiática em soja, simulados em cenários de clima e
manejo no norte do RS. Ciência Rural, Santa Maria, v.43, n.4, p.571-578, 2013.
DALLACORT, R.; FREITAS, P.S.L. de; FARIA, R.T. de; GONÇALVES, A.C.A.; JÁCOME, G.A.; REZENDE, R. Soil water balance simulated by CROPGRO-Drybean model for
edaphoclimatic conditions in Maringá. Revista Brasileira de Engenharia Agrícola e Ambiental,
Campina Grande, v.14, n.4, p.351–357, 2010.
DALLACORT, R.; FREITAS, P.S.L. de; FARIA, R.T.; GONCALVES, A.C.A.; REZENDE, R.; GUIMARÃES, R.M.L. Simulation of bean crop growth, evapotranspiration and yield in Paraná
State by the CROPGRO-Dry bean model. Acta Scientiarum Agronomy, Maringá, v.33, n.3,
p.429-436, 2011.
DALLACORT, R.; REZENDE, R.; FREITAS, P.S.L. de; FARIA, R.T. de; AZEVEDO, T.L. de F.; TELENTINO JÚNIOR, J.B. Utilização do modelo Cropgro-drybean na determinação das melhores
épocas de semeadura da cultura do feijão para a região de Maringá, Estado do Paraná, Brasil. Acta
Scientiarum Agronomy, Maringá, v.27, n.2, p.349-355, 2005.
FARIA, R.T. de; BOWEN, W.T. Evaluation of DSSAT soil-water balance module mnder cropped
and bare soil conditions. Brazilian Archives of Biology and Technology, Curitiba, v.46, n.4,
p.489-498, 2003.
FARIA, R.T. de; OLIVEIRA, D.; HOOGENBOOM, G. Drybeans development and yield
simulation by CROPGRO . Annual Report of the Bean Improvement Cooperative, Michigan
State University, East Lansing,v.45, n.1, p.132-133, 2002.
GOMES, A.W.A.; SAAD, J.C.C.; BARROS, A.C. Simulação da produtividade de cana–de-açúcar
(Saccharum officinarum L.) na região Nordeste do Brasil, utilizando o modelo DSSAT. Irriga,
Botucatu, v.19, n.1, p.160-173, 2014.
HOOGENBOOM, G.J.W.; JONES, P.W.; WILKENS, C.H.; PORTER, K.J.; BOOTE, L.A.; HUNT, U.; SINGH, J.L.; LIZASO, J.W.; WHITE, O.; URYASEV, F.S.; ROYCE, R.; OGOSHI,
A.J.; GIJSMAN, G.Y.; TSUJI, AND J. KOO. Decision support system for agrotechnology
transfer: version 4.5. Honolulu: University of Hawaii, 2012. CD-ROM.
LARA, M.A.; PEDREIRA, C.G.; BOOTE, K.J.; PEDREIRA, B.C.; MORENO, L.S.;
ALDERMAN, P.D. Predicting growth of Panicum maximum: An adaptation of the
CROPGRO-Perennial Forage Model. Agronomy Journal, Madison, v.104, n.3, p. 600-611, 2012.
LIMA FILHO, A.F.; COELHO FILHO, M.A.; HEINEMANN, A.B. Determinação de épocas de
semeadura do feijão caupi no Recôncavo Baiano através do modelo CROPGRO. Revista
LIU, H.L.; YANG, J.Y.; TAN, C.S.; DRURY, C.F.; REYNOLDS, W.D.; ZHANG, T.Q.; BAI, Y.L.; JIN, J.; HE, P.; HOOGENBOOM, G. Simulating water content, crop yield and nitrate-N loss under free and controlled tile drainage with subsurface irrigation using the DSSAT model.
Agricultural Water Management, Amsterdam, v.98, n.6, p.1105–1111, 2011.
LOPES, A. da S. Manejo do solo e da irrigação da cultura do feijoeiro sob pivô central. 2006.
141f. Tese (Doutorado) – Faculdade de Ciências Agrárias e Veterinárias, Jaboticabal, Universidade
Estadual Paulista, Jaboticabal, 2006.
MARIN, F.R.; SINGELS, A.; ROYCE, F.; ASSAD, E.D.; PELLEGRINO, G.Q.; JUSTINO, F.
Climate change impacts on sugarcane attainable yield in Southern Brazil. Climatic Change,
Dordrecht, v. 117, n. 1-2, p. 227-239, 2013.
MEIRELES, E.J.L.; PEREIRA, A.P.; SENTELHAS, P.C.; STONE, L.F.; ZIMMERMANN, F.J.P. Calibration and test of the cropgro-dry bean model for edaphoclimatic conditions in 402 the
savannas of central Brazil. Scientia Agricola, Piracicaba, v.59, n.4, p.723-729, 2002.
NASSIF, D.S.P.; MARIN, F.R.; PALLONE FILHO, W.J.; RESENDE, R.S.; PELLEGRINO, G.O. Parametrização e avaliação do modelo DSSAT/Canegro para variedades brasileiras de
cana-de-açúcar. Pesquisa agropecuária brasileira, Brasília, v.47, n.3, p.311-318, 2012.
OLIVEIRA, E.C. de; COSTA, J.M.N. da; PAULA JÚNIOR, T.J. de; FERREIRA, W.P.M.;
JUSTINO, F.B.; NEVES, L. de O.The performance of the CROPGRO model for bean (Phaseolus
vulgaris L.) yield simulation. Acta Scientiarum. Agronomy, Maringá, v.34, n.3, p.239-246, 2012.
PEDREIRA, B.C.; PEDREIRA, C.G.S.; BOOTE, K.J.; LARA, M.A.S.; ALDERMAN, P.D.
Adapting the CROPGRO perennial forage model to predict growth of Brachiaria brizantha. Field
Crops Research, Amsterdam, v.120, n.3, p.370-379, 2011.
RODRIGUES, R. de A.; PEDRINI, J.E.; FRAISSE, C.W.; FERNANDES, J.M.C.; JUSTINO, F.B.; HEINEMANN, A.B.; COSTA, L.C.; VALE, F.X.R. do. Utilization of the cropgro-soybean model
to estimate yield loss caused by Asian rust in cultivars with different cycle. Bragantia, Campinas,
v.71, n.2, p.308-317, 2012.
WILLMOTT, C.J.; MATSUURA, K. Advantages of the mean absolute error (MAE) over the root
mean square error (RMSE) in assessing average model performance. Climate Research,