Paulo Jorge de Oliveira Ponte de Souza(1), José Renato Bouças Farias(2),
José Paulo Mourão de Melo e Abreu(3), Aristides Ribeiro(4), Edson José Paulino da Rocha(5), Marcel do Nascimento Botelho(1) and Adriano Marlisom Leão de Sousa(1)
(1)Universidade Federal Rural da Amazônia, Caixa Postal 917, CEP 66077‑530 Belém, PA, Brazil. E‑mail: [email protected], [email protected], [email protected] (2)Embrapa Soja, Caixa Postal 231, CEP 86001‑970 Londrina, PR, Brazil. E‑mail: [email protected] (3)Instituto Superior de Agronomia, CEP 1349‑17 Lisboa, Portugal. E‑mail: [email protected] (4)Universidade Federal de Viçosa, Departamento de Engenharia Agrícola, CEP 36570‑000 Viçosa, MG, Brazil. E‑mail: [email protected] (5)Universidade Federal do Pará, Faculdade de Meteorologia, Caixa Postal 1.611, CEP 66075‑110 Belém, PA, Brazil. E‑mail: [email protected]
Abstract – The objective of this work was to parameterize, calibrate, and validate a new version of the soybean growth and yield model developed by Sinclair, under natural field conditions in northeastern Amazon. The meteorological data and the values of soybean growth and leaf area were obtained from an agrometeorological experiment carried out in Paragominas, PA, Brazil, from 2006 to 2009. The climatic conditions during the experiment were very distinct, with a slight reduction in rainfall in 2007, due to the El Niño phenomenon. There was a reduction in the leaf area index (LAI) and in biomass production during this year, which was reproduced by the model. The simulation of the LAI had root mean square error (RMSE) of 0.55 to 0.82 m2 m-2, from 2006 to 2009. The simulation of soybean yield for independent data showed a RMSE of 198 kg ha-1, i.e., an overestimation of 3%. The model was calibrated and validated for Amazonian climatic conditions, and can contribute positively to the improvement of the simulations of the impacts of land use change in the Amazon region. The modified version of the Sinclair model is able to adequately simulate leaf area formation, total biomass, and soybean yield, under northeastern Amazon climatic conditions.
Index terms: Glycine max, Amazon region, climate models, leaf area index, soybean crop expansion, yield simulation.
Simulação do crescimento e da produtividade da soja nas condições
climáticas do nordeste da Amazônia
Resumo – O objetivo deste trabalho foi parametrizar, calibrar e validar uma nova versão do modelo de crescimento e de produtividade da soja desenvolvido por Sinclair, em condições naturais de campo no nordeste da Amazônia. Os dados meteorológicos e os valores de crescimento e de área foliar da soja foram obtidos em um experimento agrometeorológico realizado em Paragominas, PA, de 2006 a 2009. As condições climáticas durante o experimento foram muito distintas, com uma ligeira redução na precipitação em 2007, em virtude do fenômeno El Niño. Houve redução no índice de área foliar (IAF) e na produção de biomassa neste ano, a qual foi reproduzida pelo modelo. A simulação do IAF apresentou raiz do erro quadrado médio (REQM) de 0,55 a 0,82 m2 m-2,de 2006 a 2009. A simulação da produtividade da soja para os dados independentes apresentou um REQM de 198 kg ha-1, ou seja, uma superestimativa de 3%. O modelo encontra-se calibrado e validado para as condições climáticas da Amazônia e pode contribuir positivamente para a melhoria das simulações dos impactos da mudança de uso da terra na região amazônica. A versão modificada do modelo de Sinclair simula adequadamente a formação de área foliar, a biomassa total e a produtividade da soja, nas condições climáticas do nordeste da Amazônia.
Termos para indexação: Glycine max, região Amazônica, modelos climáticos, índice de área foliar, expansão da cultura da soja, simulação de produtividade.
Introduction
The Amazonian agricultural frontier is advancing at an increasing rate, mainly due to the expansion of soybean [Glycine max (L.) Merr.] crops (Fearnside, 2001). Currently, there is a widespread concern regarding the impact of forest replacement by soybean
crops, specifically when incorporated into regional
climate models (RCM).
The state of Pará, Brazil, has been receiving financial
support from the government since 1994 to increase grain production, particularly in the cities of Santarém and Paragominas. In the 2007/2008 crop season, the cultivated area with grains in both cities was 53,000 and 70,000 ha, with a total grain production of 154,000 and 201,000 tons, respectively (Companhia Nacional de Abastecimento, 2010). By 2008, Paragominas was part of a list of 43 cities with the highest rate of deforestation in the Amazon; however, in 2010, it was removed from this list due to the efforts of the local government to prevent and control deforestation (Brito et al., 2010).
Even though high levels of rainfall, high temperatures, and the high probability of pests and diseases hinder the expansion of soybean crops in the Amazon (Tecnologias de produção de soja, 2008), the development of new cultivars less sensitive to high temperatures and especially to the photoperiod allowed the expansion of soybean production to low latitude areas (Sinclair et al., 2005). Therefore, modeling in soybean under these weather conditions is a useful tool for farmers, as a research support in plant breeding, for crop management decision-making, and for policy-makers, as a support tool, regarding the ecological-economic zoning that is being implemented in the Amazon region.
The use of scientific tools would provide a better
analysis of the potential areas for soybean production in northeastern Pará, avoiding the search for new areas and, consequently, reducing deforestation. These tools can also be used to identify new areas with yield potential for similar crops, including cowpea [Vigna unguiculata (L.) Walp.], improving the competitiveness of the region in relation to other states, such as Mato Grosso, a traditional grain producer (Rebello et al., 2011).
Two widely used soybean growth models, Soycros-soybean crop simulator (Penning de Vries et al., 1992) and Cropgro-soybean model (Boote et al., 2003), have been evaluated over a broad range of environmental conditions, with satisfactory results in the simulation
of water deficit effects (Dogan et al., 2007) and of crop
development duration (Kantolic et al., 2007).
In crop model classification, simplified mechanistic models are defined as a class with an intermediate level of complexity and coefficient numbers (Streck & Alberto,
2006; Sinclair et al., 2007), which uses a reduced spread of information (Sinclair et al., 2003). These models are
composed of robust mathematical functions and can be used in various situations, being an intermediate implementation between regression (empirical) and more complex models (process models).
The objective of this work was to parameterize, calibrate, and validate a new version of the soybean growth and yield model developed by Sinclair, under
natural field conditions in northeastern Amazon.
Materials and Methods
The experiment was carried out in Paragominas, northeastern Pará, Brazil (2º59'08"S, 47º19'57"W, at
122 m above mean sea level), in a 200‑ha field, sown with
soybeans, located about 320 km from the city of Belém.
The soil is classified as Xanthic Hapludox (Latossolo
Amarelo), with 71% of clay content. The volumetric water content was 0.43 m3 m-3 at field capacity, and
0.19 m3 m-3 at wilting point. The soil was tilled in the rainy
season, and the whole area was mechanically sown with the cultivar BRS Tracajá (intermediate maturity), which is highly recommended for this region (Tecnologias de produção de soja, 2008). Plant density was 200,000 plants per hectare at row spacing of 0.50 m. Prior to sowing, seeds were treated with adequate rhizobium inoculant, fungicides, and insecticides. The sowings were carried out on 2/5/2006, 2/23/2007, and 2/7/2008, at a rate of 26– 28 seeds per square meter. At planting, a NPK fertilizer (7:70:63 kg ha-1) was applied to the soil surface. The
harvest occurred on 6/15/2006, 6/21/2007, and 6/6/2008. A three-meter-high instrumented micrometeorological tower was installed in the center of the experimental area. Meteorological sensors were connected to a AM416
mul-tiplex (Campbell Scientific, Inc., Logan, Utah) control
-led by a CR10X datalogger (Campbell Scientific, Inc., Logan, Utah). The scanning rate was 10 s, and the total
and average values were performed every 10 min.
Data for growth analyses were collected weekly,
starting ten days after sowing. Plant samples consisted of randomly chosen 1,0 m rows, with six replicates. All samples were kept in paper bags from harvest until processing in the laboratory. The samples were separated
into leaves, stems, petioles, flowers, and pods, and were
oven-dried at 70ºC. At maturity (R8), yield was measured by harvesting a 1,0 m-2 area, with six replicates. The
Leaf area was estimated by the disc method (Benincasa, 2003). Thirty discs were collected in each replicate, oven-dried, and weighed. The leaf area index (LAI) was estimated by taking into account these measurements and leaf dry weight. Crop evapotranspiration was measured in 2006 and 2007 by the Bowen-ratio technique, following the recommendations of Perez et al. (1999), in order to provide data for the parameterization and calibration of the crop evapotranspiration process.
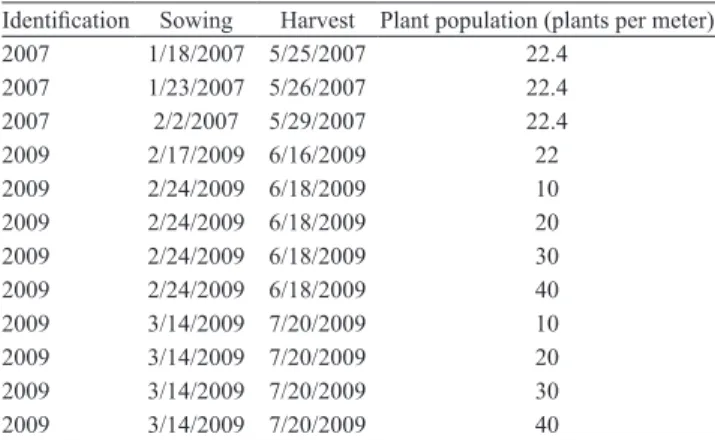
Model validation was based on the 2008 experiment, which had an independent data set. Simulated LAI, total aboveground biomass, and seed growth were compared with data measured throughout the 2008 soybean growing season to evaluate the performance of the crop growth model. Twelve extra trials were carried out in
2007 and 2009, as an independent data set, to assess final
yield simulated by the model. Information on sowing and harvest dates regarding the independent data set is shown in Table 1.
The model used in this study is a modified version of
the soybean growth and yield model developed by Sinclair et al. (2003), which is considered a phenomenological model, i.e., is representative of general phenomena instead of being a detailed description of the mechanisms involved in crop growth. Sinclair’s model was calibrated and validated for different agro-ecological conditions
with good performance in simulating soybean final yield in Argentina (Sinclair et al., 2007), Australia (Muchow &
Sinclair, 1986), France (Wolf, 2002), and South Brazil, in the states of Paraná (Sinclair et al., 2003) and Rio Grande
do Sul (Streck & Alberto, 2006).
The original model was modified in response to
problems detected in the evaluation process, probably
due to the specific characteristics of the Amazonian
environment. Three main problems were found: crop evapotranspiration was seriously underestimated; the course of leaf area index was not simulated properly, resulting in concomitant discrepancies in the course
of dry matter (DM); and phenology was not predicted.
To avoid these systematic errors, data set generated in 2006 and 2007 were used for the parameterization and calibration of the model. Soybean growth data obtained in 2008 were also used for model validation. In this study, the comparison between the performances of the original
model and of the modified version was done during the
calibration of the evapotranspiration simulations (2006 and 2007), since this is the most important variable that controls all of the processes simulated by the soybean growth model.
The original version of the model requires the occurrence dates of certain developmental stages as input information, but does not include a module of phenological
development. In the modified version, soybean phenology
was parameterized based on the degree-days theory, and the developmental stages were simulated using a normalized thermal time scale (θ), in which thermal time was calculated according to the saw-tooth model, and the measured thermal times (TT) for phases R1, R3, R5, and R6 were normalizers (Penning de Vries et al., 1992; Ferreira et al., 1997). The photoperiodic correction was not accounted for, since it is unnecessary for the cultivars used in northern Brazil (Sinclair et al., 2005).
Sinclair’s model simulates leaf growth as a function of mean daily temperature by the plastochron index, which is linearly related to the mean daily temperature
(Sinclair et al., 2003). In the modified version, the leaf
area was parameterized and simulated as a function of
DM accumulated in leaves (∆L) multiplied by the specific
leaf area (SLA). The amount of DM allocated daily to
leaves was obtained according to Vieira et al. (2009)
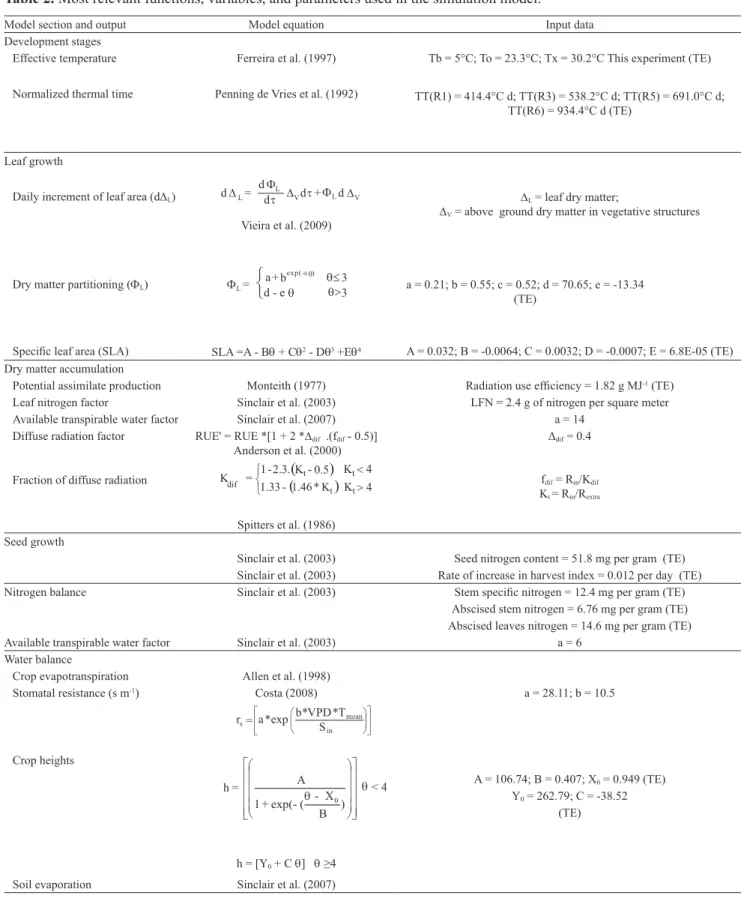
(Table 2). The fraction of DM in leaves (ΦL) and SLA are functions of normalized thermal time (θ). These functions and the parameter values are shown in Table 2. The daily increment of leaf area is modulated by the amount of
DM formed, which may be reduced in comparison to a
potential value by lower levels of water in the soil and by plant nitrogen (N) concentration.
Biomass accumulation is related to radiation use
efficiency (RUE) and to the radiation intercepted by the
crop, which is calculated as a function of the LAI and the
extinction coefficient.
Table 1. Extra trials of independent data set to assess final
yield for model validation.
Identification Sowing Harvest Plant population (plants per meter) 2007 1/18/2007 5/25/2007 22.4
RUE decreases when the soil becomes sufficiently
dehydrated, depending on the fraction of transpirable soil
Table 2. Most relevant functions, variables, and parameters used in the simulation model.
Model section and output Model equation Input data
Development stages
Effective temperature Ferreira et al. (1997) Tb = 5°C; To = 23.3°C; Tx = 30.2°C This experiment (TE)
TT(R1) = 414.4°C d; TT(R3) = 538.2°C d; TT(R5) = 691.0°C d; TT(R6) = 934.4°C d (TE)
Normalized thermal time Penning de Vries et al. (1992)
Leaf growth
Daily increment of leaf area (d∆L)
Vieira et al. (2009)
∆L = leaf dry matter;
∆V = above ground dry matter in vegetative structures
Dry matter partitioning (ΦL)
a = 0.21; b = 0.55; c = 0.52; d = 70.65; e = -13.34 (TE)
Dry matter partitioning (ΦL)
Specific leaf area (SLA) SLA =A - Bθ + Cθ2 ‑ Dq3 +Eθ4 A = 0.032; B = ‑0.0064; C = 0.0032; D = ‑0.0007; E = 6.8E‑05 (TE)
Dry matter accumulation
Potential assimilate production Monteith (1977) Radiation use efficiency = 1.82 g MJ-1 (TE)
Leaf nitrogen factor Sinclair et al. (2003) LFN = 2.4 g of nitrogen per square meter Available transpirable water factor Sinclair et al. (2007) a = 14
Diffuse radiation factor RUE' = RUE *[1 + 2 *∆dif .(fdif - 0.5)]
Anderson et al. (2000)
Δdif = 0.4
fdif = Rin/Kdif
Kt = Rin/Rextra
Fraction of diffuse radiation
Spitters et al. (1986) Seed growth
Sinclair et al. (2003) Seed nitrogen content = 51.8 mg per gram (TE) Sinclair et al. (2003) Rate of increase in harvest index = 0.012 per day (TE) Nitrogen balance Sinclair et al. (2003) Stem specific nitrogen = 12.4 mg per gram (TE)
Abscised stem nitrogen = 6.76 mg per gram (TE) Abscised leaves nitrogen = 14.6 mg per gram (TE) Available transpirable water factor Sinclair et al. (2003) a = 6
Water balance
Crop evapotranspiration Allen et al. (1998)
Stomatal resistance (s m-1) Costa (2008) a = 28.11; b = 10.5
Crop heights
A = 106.74; B = 0.407; X0 = 0.949 (TE)
Y0 = 262.79; C = -38.52
(TE)
h = [Y0 + C θ] θ ≥4
Soil evaporation Sinclair et al. (2007)
water (FTSW), in accordance with Sinclair & Ludlow
modulates the rate of N uptake in the vegetative and reproductive phases (Sinclair et al., 2003).
In the original model, the daily N uptake is set to
zero when the soil is flooded (FTSW>1), as described
by Sinclair et al. (2003). Since this phenomenon is common in the Amazon region, two different empirical penalizations were included in the model, depending on the phase in which it occurs, to represent real situations, according to Scott et al. (1989). Whenever the FTSW was above 1, N uptake simulated by the model was reduced by 18% and 26%, before and after
flowering, respectively.
Soil evaporation and plant transpiration are also simulated by this module. The FTSW is calculated as the ratio between the actual quantity of transpirable water and the total potential transpirable water. The amount of daily transpirable water decreases through soil evaporation and plant transpiration. Potential soil evaporation was calculated by Penman’s method. Soil evaporation was obtained by a correction based on the degree of radiation intercepted by the soil and on the time since the last rain, following Ritchie’s model (Sinclair et al., 2007).
In the original model, crop evapotranspiration was
estimated using the function defined by Tanner and Sinclair (Salado‑Navarro & Sinclair, 2009), which
was obtained with data from an extensive database.
However, the type of saturation vapor deficit (VPD),
normally found in the Amazon region, which is very low, was not included in Tanner and Sinclair’s database.
This function calculates DM under limiting conditions
as the product of a transpiration constant divided by the
VPD, which indicates that, under very low VPD, water use efficiencies are likely to be underestimated – this was confirmed by the measurements of evapotranspiration. To solve this problem, crop transpiration in the modified
version of the model was parameterized and obtained as a residue from the original Penman-Monteith method applied to soybean canopy and to aerodynamic resistances (Allen et al., 1998), which were estimated during the experiment (Table 2).
The statistical criteria used to analyze the simulations during the calibration and validation process were:
coefficient of determination (R2), root mean square
error (RMSE), efficiency coefficient of the model
(Ef), and index of agreement (d) developed by
Willmott (1985). The Ef and the d are as follows:
plant N concentration is also a determinant of RUE,
which decreases when N concentration is below a given
threshold. The calibrated RUE used in the modified model
is shown in Table 2. A constant value was used during the
entire season, because RUE between stages in this region did not differ significantly by the homogeneity test for
different regressions (Souza et al., 2009).
A parameterization function was included in the
modified model to simulate the dependence of RUE on
diffuse radiation, according to Anderson et al. (2000), since during the soybean cycle (rainy season) in the Amazonian region the incident radiation that reaches the soil surface is diffuse radiation. The fraction of diffuse radiation was obtained by the parameterization of Spitters et al. (1986), as a function of the clearness index. Biomass yield was divided into leaf and stem,
until the onset of the seed filling stage (R5).
The seed growth rate was simulated by the harvest index (HI), which increases linearly with time (Sinclair et al., 2007). As seeds develop, there is translocation of carbon and N to the grain. To simulate this, in the
modified model, some of the carbon and N reserves
were diverted to the grain, decreasing the amounts in assimilates and N pools in the vegetative parts of the plant (Sinclair et al., 2003). The initial plant N concentration was set to 0.065 g g-1 of N
2 (Sinclair
et al., 2003). The N concentration of several parts of the plant (green and yellow leaves, stems, and pods) was measured and included in the model (calibration values in Table 2). In the reproductive phase, the decrease in leaf N leads to leaf senescence and to the reduction of
leaf assimilation (Sinclair & De Wit, 1976).
The original model included an N balance subroutine, which was empirical and had to be calibrated for each environment, due to unknowns in soil N balance.
Sinclair et al. (2003), based on Jamieson & Semonov (2000), verified that biological fixation is able to compensate for eventual soil N deficiencies, avoiding difficulties in simulating soil N balance. Plant N
balance is simulated differently during the vegetative and reproductive phases, with a transition in phase R5. In the vegetative phase, N concentration is calculated
from biomass and specific N in vegetative parts, and
grain growth has priority for available N.
in which Pi is the predicted value, Oi is the observed
value, and Ō is the mean observed value.
Results and Discussions
The meteorological conditions observed during the calibration-validation experiments and the extra yield trials were very distinct, resulting in a wide range of observed yield for model validation (3,168 to 3,984 kg ha-1). Total rainfall over soybean growing
season (February–July) was 1,118 mm in 2006, 615 mm in 2007, 1,316 mm in 2008, and 2,006 mm in 2009.
The course of LAI was underestimated by the approach used in the original model, which considered plant leaf area as a function of the plastochron index when there are no water or nutrient limitations. Therefore, the LAI for a given plant density is governed by the phenological
stage or temperature regime. In the modified model, the
most widely used approach was adopted, which consists
in calculating LAI as the product of DM and SLA.
The simulated values of LAI were very close to those observed during the calibration (2006/2007) and validation (2008) processes (Figure 1). However, in all cases, after maximum leaf formation, the simulated LAI decreased faster than the observed values. The maximum LAI was 7% overestimated in 2007 (calibration data) and slightly underestimated in the other years (16% in 2006 for calibration, and 10% in 2008 for validation). Apparently, the model tends to slightly underestimate the LAI under wet conditions, especially after the end of leaf formation (θ = 2), and overestimate the LAI in drier conditions.
The swift decline in the LAI after maximum leaf area production (Figure 1) can be attributed to the linear increase in the HI during this phase, which linearly reduces leaf area due to the translocation of assimilates to the grain (Sinclair et al., 2007). When N uptake is inadequate for potential grain growth,
there is translocation from vegetative plant parts to the grain, which induces further leaf senescence (Sinclair
& De Wit, 1976). The modified model simulates the
maximum LAI (underestimation and overestimation under wet and dry conditions, respectively), and
can satisfactorily reproduce the mean LAI for the whole cycle, with high agreement index, high model
efficiency, low mean errors and low RMSE (Table 3). Despite the small discrepancy between predicted
versus observed LAI values for calibration (2006/2007)
and validation (2008) (Table 3), the modified model shows
good accuracy for the entire cycle, with elevated model
efficiency, index of agreement, absolute differences up to
18%, and low errors (RMSE).
The Penman-Monteith approach showed good estimates of crop evapotranspiration throughout the crop cycle during the 2006/2007 soybean-growing season;
the original approach (Salado‑Navarro & Sinclair,
2009) underestimated this variable (Figure 2).
The Ef obtained from the parameterization/
calibration was 0.91 in 2006 and 0.40 in 2007, indicating, respectively, a good and a reasonable agreement between simulations and observations.
Therefore, there was a significant improvement in the
simulation of this variable in comparison to the values obtained with the original model (-4.2 in 2006 and -4.5
in 2007), which is confirmed by the agreement index,
whose values were 0.47 in 2006 and 0.30 in 2007 for the original version of the model, and 0.97 in 2006 and
0.85 in 2007 for the modified version. The coefficients
of the linear regression between observed and simulated values also reinforce this improvement (Figure 2).
Aboveground DM was lower in 2007 than in the
other years, due to lower rainfall amount in the growing
Table 3. Simulated and observed±standard error values of soybean leaf area index, total aboveground dry biomass production (g m-2), and soybean seed biomass (g m-2) over three soybean-growing seasons.
Year –O– ––P Diff (%) RMSE d Ef
Leaf area index
2006 (calibration) 3.85±0.65 3.15±0.58 -18 0.82 0.96 0.90
2007 (calibration) 1.62±0.34 1.82±0.37 +13 0.55 0.96 0.87
2008 (validation) 3.01±0.62 2.72±0.52 -10 0.67 0.97 0.93
Dry matter (g m-2)
2006 (calibration) 590.02±100 543.07±85 -8 92.2 0.99 0.98
2007 (calibration) 287.32±74 318.69±70 +11 62.8 0.98 0.97
2008 (validation) 496.85±95 521.58±90 +5 56.7 0.99 0.99
Seed biomass (g m-2)
2006 (calibration) 204.56±45 186.27±37 -9 50.7 0.98 0.96
2007 (calibration) 200.54±46 187.06±45 -7 19.4 0.99 0.99
2008 (validation) 215.22±50 199.42±43 -7 32.9 0.99 0.98
– – –
O, observed values; –––P , predicted values; Diff, relative difference from the observed values; RMSE, root mean square error; d, index of agreement; Ef,
efficiency coefficient of the model.
Figure 2. Daily crop evapotranspiration measured by the Bowen‑ration method versus crop evapotranspiration simulated by the
season (Figure 3). In general, the modified model simulated shoot DM very well, with some discrepancies in the grain‑filling phase in 2006 (θ = 3). A comparison of the predicted versus observed values for calibration (2006/2007) and validation (2008) are shown in Table 3. The model was able to reproduce adequately the total
DM over the soybean‑growing season during calibration
and validation. It also simulated the decrease in biomass production, caused by the reduction in water availability in 2007. The absolute errors found varied from -8 to +11%, and RMSE values from 57 to 92 g m-2 (Table 3). The
model efficiency coefficients obtained during calibration
and validation were higher than 0.90, which indicates a good agreement between simulated and observed data.
The effect of increased cloudiness on RUE was
introduced in the new version of the model (Anderson
et al., 2000). During rainy and cloudier years,
this allows a more accurate estimation of soybean
efficiency in radiation use due to the increase in the
diffuse component. This process contributed to the improvement of the simulation among the years studied (Table 3).
The modified model simulated very well the time course of soybean yield and final yield (Figure 4).
In 2006 (calibration experiment), the model slightly
underestimated the course of seed DM production, but the
simulated values were still in the ±SE range of final yield. In the other crop years, i.e., calibration and validation experiments (2007 and 2008, respectively), grain growth
was simulated accurately, although DM and LAI were
overestimated.
The underestimation of soybean yield in wet years (2006 and 2008) and the overestimation in dry years (2007) may be associated with the penalization, in the model,
of N balance imposed by flooding (Scott et al., 1989). Therefore, daily N uptake by biologic fixation occurred at
a slower rate under wet conditions. By reducing plant N content, a decrease is expected in biomass production and
final yield, since during seed growth there is translocation
of assimilates and N from the vegetative part of the plant
to the grain (Sinclair & De Wit, 1976).
Bacanamwo & Purcell (1999) found that the application
of N in soybean as a fertilizer makes the culture less
sensitive to water flooding than when biological fixation is the sole source of N for the plant. Under such conditions,
the nitrate from the fertilizer is used as an alternative to the absence of oxygen, acting as an electron acceptor
by the roots experiencing flooding (Bacanamwo &
Purcell, 1999). In all experiments, there was soil nutrient supplementation with NPK fertilizer, which may have
mitigated the effect of possible flooding, but unfortunately
this was not taken into account by the model.
The new version of the model reproduced very well the effect of water reduction in the production of soybean biomass and yield. The lowest simulated values occurred in conditions of low water availability
(2007), in agreement with the values observed in the
fi eld. However, drought effects were not signifi cant in fi nal yield simulation, reaching 3,273 kg ha-1 in
2007 (calibration), and 3,504 and 3,479 kg ha-1 in
2006 (calibration) and 2008 (validation), respectively. The smaller simulated leaf area in 2007 (Figure 1)
probably reduced the evapotranspiration rate, mainly during maximum water consumption, keeping soil
water uptake and N fi xation rate at satisfactory levels, without affecting the simulated fi nal yield (Muchow &
Sinclair, 1986).
In 2007, drought caused the decrease of the observed
LAI during the fi rst growth periods (Figure 1), resulting
in lower observed biomass production (Figure 3) than
the simulated values. During the fi nal growth period, the
observed values for LAI and biomass production were
higher than the simulated ones. Thus, fi nal simulated
yield in 2007 was satisfactory because of the two compensating errors. This indicates that the interaction between drought and LAI development in the soybean model needs some improvement. A future possibility is the inclusion of a function of drought effect on the effective rooting depth, which is strongly related to soil water availability and, consequently, LAI reduction.
In the calibration (2006/2007) and validation (2008) processes, seed biomass simulations were underestimated; however, these errors are non
signifi cant, as indicated by the low values of absolute
errors and RMSE, and the elevated values of model
effi ciency and index of agreement (Table 3).
In the extra independent yield data, the simulated
fi nal grain yield agreed closely with the observed
values (Figure 5). For all cases, the absolute error of the simulated values was within a ±10% range, a value generally considered in soybean yield simulation in South America (Mercau et al., 2007).
Figure 4. Simulated (––) and observed ( ) (±standard error) soybean seed biomass (g m-2) in the 2006 growing season, calibration (A); 2007 growing season, calibration (B); 2008 growing season, validation (C).
Figure 5. Validation of soybean yield simulation. ●, 2007
trial; , 2007 trial; ■, 2007 trial; ○, 2008 trial; ♂, 2009 trial; ♀, 2009 trial; + , 2009 trial; ▲, 2009 trial; ±, 2009 trial; #, 2009 trial; , 2009 trial; , 2009 trial; □, 2009 trial. —, +10%; — — —, ‑10%.
On average, the modified model had a very good performance in simulating final yield (Table 4), as
indicated by the Wilmott index of 0.88. The difference between the average simulated and observed values was 111 kg ha-1, i.e., an overestimation of 3%. In
spite of this difference, the model’s efficiency was
0.61, a reasonable agreement between simulated and observed data. The model was able to simulate soybean yield with 73% precision (R2) and 76%
accuracy (slope), although it showed additive errors (non-zero intercept).
The model’s calibration and validation process was successful. Therefore, it can be applied in different management types for optimal management of the Amazon region, including changes in sowing date, plant density, and irrigation, and can be used in future climate change studies and in similar grain cultures, such as cowpea.
The inclusion of similar models, which simulate, for example, vegetation dynamics, in atmospheric general circulation models, as done by Correia et al. (2006), could contribute positively to the improvement of the simulations of the impacts of land use change in the Amazon region, since many models do not take into account temporal evolution of vegetation.
Conclusions
1. The modified version of the Sinclair model
is able to adequately simulate leaf area formation, total biomass, and soybean yield, under northeastern Amazon climatic conditions.
2. The model reproduces satisfactorily the temporal evolution of soybean leaf area and biomass production, under the different climatic conditions observed during the experiment.
3. The model validation shows low errors for soybean
yield estimation and reasonable model efficiency coefficient, with differences between the observed and
simulated data within a 10% range.
Acknowledgements
To Conselho Nacional de Desenvolvimento Científico e Tecnológico, for financial support; to
Coordenação de Aperfeiçoamento de Pessoal de Nível
Superior, for scholarship granted; and to Dr. Robert Kowalski from the University of Wolverhampton, for
revising the article.
References
ALLEN, R.G.; PEREIRA, L.S.; RAES, D.; SMITH, M. Crop evapotranspiration: guidelines for computing crop water
requirements. Rome: Food and Agriculture Organization of the United
Nations, 1998. 300p. (FAO. Irrigation and drainage paper, 56).
ANDERSON, M.C.; NORMAN, J.M.; MEYERS, T.P.; DIAK,
G.R. An analytical model for estimating canopy transpiration and
carbon assimilation fluxes based on canopy light‑use efficiency.
Agricultural and Forest Meteorology, v.101, p.265-289, 2000.
BACANAMWO, M.; PURCELL, L.C. Soybean dry matter and N accumulation responses to flooding stress, N sources and hypoxia.
Journal of Experimental Botany, v.50, p.689-696, 1999. BENINCASA, M.M.P. Análise de crescimento de plantas: noções
básicas. Jaboticabal: UNESP, 2003. 41p.
BOOTE, K.J.; JONES, J.W.; HOOGENBOOM, G.; BATCHELOR,
W.D.; PORTER, C.H.; CROPGRO: plant growth and partitioning
model. In: JONES, J.W.; HOOGENBOOM, G.; WILKENS, P.W.;
PORTER, C.H.; TSUJI, G.Y. (Ed.). Decision support system for agrotechnology transfer (DSSAT). Honolulu: University of
Hawaii, 2003. v.4, p.1-102.
BRITO, B.; SOUZA JUNIOR, C.; AMARAL, P. Reducing
emissions from deforestation at municipal level: a case study of Paragominas, Eastern Brazilian Amazon. In: EVERYTHING is connected: climate and biodiversity in a fragile world. Brasília:
British Embassy; Department for Environment Food and Rural
Affairs, 2010. p.29-31.
COMPANHIA NACIONAL DE ABASTECIMENTO.
Acompanhamento da safra brasileira: grãos. 2010. Disponível
em: <http://www.conab.gov.br/conabweb/index.php?PAG=101>.
Acesso em: 05 maio 2010.
CORREIA, F.W.S.; ALVALÁ, R.C. dos S.; MANZI, A.O. Impacto das modificações da cobertura vegetal no balanço de água na
Amazônia: um estudo com Modelo de Circulação Geral da Atmosfera (MCGA). Revista Brasileira de Meteorologia, v.21, p.153-167, 2006.
Table 4. Statistical parameters of the soybean final yield model (kg ha-1) generated from the independent data sets used for validation.
– –
O ––P Diff Intercept Slope R2 RMSE d Ef
3,479.16±91 3,590.25±81 +3 950.40±483.04 0.76±0.12 0.73 197.66 0.88 0.61 –
–
O, average ±SE of observed values; ––P , average ±SE of predicted values; Diff, relative difference from the observed values; RMSE, root mean square error;
COSTA, J.P.R. Modelagem e simulação das interações biosfera‑atmosfera em plantio de soja na Amazônia. 2008. 127p.
Tese (Doutorado) – Universidade Federal de Viçosa, Viçosa. COSTA, M.H.; YANAGI, S.M.N.; SOUZA, P.J.O.P.; RIBEIRO,
A.; ROCHA, E.J.P. Climate change in Amazonia caused by soybean cropland expansion, as compared to caused by pastureland expansion. Geophysical Research Letter, v.34, 2007. Http:// dx.doi.org/doi:10.1029/2007GL029271.
DOGAN, E.; KIRNAK, H.; COPUR, O. Deficit irrigations during
soybean reproductive stages and CROPGRO-soybean simulations under semi-arid climatic conditions. Field Crops Research, v.103, p.154-159, 2007.
FEARNSIDE, P.M. Soybean cultivation as a threat to the
environment in Brazil. Environmental Conservation, v.28, p.23-28, 2001.
FERREIRA, M.E.; ABREU, J.P. de M. e; BIANCO, V.V.;
MONTEIRO, A. Predicting phasic development of green beans for processing using a model with high temperature reduction of thermal time accumulation. Scientia Horticulturae, v.69, p.123-133, 1997.
HOOGENBOOM, G. Contribution of agrometeorology to the simulation of crop production and its applications. Agricultural and Forest Meteorology, v.103, p.137-157, 2000.
JAMIESON, P.D.; SEMONOV, M.A. Modelling nitrogen uptake and
redistribution in wheat. Field Crops Research, v.68, p.21-29, 2000.
KANTOLIC, A.G.; MERCAU, J.L.; SLAFER, G.A.; SADRAS, V.O. Simulated yield advantages of extending post‑flowering development at the expense of a shorter pre‑flowering development
in soybean. Field Crops Research, v.101, p.321-330, 2007.
MERCAU, J.L.; DARDANELLI, J.L.; COLLINO, D.J.; ANDRIANI, J.M.; IRIGOYEN, A.; SATORRE, E.H. Predicting
on-farm soybean yields in the pampas using CROPGRO-soybean.
Field Crops Research, v.100, p.200-209, 2007.
MONTEITH, J.L. Climate and the efficiency of crop production
in Britain. Philosophical Transactions of the Royal Society of London. Series B: Biological Sciences, v.281, p.277-294, 1977.
MUCHOW, R.C.; SINCLAIR, T.R. Water and nitrogen limitations
in soybean grain production. II. Field and model analyses. Field Crops Research, v.15, p.143-156, 1986.
PENNING DE VRIES, F.W.T.; TIMSINA, J.; ALAGOS, M.J.C.; VELASCO, L.; PANDEY, R.K. Opportunities for soya beans after rice in the Philippines: an exploration by simulation.
Wageningen: CABO‑DLO, 1992. 60p. (CABO‑TT. Simulation
report, 25).
PEREZ, P.J.; CASTELLVI, F.; IBAÑEZ, M.; ROSELL, J.I. Assessment of reliability of Bowen ratio method for partitioning fluxes.
Agricultural and Forest Meteorology, v.97, p.141-150, 1999.
REBELLO, F.K.; COSTA, A.J.G.; FIGUEIRÓ, C.L.M. Conjuntura
da produção e comercialização do feijão-caupi no Nordeste Paraense: safra 2010. Contexto Amazônico, v.4, 2011. Disponível em: <http://
www.bancoamazonia.com.br/bancoamazonia2/includes%5Cinstituc
ional%5Carquivos%5Cbiblioteca%5Ccontextoamazonico%5Ccont
exto_amazonico_18.pdf >. Acesso em: 23 maio 2011.
SALADO‑NAVARRO, L.R.; SINCLAIR, T.R. Crop rotations in
Argentina: analysis of water balance and yield using crop models.
Agricultural Systems, v.102, p.11-16, 2009.
SCOTT, H.D.; DEANGULO, J.; DANIELS, M.B.; WOOD, L.S.
Flood duration effects on soybean growth and yield. Agronomy Journal, v.81, p.631-636, 1989.
SINCLAIR, T.R.; DE WIT, C.T. Analysis of the carbon and
nitrogen limitations to soybean yield. Agronomy Journal, v.68, p.319-324, 1976.
SINCLAIR, T.R.; FARIAS, J.R.; NEUMAIER, N.; NEPOMUCENO, A.L. Modeling nitrogen accumulation and use
by soybean. Field Crops Research, v.81, p.149-158, 2003.
SINCLAIR, T.R.; LUDLOW, M.M. Influence of soil water
supply on the plant water balance of four tropical grain legumes.
Australian Journal of Plant Physiology, v.13, p.329-421, 1986.
SINCLAIR, T.R.; NEUMAIER, N.; FARIAS, J.R.B.; NEPOMUCENO, A.L. Comparison of vegetative development
in soybean cultivars for low-latitude environments. Field Crops Research, v.92, p.53-59, 2005.
SINCLAIR, T.R.; SALADO‑NAVARRO, L.R.; SALAS, G.; PURCEL, L.C. Soybean yields and soil water status in Argentina:
simulation analysis. Agricultural Systems, v.94, p.471-477, 2007.
SOUZA, P.J. de O.P. de; RIBEIRO, A.; ROCHA, E.J.P. da; FARIAS, J.R.B.; LOUREIRO, R.S.; BISPO, C.C.; SAMPAIO, L. Solar radiation use efficiency by soybean under field conditions
in the Amazon region. Pesquisa Agropecuária Brasileira, v.44, p.1211-1218, 2009.
SPITTERS, C.J.T.; TOUSSAINT, H.A.J.M.; GOUDRIAAN, J.
Separating the diffuse and direct component of global radiation and its implications for modeling canopy photosynthesis. Part I. Components of incoming radiation. Agricultural and Forest Meteorology, v.38, p.217-229, 1986.
STRECK, N.A.; ALBERTO, C.M. Estudo numérico do impacto da mudança climática sobre o rendimento de trigo, soja e milho.
Pesquisa Agropecuária Brasileira, v.41, p.1351-1359, 2006. TECNOLOGIAS de produção de soja: região central do Brasil 2009 e 2010. Londrina: Embrapa Soja, 2008. 262p. (Embrapa Soja. Sistemas de Produção, 13).
VIEIRA, M.I.; DE MELO‑ABREU, J.P.; FERREIRA, M.E.; MONTEIRO, A.A. Dry matter and area partitioning, radiation interception and radiation‑use efficiency in open‑field bell pepper.
Scientia Horticulturae, v.121, p.404-409, 2009.
WILLMOTT, C.J.; ACKLESON, S.G.; DAVIS, R.E.; FEDDEMA, J.J.; KLINK, K.M.; LEGATES, D.R.; O’DONNELL, J.; ROWE,
C.M. Statistics for the evaluation and comparison of models.
Journal of Geophysical Research, v.90, p.8995-9005, 1985.
WOLF, J. Comparison of two soya bean simulation models under climate change. I. Model calibration and sensitivity analyses.
Climate Research, v.20, p.55-70, 2002.