http://www.uem.br/acta ISSN printed: 1806-2636 ISSN on-line: 1807-8672
Doi: 10.4025/actascianimsci.v39i1.32300
Forage systems mixed with forage legumes grazed by lactating
cows
Clair Jorge Olivo, Michelle Schalemberg Diehl*, Carlos Alberto Agnolin, Vinícius Felipe Bratz, Priscila Flôres Aguirre and Caroline Paim Sauter
Laboratório de Bovinocultura de Leite, Departamento de Zootecnia, Universidade Federal de Santa Maria, Santa Maria, Rio Grande do Sul, Brazil. *Author for correspondence. E-mail [email protected]
ABSTRACT. Current research evaluates productivity, stocking and nutritional rates of three forage systems with Elephant Grass (EG) + Italian Ryegrass (IR) + Spontaneous Growth Species (SGS), without forage legumes; EG + IR + SGS + Forage Peanut (FP), mixed with FP; and EG + IR + SGS + Red Clover (RC), mixed with RC, in rotational grazing method by lactating cows. IR developed between rows of EG. FP was maintained, whilst RC was sow to respective forage systems. The experimental design was completely randomized, with three treatments and two replication, subdivided into parcels over time. Mean rate for forage yield and average stocking rate were 10.6, 11.6 and 14.4 t ha-1; 3.0, 2.8 and 3.1 animal
unit ha-1 day-1, for the respective systems. Levels of crude protein and total digestible nutrients were 17.8,
18.7 and 17.5%; 66.5, 66.8 and 64.8%, for the respective forage systems. The presence of RC results in better and higher forage yield in the mixture, whilst FP results in greater control of SGS. The inclusion of forage legumes in pasture systems provides better nutritional rates.
Keywords: Arachis pintoi, Lolium multiflorum, Pennisetum purpureum, rotational grazing, Trifolium pratense.
Sistemas forrageiros consorciados com leguminosas sob pastej com vacas em lactação
RESUMO. O objetivo nesta pesquisa foi avaliar a produtividade, a taxa de lotação e o valor nutritivo de três sistemas forrageiros: capim elefante (CE) + azevém (AZ) + espécies de crescimento espontâneo (ECE), sem leguminosa; CE + AZ + ECE + amendoim forrageiro (AM), consórcio com AM; e CE + AZ + ECE + trevo vermelho (TV), consórcio com TV, em pastejo com lotação rotacionada utilizando vacas em lactação. Possibilitou-se o desenvolvimento do AZ entre as touceiras de CE. O AM foi preservado na área e o TV foi semeado, respectivamente para os sistemas forrageiros. O delineamento experimental foi inteiramente casualizado, com três tratamentos, duas repetições e parcelas subdividas no tempo. Os valores médios de produção e das taxas de lotação foram de 10,6; 11,6 e 14,4 t ha-1; 3,0; 2,8; e 3,1 unidades animal
ha-1 dia-1, para os respectivos sistemas. Os teores de proteína bruta e de nutrientes digestíveis totais foram
de 17,77; 18,70 e 17,45%; 66,47; 66,77 e 64,76% para os respectivos sistemas. O consórcio com TV resulta em melhor e maior produção de forragem, enquanto o consórcio com AM resulta em melhor controle de ECE. A inclusão de leguminosas forrageiras implica em melhor valor nutritivo do pasto.
Palavras-chave:Arachis pintoi, Lolium multiflorum, lotação rotacionada, Pennisetum purpureum, Trifolium pratense.
Introduction
Pastures constitute the main component of the animal’s diet in dairy livestock systems, especially in subtropical climate regions, where soil and climate conditions favor several forage species to grow at different times of the year (Moreira, Prado, Cecato, Wada, & Mizubuti, 2004; Silva et al., 2011). Among forage plants, Elephant grass stands out for its high forage accumulation potential, particularly for its longevity (Azevedo Junior et al., 2012a). In subtropical regions, its high productivity in the summer period and growth decrease during the winter period due to low temperatures causes great
variations in forage yield and nutritional value, limiting animal performance.
to the grass companion and extend the period of pastures usage (Assmann et al., 2007; Diehl et al., 2014). Despite its several advantages, the above mixture is still limited in rural properties due to a considerable lack of scientific studies on forage legumes subjected to grazing conditions (Steinwandter et al., 2009).
Current study investigates forage systems composed of Elephant grass, Italian ryegrass, spontaneous growing species and legumes; Forage peanut or Red clover subjected to rotational stocking grazing throughout the growing season, with regard to forage mass, dry matter yield, stocking rate and nutritional rates.
Material and methods
All techniques and procedures in current study were approved by the Committee for Ethics in Animal Experimentation of the Federal University of Santa Maria, Santa Maria RS Brazil (Protocol 23081016073 / 2011-27, Process 113/2011).
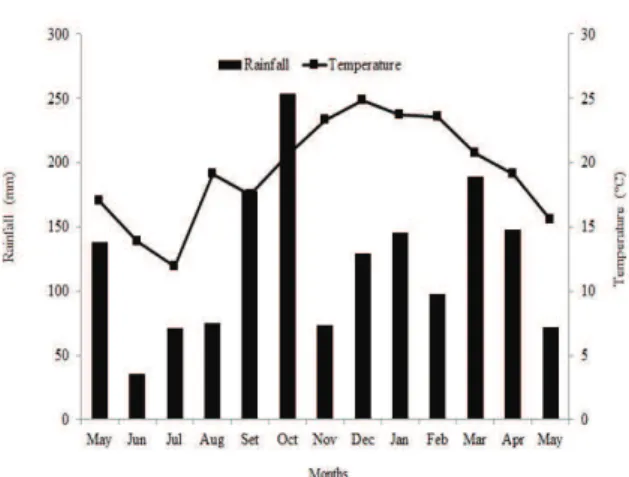
The study was carried out between May 2012 and May 2013, in an area owned by the Laboratório de Bovinocultura de Leite of the Universidade Federal de Santa Maria, in the central region of the state of Rio Grande do Sul, Brazil (29° 43'S and 53° 43'W). The study was carried out on Typic Hapludalf soil belonging to the São Pedro mapping unit (EMBRAPA, 2006); pH 5.5; 3% organic materials matter; 14 mg dm-3 phosphorus. Average monthly temperature and accumulated rainfall during the experimental period were 19.3°C and 1601 mm (Figure 1) respectively, with climate averages at 19.6° C and 1686 mm, respectively, for the past 30 years.
The experimental area comprised 0.78 ha, divided into six paddocks of 0.13 ha each. Evaluated forage systems were Italian ryegrass (Lolium multiflorum Lam., IR), cv. Common in winter; Elephant grass (Pennisetum purpureum Schum., EG), cv. Merckeron Pinda, in summer. In the case of the legume grass system in two paddocks, the Forage peanut cv. Amarillo (Arachis pintoi Krap. and Greg., FP), established in 2006 was maintained; and in two other paddocks inoculated and scarified seeds of Red clover (Trifolium pratense L., RC), cv. Estanzuela 116, with 86% germination were sown in May 2011, at a rate of 6 kg ha-1. The Italian ryegrass grew by natural reseeding between the clumps of Elephant grass established since 2004 in rows 4 m apart, throughout the entire trial area. Treatments consisted of IR + EG without legumes; IR + EG + FP, mixed with Forage peanut; IR + EG + RC, mixed with Red clover.
Figure 1. Cumulative rainfall and average monthly air temperature between May 2012 and May 2013, Santa Maria, Brazil.
Evaluated parameters comprised pre-grazing forage mass, botanical and structural composition, accumulation rate and forage yield, stocking rate and apparent forage intake. Crude protein (CP), neutral detergent fiber (NDF), and in situ digestibility of organic matter (ISOMD) were also assessed.
Acidity comprised corrected limestone, potassium and phosphorus fertilization, were carried out according to soil analysis. The urea-based nitrogen fertilizer rate was 93 kg ha-1 of N, divided into four applications, with the first application 30 days after the emergence of Italian ryegrass in June and the remaining applications in August, December and March.
The criteria for the use of pastures were sward height with approximately 20 cm for Italian ryegrass in winter and 100-120 cm for Elephant grass in summer. Herbage samples were collected prior to the animal’s access to the pastures. Samples were dried in a ventilated oven at 55°C to constant weight and ground in a 2 – 1 mm Willey mill sieve. Dry matter (DM) contents were determined by drying at 105° C for 8 hours. Ash contents were determined by combustion at 600°C for 4 hours and organic matter (OM) by their difference (adapted from AOAC (2005).
present between the rows formed by clumps of Elephant grass.
Selected grazing method was rotational stocking with 1-day occupation by lactating Holstein cows, with body weight (BW) and average yield of 573 kg and 17 kg of milk day-1, respectively. Cows were milked twice a day, at 7:30 and 16:00, remaining on the pastures from 9:00 to 15:30 and from 18:00 to 7:00. Each animal received a daily 0.9% BW of concentrate as diet supplement, comprising 16-18% crude protein (CP) and 65% total digestible nutrients (TDN). The concentrate was made with maize grain, wheat bran, soybean meal, vitamin and mineral premix.
Stocking rate was based on forage mass (pre-grazing) so that herbage allowance was approximately 4 kg DM 100 kg BW-1 for leaf blade mass of Elephant grass and of 6 kg DM 100 kg BW-1 for the forage mass between Elephant grass rows. When animals were removed from pasture, the sampling procedure was repeated to calculate forage mass (post-grazing). Grazing was repeated when forage again reached the recommended height.
Initial forage mass (pre-grazing) was subtracted from the residual forage mass (post-grazing) of the previous grazing to determine forage accumulation. Daily accumulation rate was determined by dividing forage accumulation by the number of days between grazing cycles. Forage yield was calculated by adding forage accumulation in each grazing range. Forage intake was estimated by the method of agronomic difference, or rather, by subtracting the mass of residual forage (post-grazing) from the initial forage mass (pre-grazing), divided by stocking density.
Samples were collected by hand plucking technique, at the beginning and end of each grazing period to determine the forage variables of nutritional rates. The material was mixed in proportional amounts and a subsample extracted for analysis. The results of nutritional value analyses were grouped according to season, with two grazing cycles for each. Total nitrogen (N) was determined by the Kjeldahl method (Method 984.13; AOAC (2005) and a correction factor of 6.25 was used for the conversion of N into CP. NDF (Van Soest, Robertson, & Lewis, 1991) and in situ organic matter digestibility (ISOMD) were also determined (Mehrez & Orskov, 1977), whilst estimated NDT was obtained by organic matter percentage times ISOMD and divided by 100 (NRC, 2000).
The experimental design was completely randomized, with three treatments (forage systems), two replications (paddocks) and split plots (grazing periods). Data were subjected to analysis of variance
and means were compared by Tukey´s test at 5% error probability, using the MIXED procedure (SAS, 2004). Statistical model for the analysis of the studied variables was represented by: Yijk = m + Ti + Rj(Ti) + Gk + (TG)ik + Eijk, where: Yijk is the dependent variables; i treatment index (forage systems); j repetition indexes (paddocks); k grazing cycle index; m average of all observations; Ti effect of treatments; Rj (Ti) = effect of repetition in treatments (error a); Gk = effect of grazing cycles; (TG)ik = interaction between treatments and the grazing cycles; Eijk the residual experimental error (error b).
Results and discussion
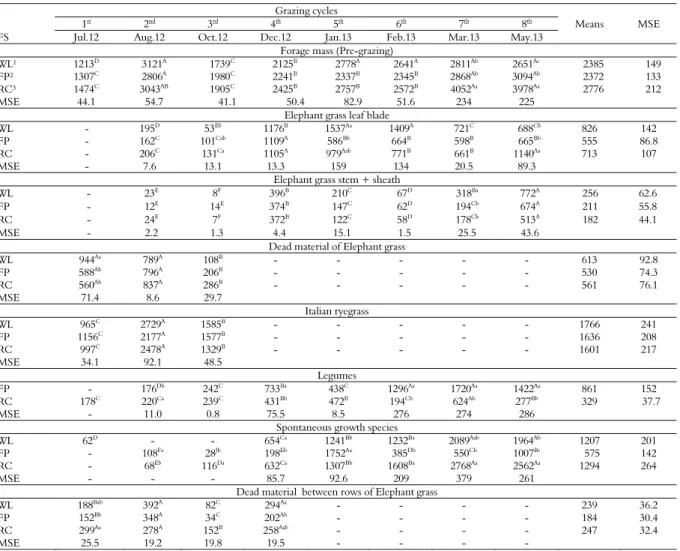
Eight grazing cycles were carried out during the 364-days experimental period (Table 1), with a mean interval of 38 days (± 12), and two grazing cycles in each season. In the case of forage mass (pre-grazing), difference (p ≤ 0.05) occurred only in grazing during May with a higher rate for mixtures, indicating a possible residual effect of the legumes (Table 1). The mixture´s improved performance in the autumn is important since it is a critical period in southern Brazil with its usual shortage of pasture. Among the grazing cycles, the lowest herbage mass rate occurred in July, due to Elephant grass seasonality, and in October as a result of mowing done in August. The average forage mass was 2.5 t ha-1, which was lower than hat reported by Azevedo Junior et al. (2012b), or rather, 3.5 t ha-1, in similar systems with Elephant grass, Italian ryegrass and mixture with Forage peanut or Red clover, but with higher amounts of nitrogen fertilizer.
As expected, rates of Elephant grass structural components were low during the winter period. Differences in leaf blades occurred in three grazing periods, with higher rates for the mixture with Red clover, probably associated to the presence of this legume and contributing positively to the companion grass (Carvalho & Pires, 2008). The only difference in the case of Elephant grass stem + sheath occurred for grazing in March with higher rates for the system without legumes; among grazing periods, rates were similar among systems, particularly low rate of this fraction in grazing during February due to low rainfall during the period (Figure 1). It should be underscored that, in the case of the dead material fraction of Elephant grass, the high rate (p ≤ 0.05) in July occurred in the system without legume.
involvement in grazing during August and October. A comparison between mean rates points to a difference (p ≤ 0.05), with higher availability for forage peanut. The average participation of legumes on the mass of the total forage reached 47% for Forage peanut and 16% for Red clover, which were adequate for the sustainability of the forage systems (Diehl et al., 2013).
In the case of spontaneous growth species, especially for Bahia grass (Paspalum notatum), Alexander grass (Urochloa plantaginea) and Paspalum conjugatum, the observed differences (p ≤ 0.05) between systems for all grazing cycles indicate that legume contributed towards the control of these species (Olivo et al., 2008). It should be underscored that these species present high participation particularly during summer and early fall. For the dead material fraction of forage between Elephant grass clumps, the high rates were reported in July
due to the cumulative action of frost on the spontaneous growing species, and in December due to the senescent Italian ryegrass material.
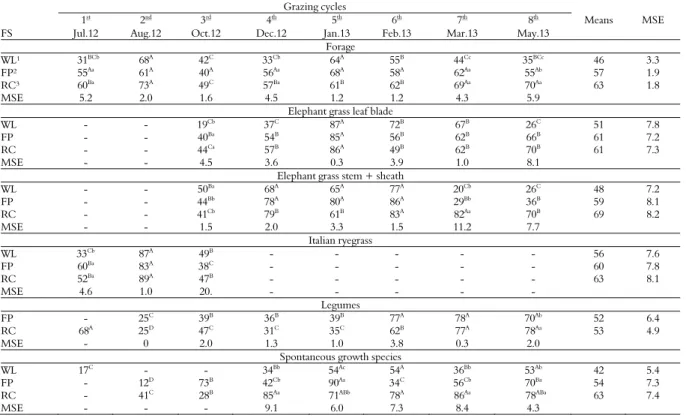
Significant differences (p ≤ 0.05) for herbage disappearance rate of forage (Table 2) were registered in four grazing cycles, with high mixture rates. It may be observed that there was better performance in the structural composition of Elephant grass during the early crop development in October, with a higher disappearance rate for leaf blade and a lower one for stem + sheath, in the mixture. The above indicated a possible synergistic effect of forage legumes to the companion crop, improving the nutritional rate and grass intake accordingly. Similar result occurred in the early use of Italian ryegrass. Azevedo Junior et al. (2012b), in similar research, obtained lower performance in Italian ryegrass disappearance rate, with average of 44.2%.
Table 1. Forage mass, structural and botanical composition (kg of DM ha-1) of three forage systems (FS).
Grazing cycles
Means FS
1st
2nd
3rd
4th
5th
6th
7th
8th
MSE Jul.12 Aug.12 Oct.12 Dec.12 Jan.13 Feb.13 Mar.13 May.13
Forage mass (Pre-grazing) WL¹ 1213D
3121A
1739C
2125B
2778A
2641A
2811Ab
2651Ac
2385 149 FP² 1307C 2806A 1980C 2241B 2337B 2345B 2868Ab 3094Ab 2372 133 RC³ 1474C
3043AB
1905C
2425B
2757B
2572B
4052Aa
3978Aa
2776 212
MSE 44.1 54.7 41.1 50.4 82.9 51.6 234 225
Elephant grass leaf blade
WL - 195D 53Eb 1176B 1537Aa 1409A 721C 688Cb 826 142
FP - 162C
101Cab
1109A
586Bb
664B
598B
665Bb
555 86.8
RC - 206C 131Ca 1105A 979Aab 771B 661B 1140Aa 713 107
MSE - 7.6 13.1 13.3 159 134 20.5 89.3
Elephant grass stem + sheath
WL - 23E 8F 396B 210C 67D 318Ba 772A 256 62.6
FP - 12E 14E 374B 147C 62D 194Cb 674A 211 55.8
RC - 24E 7F 372B 122C 58D 178Cb 513A 182 44.1
MSE - 2.2 1.3 4.4 15.1 1.5 25.5 43.6
Dead material of Elephant grass
WL 944Aa
789A
108B
- - - 613 92.8
FP 588Ab 796A 206B - - - 530 74.3
RC 560Ab
837A
286B
- - - 561 76.1
MSE 71.4 8.6 29.7
Italian ryegrass
WL 965C 2729A 1585B - - - 1766 241
FP 1156C
2177A
1577B
- - - 1636 208
RC 997C 2478A 1329B - - - 1601 217
MSE 34.1 92.1 48.5
Legumes
FP - 176Db
242C
733Ba
438C
1296Aa
1720Aa
1422Aa
861 152 RC 178C 220Ca 239C 431Bb 472B 194Cb 624Ab 277Bb 329 37.7
MSE - 11.0 0.8 75.5 8.5 276 274 286
Spontaneous growth species
WL 62D - - 654Ca 1241Bb 1232Ba 2089Aab 1964Ab 1207 201
FP - 108Fa 28Jb 198Eb 1752Aa 385Db 550Cb 1007Bc 575 142
RC - 68Eb
116Da
632Ca
1307Bb
1608Ba
2768Aa
2562Aa
1294 264
MSE - - - 85.7 92.6 209 379 261
Dead material between rows of Elephant grass
WL 188Bab 392A 82C 294Aa - - - - 239 36.2
FP 152Bb
348A
34C
202Ab
- - - - 184 30.4
RC 299Aa 278A 152B 258Aab - - - - 247 32.4
MSE 25.5 19.2 19.8 19.5 - - - -
Table 2. Herbage disappearance rate (%) of three forage systems (FS).
FS
Grazing cycles 1st
2nd
3rd
4th
5th
6th
7th
8th
Means MSE
Jul.12 Aug.12 Oct.12 Dec.12 Jan.13 Feb.13 Mar.13 May.13 Forage
WL¹ 31BCb 68A 42C 33Cb 64A 55B 44Cc 35BCc 46 3.3
FP² 55Aa 61A 40A 56Aa 68A 58A 62Aa 55Ab 57 1.9
RC³ 60Ba 73A 49C 57Ba 61B 62B 69Aa 70Aa 63 1.8
MSE 5.2 2.0 1.6 4.5 1.2 1.2 4.3 5.9
Elephant grass leaf blade
WL - - 19Cb 37C 87A 72B 67B 26C 51 7.8
FP - - 40Ba 54B 85A 56B 62B 66B 61 7.2
RC - - 44Ca
57B
86A
49B
62B
70B
61 7.3
MSE - - 4.5 3.6 0.3 3.9 1.0 8.1
Elephant grass stem + sheath
WL - - 50Ba
68A
65A
77A
20Cb
26C
48 7.2
FP - - 44Bb 78A 80A 86A 29Bb 36B 59 8.1
RC - - 41Cb 79B 61B 83A 82Aa 70B 69 8.2
MSE - - 1.5 2.0 3.3 1.5 11.2 7.7
Italian ryegrass
WL 33Cb 87A 49B - - - - - 56 7.6
FP 60Ba 83A 38C - - - - - 60 7.8
RC 52Ba
89A
47B
- - - - - 63 8.1
MSE 4.6 1.0 20. - - - - -
Legumes
FP - 25C 39B 36B 39B 77A 78A 70Ab 52 6.4
RC 68A 25D 47C 31C 35C 62B 77A 78Aa 53 4.9
MSE - 0 2.0 1.3 1.0 3.8 0.3 2.0
Spontaneous growth species
WL 17C
- - 34Bb
54Ac
54A
36Bb
53Ab
42 5.4
FP - 12D 73B 42Cb 90Aa 34C 56Cb 70Ba 54 7.3
RC - 41C 28B 85Aa 71ABb 78A 86Aa 78ABa 63 7.4
MSE - - - 9.1 6.0 7.3 8.4 4.3
¹WL (without legumes)= Elephant grass (EG)+Italian ryegrass (IR)+spontaneous growth species (SGS); ² FP (mixture with Forage peanut)= EG+IR+SGS+FP; ³ RC (mixture with Red clover)= EG+IR+SGS+RC. MSE= means standard error. BW=body weight. Means followed by different lower case letters (column) and upper case letters (rows) differ significantly by Tukey’s test (p ≤ 0.05).
In case of legumes, the difference obtained in May indicated that there was better use of the winter species, an expected outcome when compared to that of the summer species (Carvalho & Pires, 2008). In other grazing cycles, there was similarity in herbage disappearance rate was similar among legumes. Similar studies by Diehl et al. (2013) with Forage peanut and Red clover under mixture had lower disappearance rates. Performance for spontaneous growth species was better when in the mixture, especially during grazing cycles in autumn. The difference observed between the pastures' components indicated that the presence of forage legumes improve the herbage disappearance rate.
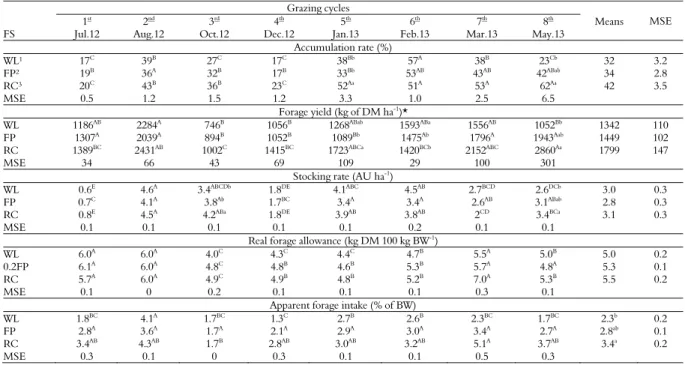
Difference (p ≤ 0.05) in forage accumulation rate (Table 3) for grazing in January, with a higher rate for the mixture with Red clover, may have been caused by the effect of the legume on the forage system (Carvalho & Pires, 2008). The same synergistic action is also observed for grazing in May, recorded by the high accumulation rate of the Red clover mixture. There was a similar behavior at the end of May in the case of the mixture with Forage peanut, with
rates similar to the system without the legume. Lowest rate between the seasons occurred in July due to the seasonality of Elephant grass. In fact, assessments in autumn indicated a better performance for the pasture mixture.
Forage yield tally is reflected by accumulation rates. When considering forage yield (Table 3), the rate was higher (p ≤ 0.05) for the mixed system with Red clover, 14 t ha-1, also reported by Azevedo Junior et al. (2012b) and Diehl et al. (2013), with 12.0% and 19.4% higher value, respectively, when evaluating mixtures with Red clover. The higher herbage yield probably is caused by the contribution of the forage legume on spontaneous growth species and the Elephant grass (Table 2).
Table 3. Accumulation rate, forage yield, forage allowance real and apparent intake of three forage systems (FS).
FS
Grazing cycles
MSE 1st
2nd
3rd
4th
5th
6th
7th
8th
Means Jul.12 Aug.12 Oct.12 Dec.12 Jan.13 Feb.13 Mar.13 May.13
Accumulation rate (%)
WL¹ 17C 39B 27C 17C 38Bb 57A 38B 23Cb 32 3.2
FP² 19B
36A
32B
17B
33Bb
53AB
43AB
42ABab
34 2.8
RC³ 20C 43B 36B 23C 52Aa 51A 53A 62Aa 42 3.5
MSE 0.5 1.2 1.5 1.2 3.3 1.0 2.5 6.5
Forage yield (kg of DM ha-1)* WL 1186AB
2284A
746B
1056B
1268ABab
1593ABa
1556AB
1052Bb
1342 110 FP 1307A 2039A 894B 1052B 1089Bb 1475Ab 1796A 1943Aab 1449 102 RC 1389BC
2431AB
1002C
1415BC
1723ABCa
1420BCb
2152ABC
2860Aa
1799 147
MSE 34 66 43 69 109 29 100 301
Stocking rate (AU ha-1 )
WL 0.6E 4.6A 3.4ABCDb 1.8DE 4.1ABC 4.5AB 2.7BCD 2.6DCb 3.0 0.3
FP 0.7C
4.1A
3.8Ab
1.7BC
3.4A
3.4A
2.6AB
3.1ABab
2.8 0.3 RC 0.8E 4.5A 4.2ABa 1.8DE 3.9AB 3.8AB 2CD 3.4BCa 3.1 0.3
MSE 0.1 0.1 0.1 0.1 0.1 0.2 0.1 0.1
Real forage allowance (kg DM 100 kg BW-1)
WL 6.0A
6.0A
4.0C
4.3C
4.4C
4.7B
5.5A
5.0B
5.0 0.2
0.2FP 6.1A 6.0A 4.8C 4.8B 4.6B 5.3B 5.7A 4.8A 5.3 0.1
RC 5.7A 6.0A 4.9C 4.9B 4.8B 5.2B 7.0A 5.3B 5.5 0.2
MSE 0.1 0 0.2 0.1 0.1 0.1 0.3 0.1 Apparent forage intake (% of BW)
WL 1.8BC 4.1A 1.7BC 1.3C 2.7B 2.6B 2.3BC 1.7BC 2.3b 0.2
FP 2.8A
3.6A
1.7A
2.1A
2.9A
3.0A
3.4A
2.7A
2.8ab
0.1 RC 3.4AB 4.3AB 1.7B 2.8AB 3.0AB 3.2AB 5.1A 3.7AB 3.4a 0.2
MSE 0.3 0.1 0 0.3 0.1 0.1 0.5 0.3
¹WL (without legumes)= Elephant grass (EG)+Italian ryegrass (IR)+spontaneous growth species (SGS); ² FP (mixture with Forage peanut)= EG+IR+SGS+FP; ³ RC (mixture with Red clover)= EG+IR+SGS+RC. MSE= means standard error. BW=body weight. *Total forage yield, WL= 10739b, FP= 11593b and RC= 14391a kg of DM ha-1.Means followed
by different lower case letters (column) and upper case letters (rows) differ significantly by Tukey’s test ( p ≤ 0.05). Average rates of true forage supply were within
the recommended estimate of 4 kg DM 100 kg BW-1 for leaf blades mass of Elephant grass and 6 kg DM 100 kg BW-1 for forage mass between rows. The use of different forages provided more balanced herbage allowance during the growing season. In high quality pastures (above 15% crude protein and about 50% NDF), animal performance may be basically explained by intake level, determined mainly by forage supply and pasture structure (Ribeiro Filho, Heydt, Baade, & Thaler Neto, 2009).
Since cows in current assay had an estimated intake of 3% BW, according to weight and milk yield, coupled to concentrate, there was no limitation to forage intake. This fact is confirmed by the apparent forage, or rather, 2.8% BW, considering the means of the systems. There were significant differences (p ≤ 0.05) between them, with a higher intake in mixture with Red clover and similar to the mixture with Forage peanut. Current result may be associated with the forage´s better nutritional rate.
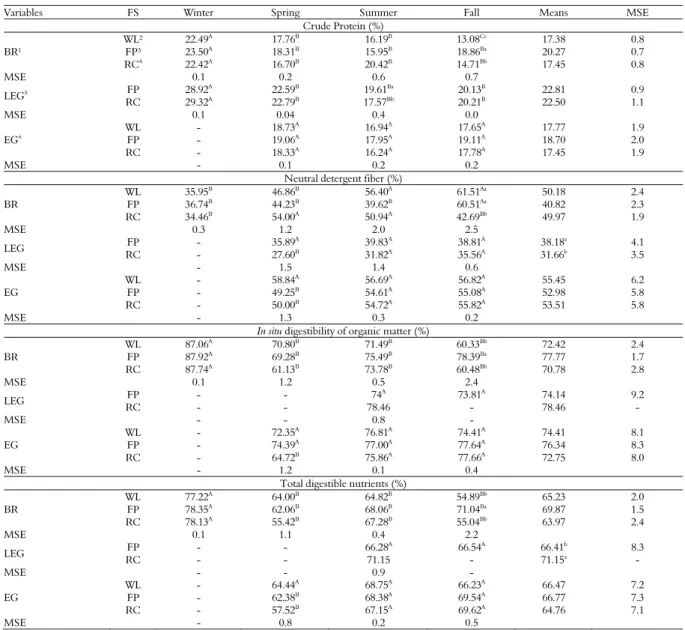
In the winter, the species between the rows of Elephant grass showed that crude protein levels were close to 23% due to high Italian ryegrass participation (Table 4). Rates were higher than those reported by Azevedo Junior et al. (2012b), or rather, 15% CP for forage systems of Elephant grass in mixture with Forage peanut and Red clover in the same period. A similar mean rate of 21% for Italian
ryegrass was registered by Olivo et al. (2012) when they evaluated different forage mixtures in the same region as that of current study. Pellegrini et al. (2010) reported mean rates of 21% when evaluating the effect of nitrogen fertilization on the yield and quality of herbage mass of annual ryegrass pastures with sheep.
On spring and summer there are no difference between the forage systems, and naturally decline the crude protein rates cause the presence of summer species. However, in the fall there are differences (p ≤ 0.05) with higher rates for the mixture, and confirmed that these forages legumes usually have higher protein content when compared to that of grasses. Rates obtained with Forage peanut are on an average higher than those reported by Azevedo Junior et al. (2012b), 16 and 14% respectively, in winter and summer. Concerning the crude protein of legumes, there is lower variability between seasons. The presence of forage legumes didn't affect the crude protein content of Elephant grass.
Table 4. Crude protein, neutral detergent fiber, in situ digestibility of organic matter and total digestible nutrients of three forage systems (FS).
Variables FS Winter Spring Summer Fall Means MSE
Crude Protein (%)
BR¹
WL² 22.49A 17.76B 16.19B 13.08Cc 17.38 0.8
FP³ 23.50A
18.31B
15.95B
18.86Ba
20.27 0.7
RC4 22.42A 16.70B 20.42B 14.71Bb 17.45 0.8
MSE 0.1 0.2 0.6 0.7
LEG5 FP 28.92A 22.59B 19.61Ba 20.13B 22.81 0.9
RC 29.32A 22.79B 17.57Bb 20.21B 22.50 1.1
MSE 0.1 0.04 0.4 0.0
EG6
WL - 18.73A 16.94A 17.65A 17.77 1.9
FP - 19.06A 17.95A 19.11A 18.70 2.0
RC - 18.33A 16.24A 17.78A 17.45 1.9
MSE - 0.1 0.2 0.2
Neutral detergent fiber (%)
BR
WL 35.95B 46.86B 56.40A 61.51Aa 50.18 2.4
FP 36.74B 44.23B 39.62B 60.51Aa 40.82 2.3
RC 34.46B 54.00A 50.94A 42.69Bb 49.97 1.9
MSE 0.3 1.2 2.0 2.5
LEG FP - 35.89
A 39.83A 38.81A 38.18a 4.1
RC - 27.60B 31.82A 35.56A 31.66b 3.5
MSE - 1.5 1.4 0.6
EG
WL - 58.84A 56.69A 56.82A 55.45 6.2
FP - 49.25B
54.61A
55.08A
52.98 5.8
RC - 50.00B 54.72A 55.82A 53.51 5.8
MSE - 1.3 0.3 0.2
In situ digestibility of organic matter (%) BR
WL 87.06A
70.80B
71.49B
60.33Bb
72.42 2.4
FP 87.92A 69.28B 75.49B 78.39Ba 77.77 1.7
RC 87.74A
61.13B
73.78B
60.48Bb
70.78 2.8
MSE 0.1 1.2 0.5 2.4
LEG FP - - 74
A 73.81A 74.14 9.2
RC - - 78.46 - 78.46 -
MSE - - 0.8 -
EG
WL - 72.35A
76.81A
74.41A
74.41 8.1
FP - 74.39A 77.00A 77.64A 76.34 8.3
RC - 64.72B 75.86A 77.66A 72.75 8.0
MSE - 1.2 0.1 0.4
Total digestible nutrients (%)
BR
WL 77.22A 64.00B 64.82B 54.89Bb 65.23 2.0
FP 78.35A 62.06B 68.06B 71.04Ba 69.87 1.5
RC 78.13A 55.42B 67.28B 55.04Bb 63.97 2.4
MSE 0.1 1.1 0.4 2.2
LEG FP - - 66.28
A
66.54A
66.41b
8.3
RC - - 71.15 - 71.15a -
MSE - - 0.9 -
EG
WL - 64.44A 68.75A 66.23A 66.47 7.2
FP - 62.38B 68.38A 69.54A 66.77 7.3
RC - 57.52B
67.15A
69.62A
64.76 7.1
MSE - 0.8 0.2 0.5
¹BR= between rows of Elephant grass; ²WL (without legumes)= Elephant grass (EG)+Italian ryegrass (IR)+spontaneous growth species (SGS); ³ FP (mixture with Forage peanut)= EG+IR+SGS+FP; 4 RC (mixture with Red clover)= EG+IR+SGS+RC. 5LEG= forage legumes. 6 EG= Elephant grass. MSE= means standard error. Means followed by different
lower case letters (column) and upper case letters (rows) differ significantly by Tukey’s test (p ≤ 0.05). of the legume to the system. In the case of Elephant grass, there was no difference between pasture systems and seasons. However, it may be observed that Elephant grass´s NDF mixtures in the spring are lower when compared to those of Elephant grass and legumes.
Significant differences (p ≤ 0.05) in ISOMD and NDT contents were identified only in the autumn, with better values for species present between rows for the system where Forage peanut is present. Rates close to 78% for IOSMD were also observed by Azevedo Junior et al. (2012a).
Conclusion
The presence of Red clover in the pasture results in better and higher forage yield in the mixture,
whilst Forage peanut results in greater control of spontaneous growth species. Moreover, the inclusion of legumes in pasture systems provides better nutritional rates.
References
Association Official Analytical Chemist [AOAC]. (2005). Official Methods of Analysis (18th ed.). Gaitherburg, MA: AOAC.
Assmann, T. S., Assmann, A. L., Soares, A. B., Cassol, L. C., Giasson, M. S., & Giasson, N. F. (2007). Nitrogen biological fixation by clover plants (Trifolium spp) on crop-pasture systems in southern Brazil. Revista Brasileira de Zootecnia, 36(5), 1435-1442.
(2012a). Forage mass and the nutritive value of pastures mixed with forage peanut and red clover. Revista Brasileira de Zootecnia, 41(4), 827-834.
Azevedo Junior, R. L., Olivo, C. J., Meinerz, G. R., Agnolin, C. A., Diehl, M. S., Moro, G., ... Horst, T. (2012b). Produtividade de sistemas forrageiros consorciados com amendoim forrageiro ou trevo vermelho. Ciencia Rural, 42(11), p. 2043-2050.
Carvalho, G. G. P., & Pires, A. J. V. (2008). Herbaceous tropical legumes associated with pasture. Archivos de Zootecnia, 57(10), 103-113.
Diehl, M. S., Olivo, C. J., Agnolin, C. A., Azevedo Junior, R. L., Bratz, V. F., & Santos, J. C. (2014). Massa de forragem e valor nutritivo de capim elefante, azevém e espécies de crescimento espontâneo consorciadas com amendoim forrageiro ou trevo vermelho. Ciencia Rural, 44(10), 1845-1852.
Diehl, M. S., Olivo, C. J., Agnolin, C. A., Bratz, V. F., Bem, C., Agüirre, P. F., ... Serafim, G. (2013). Produtividade de sistemas forrageiros consorciados com leguminosas. Arquivo Brasileiro de Medicina Veterinaria e Zootecnia, 65(5), 1527-1536.
Empresa Brasileira de Pesquisa Agropecuária [EMBRAPA]. (2006). Sistema brasileiro de classificação de solos (Vol. 412). Brasília, DF: Embrapa.
Mehrez, A. Z., & Orskov, E. R. (1977). A study of the artificial fibre bag technique for determining the digestibility of seeds in the rumen [recurso electrónico]. Journal of Agricultural Science, 88(3), 645-650.
Moreira, F. B., Prado, I. N., Cecato, U., Wada, F. Y., & Mizubuti, I. Y. (2004). Forage evaluation, chemical composition, and in vitro digestibility of continuously grazed star grass. Animal Feed Science and Technology, 113(1), 239-249.
National Research Council [NRC]. (2000). Nutrient Requirements of Beef Cattle (7th rev. ed.). Washington, D.C.: Natl. Acad. Press.
Olivo, C. J., Nornber, J. L., Meinerz, G. R., Agnolin, C. A., Machado, P. R., Marx, F. R., ... Santos, J. C. (2012). Produtividade e valor nutritivo de pastos consorciados com diferentes espécies de leguminosas. Ciencia Rural, 42(11), 2051-2058.
Olivo, C. J., Ziech, M. F., Meinerz, G. R., Both, J. F., Agnolin, C. A., & Vendrame, T. (2008). Comportamento ingestivo de vacas em lactação em
diferentes sistemas forrageiros. Revista Brasileira de Zootecnia, 37(11), 2017-2023.
Pellegrini, L. G., Monteiro, A. L. G., Neumann, M., Moraes, A., Pellegrin, A. C. R. S., & Lustosa, S. B. C. (2010). Produção e qualidade de azevém-anual submetido a adubação nitrogenada sob pastejo por cordeiros. Revista Brasileira de Zootecnia, 39(9), 1894-1904.
Ribeiro, E. G., Alencar, F. C. A., Bergottini, J. G., Palieraqui, C. E. M., Cóser, A. C., & Faria, S. A. N. (2008). Influência da irrigação durante as épocas seca e chuvosa na taxa de lotação, no consumo e no desempenho de novilhos em pastagens de capim-elefante e capim-mombaça. Revista Brasileira de Zootecnia, 37(9), 1546-1554.
Ribeiro Filho, H. M. N., Heydt, M. S., Baade, E. A. S., & Thaler Neto, A. (2009). Consumo de forragem e produção de leite de vacas em pastagem de azevém-anual com duas ofertas de forragem. Revista Brasileira de Zootecnia, 38(10), 2038-2044.
Statistical Analysis System [SAS]. (2004). SAS/STAT User guide, Version 9.1.2. Cary, NC: SAS Institute Inc. Silva, T. C. d., Macedo, C. H. O., Araújo, S. d. S., Pinho,
R. M. A., Perazzo, A. F., Santos, E. M., & Neto, S. G. (2011). Características agronômicas do capim "Brachiaria decumbens" submetido a intensidades e frequências de corte e adubação nitrogenada. Revista Brasileira de Saúde e Produção Animal, 12(3), 583-593. Steinwandter, E., Olivo, C. J., Santos, J. C., Araújo, T. L.
d. R., Aguirre, P. F., & Diehl, M. S. (2009). Produção de forragem em pastagens consorciadas com diferentes leguminosas sob pastejo rotacionado. Acta Scientiarum. Animal Sciences, 31(2), 131-137.
Van Soest, P. J., Robertson, J. B., & Lewis, B. A. (1991). Methods for dietary fiber, neutral detergent fiber, and nonstarch polysaccharides in relation to animal nutrition. Journal of Dairy Science, 74(10), 3583-3597.
Received on June, 15, 2016. Accepted on July, 19, 2016.
License information: This is an open-access article distributed under the terms of the Creative Commons Attribution License, which permits unrestricted use, distribution, and reproduction in any medium, provided the original work is properly cited.