Received October 18, 2010 and accepted July 6, 2011. Corresponding author: mauricio@cpafac.embrapa.br
Dynamics of sward condition and botanical composition in mixed pastures
of marandugrass, forage peanut and tropical kudzu
1Carlos Mauricio Soares de Andrade2, Rasmo Garcia3, Judson Ferreira Valentim2, Odilon Gomes Pereira3
1Research financially supported by Fapemig and Embrapa. 2Embrapa Acre, CP 321, 69908-970, Rio Branco, Acre. 3Departamento de Zootecnia, UFV. Scholar from CNPq.
ABSTRACT - This study was carried out to evaluate the dynamics of sward condition and botanical composition of a mixed pasture of marandugrass (Brachiaria brizantha cv. Marandu), forage peanut (Arachis pintoi cv. Mandobi) and tropical
kudzu (Pueraria phaseoloides), rotationally stocked at four daily forage allowance levels (6.6, 10.3, 14.3 and 17.9% of live
weight). Sward condition was characterized in each stocking cycle by measuring pre- and post-grazing sward height, forage mass and percentage of bare ground. Botanical composition (grass, forage peanut, tropical kudzu and weeds) was evaluated before each stocking period. Swards under smaller forage allowances presented lower height, forage mass and ground cover. This condition favored the growth of forage peanut, which constituted 21.1, 15.2, 8.4 and 3.8% of forage mass in the last quarter of the experimental period, from the lowest to the highest forage allowance, respectively. Tropical kudzu was sensitive to all forage allowance levels and its percentage in the botanical composition was strongly reduced along the experimental period, especially during the dry season (July to September). Forage peanut cv. Mandobi and marandugrass form a more balanced mixture when pre-grazing sward height is maintained shorter than 45 cm. Tropical kudzu is intolerant to intensive grazing management systems when associated to marandugrass.
Key Words: Arachis pintoi, Brachiaria brizantha, legume, persistence, Pueraria phaseoloides, Western Amazon
ISSN 1806-9290 www.sbz.org.br
Introduction
Marandugrass (Brachiaria brizantha cv. Marandu)
is a difficult species to manage in mixed grass-legume pastures. Studies show that legumes such as
Calopogonium mucunoides and Stylosanthes guianensis
cv. Mineirão are less persistent when mixed with marandugrass than with other forage grasses (Euclides et al., 1998; Andrade et al., 2003; Almeida et al., 2003). In a study conducted by Colozza et al. (2001), the proportion of legumes (mixture of C. mucunoides, Galactia striata, Macrotyloma axillare, Neonotonia wightii and S. guianensis) was lower in the mixture with marandugrass
(16%) than with Panicum maximum cv. Tanzania (34%)
or with Setaria sphacelata cv. Kazangula (30%). In the
coastal region of the state of Bahia, tropical kudzu (Pueraria phaseoloides) mixed with marandugrass
persisted at satisfactory levels only under stocking rates up to 1.0 steer/ha (Pereira, 2002). This fact has been related to the aggressive growth of marandugrass (Barcellos et al., 2001) and also to the possible allopathic effect of this grass on the legumes (Souza Filho et al., 2002; Almeida et al., 2003).
However, mixed pastures with marandugrass and forage peanut (Arachis pintoi) are reported as showing excellent
results. In Colombia, after two years under grazing, percentage of A. pintoi cv. Amarillo mixed with four Brachiaria species ranged from 20 to 45% (Grof, 1985). In
Costa Rica, after 30 months of grazing, this legume represented 26% of the total forage mass of a mixed pasture with marandugrass under rotational stocking with 3.0 AU/ha. However, it represented only 9% of the total forage mass when the stocking rate was 1.75 AU/ha (Ibrahim & Mannetje, 1998). In this same study, the legumes Centrosema macrocarpum and S. guianensis practically disappeared
from the pastures at the end of the experiment. Also in Costa Rica, annual live weight production of beef cattle in a marandugrass pasture mixed with forage peanut cv. Amarillo was up to 937 kg/ha, 30% above that obtained in a pure marandugrass pasture (Hernandez et al., 1995). These and other studies (Pérez & Lascano, 1992; González et al., 1996; Santana et al., 1998; Barcellos et al., 1999; Andrade et al., 2006) show that forage peanut benefits from higher grazing pressures, regardless of the associated grass.
Tropical kudzu and forage peanut are the most commonly grown forage legumes in mixed pastures in the
State of Acre (Valentim & Andrade, 2004). However, there is a lack of objective grazing management recommendations for these two forage legumes with contrasting growth habits and grazing tolerance when mixed with different forage grasses in these environmental conditions.
This study was carried out to evaluate the dynamics of sward condition and botanical composition of mixed pastures with marandugrass and the legumes tropical kudzu and forage peanut, under rotational stocking, using different daily forage allowance levels, aiming at developing sward management targets for these mixed pastures in the environmental conditions of the Western Amazon.
Material and Methods
This experiment was conducted at the Experimental Station of Embrapa Acre (10°01' 59" S and 67°42' 13" W), in Rio Branco, Acre, Brazil, between January and December 2003. The local climate is characterized by average annual rainfall of 1,900 mm, average temperature of 25 ºC and 87% mean relative humidity. In 2003, the annual rainfall was 1,790 mm, with mean temperature of 25.6 ºC. The experimental area consisted of a 3,400-m2 paddock with a mixed pasture of B. brizantha cv. Marandu, P. phaseoloides
and A. pintoi cv. Mandobi. This mixture resulted from an
experiment which was concluded in August 2002, in which several methods of introduction of forage peanut were tested in an established pasture of marandugrass mixed with tropical kudzu (Valentim et al., 2002). The soil of the experimental area was classified as a Red-Yellow Argisol [pH (H2O), 5.6; P and K (Mehlich-1), 1.5 and 120.0 mg/dm3; Ca2+ and Mg2+, 4.3 and 0.9 cmolc/dm3; H + Al3+, 5.7 cmolc/dm3; BS, 5.5 cmolc/dm3; CEC at pH 7.0, 11.2 cmolc/dm3; V, 49.2%; OM, 2.5 dag/dm3; clay, 29.0%; silt, 53.4%; sand, 17.6%]. At the beginning of the experiment the soil was fertilized with 50 kg/ha of P2O5, using triple superphosphate.
The experimental area was divided in 12 experimental units (paddocks) in order to study the response of the mixed pastures to four levels of daily forage allowance (6, 10, 14 and 18 kg of dry matter/100 kg of live weight), in a randomized complete block design with three replications. The levels of forage allowance effectively applied, on the average of the experimental period, were 6.6; 10.3; 14.3 and 17.9% of the live weight. Pastures were grazed by Nelore steers with live weight ranging from 180 to 360 kg, under rotational stocking. Forage allowance was adjusted by varying the stocking rates in the paddocks. Stocking cycle was 28 days in the rainy season and 35 days in the dry season, with a stocking period of two days. Animals remained in the paddocks only during the stocking period, maintained in an adjacent pasture
during the rest period. Overall, there were 11 stocking cycles during the experimental period. The data obtained in each stocking cycle were grouped in the following quarters of the year: a) January-March, full rainy season; b) April-June, transition between the rainy and dry seasons; c) July-September, full dry season; and, d) October-December, beginning of the rainy season.
Sward condition (sward height, forage mass and percentage bare ground) was characterized before and after each stocking period. Botanical composition was also evaluated immediately before each stocking period. These evaluations were carried out systematically along five transects crossing each paddock in a zigzag pattern. Ten sampling points per paddock (two per transect) were selected using a galvanized iron quadrat (100 cm × 100 cm). Within each sampling unit the following measurements were taken: sward height (cm), using a ruler in three random points; percentage bare ground (%BG), estimated visually; and botanical composition (%), visually estimating percentage contribution of each component (grass, forage peanut, tropical kudzu and weeds) to the total biomass (Whalley & Hardy, 2000). Visual estimates were conducted by a trained observer during the entire experimental period.
Forage mass (kg/ha of DM) was estimated using the double sampling technique based on sward height (cm) and ground cover (%) index (HCI = height × ground cover / 100). Calibration equations (pre- and post-grazing) were obtained by measuring sward height and ground cover, and clipping 12 samples of 1.0 m² (one per paddock) to a 5-cm stubble height. Forage samples were oven-dried for 48 hours at 80 ºC and weighted. In each treatment, sampling points were selected in order to represent sites with high, medium and low forage mass. In each stocking cycle, forage mass of each component of the sward was calculated multiplying the total forage mass pre-grazing by the percentage of the respective component in the sward.
Botanical composition data were adjusted by covariance to account for initial variation among experimental units. This adjustment was done using as covariates the percentages of marandugrass, forage peanut, tropical kudzu and weeds measured in each paddock at the beginning of the experimental period.
on the coefficient of determination and on the level of significance of the regression coefficients. The quarters were compared using the Tukey test, at a 5% level.
Results and Discussion
At the beginning of the experiment, the mixed pasture of marandugrass, tropical kudzu and forage peanut presented mean height of 78 cm and forage mass of 6.0 t/ha of DM, which was due to the long period without grazing (100 days).
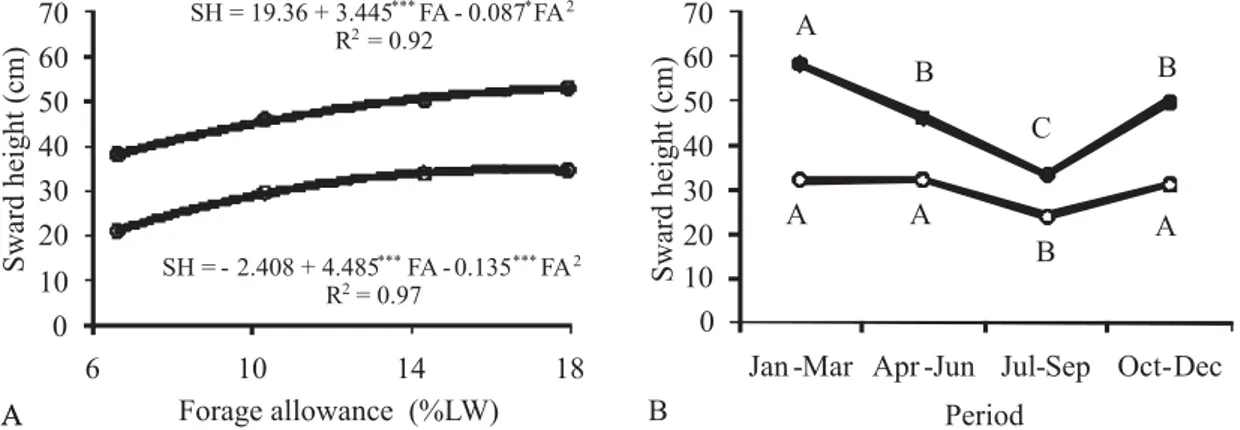
Pre- and post-grazing sward height increased quadratically with increasing forage allowance levels, with a trend to stabilization in the higher levels (Figure 1A). As defoliation intensity increased, especially in the lowest forage allowance level, plants of marandugrass changed the canopy architecture, showing a more prostrate growth, result similar to that reported by Braga et al. (2003).
Sward height also varied along the year, especially in the pre-grazing condition (Figure 1B). Greater pre-grazing heights occurred in the first experimental period
(January-March) and lower heights occurred during the driest period of the year (July-September), intermediary in the remaining periods. The tallest sward observed in January-March (58 cm) still reflected its previous condition before the experimental period. Post-grazing mean sward height presented less seasonal variation, with the lowest value (P<0.05) also occurring in the July-September period. On average, over the four forage allowance levels, pre-grazing sward height ranged from 33 to 58 cm along the experimental period, while the post-grazing sward height ranged from 24 to 32 cm.
There was interaction (P<0.05) between forage allowance and period of the year for pre-grazing percentage bare ground (%BG). The greatest %BG (Table 1) occurred during the peak of the dry season (July-September) as a result of lower pasture growth and leaf shedding by the legumes. Pre-grazing %BG was only affected (P<0.05) by forage allowance during the two first periods, with a quadratic effect in January-March and a linear effect in the April-June period (Table 1). Along the experimental period sward structure was adjusted according the defoliation intensities,
% LW Jan.-Mar. Apr.-Jun. Jul.-Sep. Oct.-Dec. Mean
6 . 6 19.8A 15.3AB 21.6A 11.0B 16.9
10.3 10.5B 10.8B 18.4A 14.5AB 13.6
14.3 9.6B 11.4B 19.8A 10.1B 12.7
17.9 7.0B 6.6B 17.4A 10.0B 10.3
Mean 11.7 11.0 19.3 11.4 13.4
Effect2 Quadratic Linear NS NS –
a 40.15 19.30 – – –
b1 -3.958** -0.674** – – –
b2 0.119* – – – –
R2 0.70 0.62 – – –
1Means followed by the same letter, in each row, are not different (P>0.05) by Tukey test.
2Effect of forage allowance on pre-grazing percentage bare ground; LW = live weight; a: intercept; b1 and b2 = regression coefficients; R2 = coefficient of determination; NS, * and ** = non-significant, significant according to F test at 5% and 1% levels, respectively.
Table 1 - Variation in pre-grazing percentage bare ground as a function of forage allowance and period of the year1
Figure 1 - Variation in pre- (z) and post-grazing ({) sward height as a function of forage allowance (A) and period of the year (B).
especially in the lowest forage allowance level, in such a way that in the October-December period pre-grazing %BG was lower than 15% in all forage allowance levels. This resulted both from the change in grass architecture and also from the change in the botanical composition, as further discussed. Lower forage allowance levels caused post-grazing %BG to increase, with data adjusting to a quadratic model (Figure 2A), in a trend similar to that observed for pre-grazing %BG in the beginning of the experimental period (Table 1).
Seasonal variation in post-grazing %BG was relatively small, with difference (P<0.05) occurring only between the January-March and April-June periods (Figure 2B). Mean post-grazing %BG was 34% in the January-March period, decreasing to 29% in the average of the remaining experimental period. Therefore, differently from the pre-grazing condition, there was no increase in post-pre-grazing %BG during the peak of the dry season (July-September).
These differences are explained by the distinct factors that affect these pasture characteristics under rotational stocking. While the pre-grazing degree of ground cover depends mainly on the increase in pasture leaf area during the rest period, sward defoliation intensity during the stocking period is the main determinant of post-grazing %BG. This also accounts for the greater effect of forage allowance levels over post-grazing %BG in relation to the pre-grazing condition.
The relation between forage allowance and forage mass, both pre- and post-grazing, was similar to that found for sward height (Figure 1A), and it was explained by quadratic models which made evident the increase in forage mass as forage allowance also increased, with a trend to stabilization in the higher forage allowance levels, especially in the post-grazing condition (Figure 3A).
Over the experimental period, average pre-grazing forage masses were 2,890, 3,660, 4,070 and 4,410 kg/ha of DM, and
LW = live weight; FA = forage allowance; * and *** = significant by F test at the 5% and 0.1% levels, respectively. Periods with means followed by the same letters are not different (P>0.05) by Tukey test.
Figure 3 - Variation in pre- (z) and post-grazing ({) forage mass as a function of forage allowance (A) and period of the year (B).
Figure 2 - Variation of post-grazing percentage bare ground as a function of forage allowance (A) and period of the year (B). LW = live weight; FA = forage allowance; * and *** = significant by F test at the 5% and 0.1% levels, respectively.
post-grazing forage masses were 1,630, 2,340, 2,770 and 2,900 kg/ha of DM, from the lowest to the highest forage allowance level, respectively. The literature presents some variation regarding pre-grazing forage mass in grass-legume pastures with marandugrass. In the Cerrado region of Brazil, Almeida et al. (2003) did not find effect of stocking rates of 0.8, 1.2 and 1.6 AU/ha on forage mass of a mixed pasture of marandugrass and Calopogonium mucunoides,
managed under continuous stocking, which had a mean of 3,470 kg/ha of DM. In Costa Rica, under rotational stocking, pre-grazing forage mass of a mixed pasture of marandugrass and A. pintoi cv. Amarillo was 7.0 and 4.8 t/ha of DM, when
managed under stocking rates of 1.75 and 3.0 AU/ha, respectively (Ibrahim & Mannetje, 1998).
Seasonal variation of forage mass was similar to that found for sward height. Pre-grazing forage mass was higher during periods with more favorable conditions for pasture growth (January-March and October-December) and lower during the driest period of the year (July-September) (Figure 3B). Post-grazing forage mass presented small seasonal variation, with lower values (P<0.05) during the July-September period. On average, over the four forage
allowance levels, pre-grazing forage mass ranged from 3,070 to 4,120 kg/ha of DM along the experimental period, while the post-grazing forage mass ranged between 2,250 and 2,550 kg/ha of DM.
Characterization of sward height, %BG and forage mass demonstrated that the experimental technique used was efficient in establishing and maintaining pastures with contrasting average sward conditions during the entire experimental period. However, these were not static, once there was considerable seasonal variation of sward condition due to the effect of climatic seasonality over pasture growth rate.
Initial pasture botanical composition presented 69% of marandugrass, 25% of tropical kudzu, 4% of forage peanut and 2% of weeds, based on dry mass. Apparently, the 100-day period without grazing before the beginning of the experiment favored the maintenance of higher percentage of tropical kudzu, in disfavor of forage peanut.
The relation between marandugrass percentage in the sward and forage allowance adjusted to a quadratic model, with a reduction of grass percentage in the lower forage allowance levels (Figure 4A). Over the experimental period,
Figure 4 - Variation in percentage of marandugrass and weeds in the sward as a function of forage allowance (A, C) and period of the year (B, D).
marandugrass represented 60.8, 67.4, 72.3 and 71.0% of pasture dry mass, from the lowest to the highest forage allowance level, respectively. Higher percentages of marandugrass occurred during the last two quarters of the year (July-September and October-December). Lower percentages occurred during the April-June period and were intermediary during the first experimental period (Figure 4B). On average, over the four forage allowance levels, marandugrass percentage ranged from 59.4 to 73.5% of the pasture dry mass.
Lower forage allowance levels caused percentage of weeds to increase, especially in the lowest forage allowance level, with data adjusting to a quadratic model (Figure 4C). This trend was similar to that verified for post-grazing %BG (Figure 2A), indicating that the increase in weeds was a result of the establishment of open spaces in the pasture. However, there was a lag phase between the time when these spaces were opened in the pasture and the time when colonization by the weed species effectively took place, once the highest post-grazing %BG occurred during the January-March period (Figure 2B), but percentage of weeds only increased significantly in April-June (Figure 4D). These weeds consisted mainly of annual species, which established themselves from the existing soil seed bank. These species ended their life cycle during the dry season, which explains the decrease in weed percentage that occurred along the July-September period.
There was interaction (P<0.05) between forage allowance and period of the year for percentage of forage peanut in the mixed pasture (Table 2). The percentage of this legume decreased linearly with increasing forage allowance levels in all periods of the year. During the last quarter of the experimental period average forage peanut percentage ranged from 3.8 to 21.1%, from the highest to the lowest forage allowance level, respectively. Similar results were reported for two other forage peanut genotypes growing in mixtures with marandugrass in Costa Rica (Ibrahim &
% LW Jan.-Mar. Apr.-Jun. Jul.-Sep. Oct.-Dec. Mean
6 . 6 9.5B 14.9AB 11.8B 21.1A 14.3
10.3 6.8B 10.7AB 7.9AB 15.2A 10.2
14.3 6.2A 7.5A 8.8A 8.4A 7 . 7
17.9 3.3A 3.4A 3.9A 3.8A 3 . 6
Mean 6 . 5 9 . 1 8 . 1 12.1 9 . 0
Effect2 Linear Linear Linear Linear –
a 12.60 21.38 15.46 31.19 –
b -0.504*** -0.998*** -0.601** -1.552*** –
R2 0.71 0.96 0.60 0.87 –
1Means followed by the same letter, in each row, are not different (P>0.05) by Tukey test.
2Effect of forage allowance on forage peanut percentage; LW = live weight; a = intercept; b = regression coefficient; R2 = coefficient of determination; ** and *** = significant according to F test at the 1% and 0.1% levels, respectively.
Table 2 - Variation in forage peanut cv. Mandobi percentage in the sward, as a function of forage allowance and period of the year1
Mannetje, 1998) and with Panicum maximum cv. Massai
in Brazil (Andrade et al., 2006).
In the two lowest forage allowance levels there was a trend towards a progressive increase in forage peanut percentage during the experimental period, interrupted only during the peak of the dry season (July-September) when the legume suffered from a moderate drought stress, thus reducing its percentage in the pasture (Table 2). The increase in forage peanut percentage was especially high during the onset of the rainy season (October-December), when the legume presented vigorous growth. However, in the two highest forage allowance levels there was no (P>0.05) seasonal variation in forage peanut percentage. Considering the initial percentage of this legume in the sward (4% of the dry mass), it remained practically stable along the experimental period in the highest forage allowance level, but increased 110, 280 and 430% in the forage allowance levels of 14.3, 10.3 and 6.6% live weight, respectively.
The results of this study confirm that the beginning of the rainy season is the most favorable period for the forage peanut to increase its population in mixed pastures. This is due to a more favorable sward structure at the end of the dry season, which presents lower height and forage mass and higher percentage bare ground, thus facilitating the colonization of new sites in the pasture through the emission of stolons by the legume (Andrade et al., 2006).
% LW Jan.-Mar. Apr.-Jun. Jul.-Sep. Oct.-Dec. Mean
6 . 6 22.7A 19.6A 13.7B 8.6B 16.2
10.3 23.3A 25.9A 15.0B 14.0B 19.6
14.3 25.1A 22.2A 11.9B 6.9B 16.5
17.9 27.0AB 31.5A 21.5AB 14.7B 23.7
Mean 24.5 24.8 15.5 11.1 19.0
Effect2 NS Linear NS NS –
a – 14.55 – – –
b – 0.833* – – –
R2 – 0.57 – – –
Table 3 - Variation in tropical kudzu percentage in the sward as a function of forage allowance and period of the year1
1Means followed by the same letters, in each row, are not different (P>0.05) by Tukey test.
2Effect of forage allowance on tropical kudzu percentage; LW = live weight; a = intercept; b = regression coefficient; R2 = coefficient of determination; * = significant according to F test at the 5% level.
with similar (P>0.05) values to those found in the previous period in all forage allowance levels. Therefore, initial tropical kudzu percentage in the sward (25% of the total dry mass) was reduced to only 11% within one year of the experimental period. This performance was opposite to that presented by forage peanut in the lowest forage allowance levels (Table 2). As a consequence, the relation tropical kudzu/forage peanut, that was 6.25 in the beginning of the experimental period, was reduced to 0.41, 0.92, 0.82 and 3.87 in the last quarter of the experimental period, from the lowest to the highest forage allowance level, respectively.
Forage mass of marandugrass was reduced quadratically with decreasing forage allowance levels (Figure 5A). This resulted from a combination of reduction in total forage mass (Figure 3A) and in grass percentage (Figure 4A) under higher grazing intensities. Over the experimental period, average forage mass of marandugrass was 1,770, 2,470, 2,940 and 3,130 kg/ha of DM, from the lowest to the highest forage allowance level, respectively. Its forage mass was higher during the rainiest period (January-March and October-December), and lower during transition period (April-June) and dry season (July-September) (Figure 5B). Forage peanut dry mass was higher in pastures managed with lower forage allowance levels, with data adjusting to a quadratic model (Figure 5C), in contrast with the linear relation observed for its percentage in the pasture (Table 2). Forage mass of this legume tended to increase progressively along the experimental period (Figure 5D), a trend that was interrupted only during the driest period of the year (July-September), when both forage peanut and tropical kudzu suffered from a moderate drought stress resulting in leaf shedding.
In the last quarter of the experimental period, average dry mass of forage peanut was 662, 566, 374 and 181 kg/ha of DM, from the lowest to the highest forage allowance level, respectively. In Costa Rica, after three years under grazing, cultivar Amarillo presented dry mass of 800 and
1,300 kg/ha in mixed swards with marandugrass managed with stocking rates of 1.75 and 3.0 AU/ha, respectively (Ibrahim & Mannetje, 1998). In the coastal region of Bahia, cultivar Belmonte presented dry mass of approximately 310 kg/ha in a mixed sward with B. humidicola, regardless
of the stocking rate (Santana et al., 1998). Although the literature reports this variation in forage mass, the different forage peanut cultivars were productive and persistent in all these experiments, especially in swards managed with higher grazing intensities.
Forage mass of tropical kudzu increased linearly with increasing forage allowance levels in all periods of the year (Table 4). This increment was mainly a result of the increase of pasture total dry mass, given that the percentage of this legume was affected by forage allowance levels only during the April-June period (Table 3). In the lowest forage allowance level there was a progressive reduction of tropical kudzu forage mass until the July-September period, remaining stable in the following period (October-December). In the other forage allowance levels, forage mass of this legume remained relatively stable between January and June, with a strong reduction during the dry season (July-September). With the beginning of the rainy season (October-December) the growth of tropical kudzu was relatively slower than that of forage peanut and marandugrass. As a result, its forage mass in this period was similar to that observed in the previous quarter of the year (July-September). On average, over the four forage allowance levels, forage mass of tropical kudzu was reduced more than 50% from the first to the last quarter of the experimental year.
% LW Jan.-Mar. Apr.-Jun. Jul.-Sep. Oct.-Dec. Mean
6 . 6 747A 553B 307C 261C 4 6 7
10.3 964A 916A 461B 527B 7 1 7
14.3 1,072A 927A 396B 312B 6 7 7
17.9 1,284AB 1,429A 766B 695B 1,043
Mean 1.017 9 5 6 4 8 3 4 4 9 7 2 6
Effect2 Linear Linear Linear Linear –
A 461.3 107.2 62.38 104.0 –
B 45.26** 69.15*** 34.23* 28.10* –
R2 0.62 0.78 0.46 0.56 –
1 Means followed by the same letters, in each line, are not different (P>0.05) by Tukey test.
2 Effect of forage allowance on tropical kudzu forage mass; LW = live weight; a = intercept; b = regression coefficient; R2 = coefficient of determination; *, ** and *** = significant by F test at the 5%, 1% and 0.1% levels, respectively.
Table 4 - Variation in forage mass of tropical kudzu (kg/ha), as a function of forage allowance and period of the year1
Figure 5 - Variation in forage mass of marandugrass, forage peanut and weeds as a function of forage allowance (A, C, E) and period of the year (B, D, F).
weed dry mass was similar to that observed for its percentage in the pasture botanical composition (Figure 4D).
The differences in performance of the two legumes in this pasture confirmed previous information in the literature regarding the sensibility of tropical kudzu and other legumes with twining and climbing growth habit to intensive grazing systems (Skerman, 1977; Humphreys, 1980; Pereira et al., 1992). This study also confirms the high grazing resistance of forage peanut, as it is favored by the sward structure established under higher grazing intensities (Pérez & Lascano, 1992; González et al., 1996; Ibrahim & Mannetje, 1998; Santana et al., 1998; Barcellos et al., 1999; Andrade et al., 2006).
It was expected that increasing forage allowance levels had a more clear effect on persistence of tropical kudzu, since previous information in the literature indicated that this legume does not withstand increased grazing pressures (Skerman, 1977; Humphreys, 1980; Pereira et al., 1992). Skerman (1977) recommended that mixed swards with this legume be managed under low grazing pressures during the entire year, increasing it only when the legume appeared to be dominating the sward. However, in a study reported by Pereira (2002), in the coastal region of Bahia, tropical kudzu mixed with marandugrass persisted at satisfactory levels only with stocking rates up to 1.0 steer/ha. Even in the highest forage allowance level the stocking rates used in this study were above 1.0 AU/ha, along the entire experimental period (data not reported).
The peak of the dry season in Acre (July-September) seems to be the most critical period for the performance of tropical kudzu, since this legume maintained its productive capacity during the first six stocking cycles conducted until June, even with the use of high grazing pressures. During this period, stresses caused by water deficit and by the increase in defoliation intensity of the legume probably were the main factors that restricted the recovery of tropical kudzu plants in the pasture. This legume has growing points accessible to grazing, especially during the flowering phase, when its ramifications twin and climb in order to set the inflorescences. In addition, when a twining legume is grazed, the upper layer consisting of young stems and leaves is removed. These are the most photosynthetically active plant tissues, and as a result of their removal, there is a long phase for the reestablishment of new plant tissues from the lower meristems (Whiteman, 1980). The good recruitment of new plants of tropical kudzu observed in September was not sufficient to reestablish the initial condition of the legume in the sward, thus indicating that the growth or survival of these seedlings could have been affected. It is known that seedling survival in established
pastures depends on the degree of competition with the vegetation already established and the impact of trampling by grazing animals (Curll & Jones, 1989; Forde et al., 1989; Jones & Carter, 1989). The first factor is the most important under light grazing, while the second becomes more relevant as grazing pressure increases, particularly under rotational stocking due to higher stocking density.
These results indicate that tropical kudzu did not adapt to rotational stocking management. Research with twining legumes in mixed swards suggests that they are favored when managed under continuous stocking, due to the reduction of grass competition as a result of its higher defoliation frequency (Roberts, 1982; Lascano, 2000). In Colombia, pastures of Andropogon gayanus were
dominated by tropical kudzu when managed under continuous stocking, with 2 animals/ha during the rainy season and 1 animal/ha in the dry season (Böhnert et al., 1985, cited by Humphreys, 1991). Under rotational stocking, with stocking rate of 2 AU/ha, the legume response was similar to that observed in the present study, with a vigorous performance during the first two stocking cycles, when it reached up to 45% of the sward, and thereafter showing progressive decline during the 3-year experimental period, representing only 3% of the sward at the end of the experiment (Grof, 1991). In the coastal region of Bahia, tropical kudzu presented good compatibility with B. decumbens, maintaining a relatively stable contribution in
the grass-legume mixture after six years under continuous stocking and stocking rates ranging from 1.3 to 2.7 animals/ha (Pereira & Santana, 1990). In Acre, persistence of tropical kudzu has been negatively affected by implementation of rotational stocking in commercial farms (Valentim & Andrade, 2004). Therefore, there is strong evidence that tropical kudzu is better adapted to continuous stocking, being adversely affected by the sudden changes of sward condition under rotational stocking, especially during the dry season, when this legume is more intensively selected. According to Lemaire (1997), forage species need to present high phenotypic plasticity in order to adapt to these changes. It seems that twining legumes do not have such a degree of plasticity, besides being vulnerable to the elimination of their growing points by the grazing animals.
in mixed swards with marandugrass (Figure 5C). Sward structure in taller pastures limits the growth of this prostrate legume, as demonstrated in other studies where forage peanut was associated with grasses of the genera
Panicum (Andrade et al., 2006) and Brachiaria (Grof, 1985;
Ibrahim & Mannetje, 1998).
Conclusions
Forage peanut can be mixed with marandugrass and managed under rotational stocking, showing a better performance when pre-grazing sward height is maintained lower than 45 cm. Tropical kudzu demonstrates poor compatibility with marandugrass under intensive grazing management systems.
References
ALMEIDA, R.G.; NASCIMENTO JÚNIOR, D.; EUCLIDES, V.P.B. et al. Disponibilidade, composição botânica e valor nutritivo da forragem de pastos consorciados, sob três taxas de lotação.
Revista Brasileira de Zootecnia, v.32, n.1, p.36-46, 2003. ANDRADE, C.M.S.; GARCIA, R.; PEREIRA, O.G. et al. Desempenho de seis gramíneas solteiras ou consorciadas com o Stylosanthes guianensis cv. Mineirão e eucalipto em sistema
silvipastoril. Revista Brasileira de Zootecnia, v.32, n.6, p.1845-1850, 2003.
ANDRADE, C.M.S.; GARCIA, R.; VALENTIM, J.F. et al. Grazing managemant strategies for massaigrass-forage peanut pastures. 1. Dynamics of sward condition and botanical composition.
R e v i s t a B r a s i l e i r a d e Z o o t e c n i a, v.35, n.2, p.334-342, 2 0 0 6 .
BARCELLOS, A.O.; ANDRADE, R.P.; KARIA, C.T. et al. Potencial e uso de leguminosas forrageiras dos gêneros
Stylosanthes, Arachis e Leucaena. In: SIMPÓSIO SOBRE
MANEJO DA PASTAGEM, 17., 2001, Piracicaba. Anais...
Piracicaba: FEALQ, 2001. 2.ed, p.365-425.
BARCELLOS, A.O.; PIZARRO, E.A.; COSTA, N.L. Agronomic evaluation of novel germoplasm under grazing: Arachis pintoi
BRA-031143 and P a s p a l u m a t r a t u m BRA-009610. In: INTERNATIONAL GRASSLAND CONGRESS, 18., 1997, Winnipeg. Proceedings… Saskatoon: CFC/CSA/CSAS, 1999. (CD-ROM).
BRAGA, G.J.; PEDREIRA, C.G.S.; HERLING, V.R. et al. Arquitetura foliar de pastagens de Brachiaria brizantha cv. Marandu em
resposta a ofertas de forragem. In: REUNIÃO ANUAL DA SOCIEDADE BRASILEIRA DE ZOOTECNIA, 40., 2003, Santa Maria. Anais… Santa Maria: SBZ, 2003. (CD-ROM). COLOZZA, M.T.; WERNER, J.C.; GERDES, L. et al. Disponibilidade
de forragem e concentração de nitrogênio em capins consorciados ou não com leguminosas. In: REUNIÃO ANUAL DA SOCIEDADE BRASILEIRA DE ZOOTECNIA, 38., 2001, Piracicaba. Anais...
Piracicaba: SBZ, 2001. (CD-ROM).
CURLL, M.L.; JONES, R.M. The plant-animal interface and legume persistence: an Australian perspective. In: MARTEN, G.C.; MATCHES, A.G.; BARNES, R.F. et al. (Eds.) Persistence of forage legumes. Madison: ASA/CSSA/SSSA, 1989. p.339-357.
EUCLIDES, V.P.B.; MACEDO, M.C.M.; OLIVEIRA, M.P. Produção de bovinos em pastagens de Brachiaria spp. consorciadas com Calopogonium mucunoides nos cerrados. Revista Brasileira de Zootecnia, v.27, n.2, p.238-245, 1998.
FORDE, M.B.; HAY, M.J.M.; BROCK, J.L. Development and growth characteristics of temperate perennial legumes. In: MARTEN, G.C.; MATCHES, A.G.; BARNES, R.F. et al. (Eds.)
Persistence of forage legumes. Madison: ASA/CSSA/SSSA, 1989. p.91-108.
GONZÁLEZ, M.S.; VAN HEURCK, L.M.; ROMERO, F. et al. Producción de leche en pasturas de estrella africana (Cynodon nlemfuensis) solo y asociado con Arachis pintoi o Desmodium ovalifolium. Pasturas Tropicales, v.18, n.1, p.2-12, 1996. GROF, B. Forage attributes of the perennial groundnut Arachis
pintoi in a tropical savanna environment in Colombia. In:
INTERNATIONAL GRASSLAND CONGRESS, 15., 1985, Kyoto. Proceedings… Nishi-Nasuno: Japanese Society of Grassland Science, 1985. p.168-170.
GROF, B. Performance of three Centrosema spp. and Pueraria phaseoloides in grazed associations with Andropogon gayanus
in the Eastern Plains of Colombia. Tropical Agriculture, v.68, n.4, p.363-365, 1991.
HERNANDEZ, M.; ARGEL, P.J.; IBRAHIM, M.A. et al. Pasture production, diet selection and live weight gains of cattle grazing
Brachiaria brizantha with or without Arachis pintoi at two stocking rates in the Atlantic Zone of Costa Rica. Tropical Grasslands, v.29, p.134-141, 1995.
HUMPHREYS, L.R. Deficiencies of adaptation of pasture legumes.
Tropical Grasslands, v.14, n.3, p.153-158, 1980.
HUMPHREYS, L.R. Tropical pasture utilization. Cambridge:
Cambridge University Press, 1991. 206p.
IBRAHIM, M.A.; MANNETJE, L.’t. Compatibility, persistence and productivity of grass-legume mixtures in the humid tropics of Costa Rica. 1. Dry matter yield, nitrogen yield and botanical composition. Tropical Grasslands, v.32, n.2, p.96-104, 1998.
JONES, R.M.; CARTER, E.D. Demography of pastures legumes. In: MARTEN, G.C.; MATCHES, A.G.; BARNES, R.F. et al. (Eds.) Persistence of forage legumes. Madison: ASA/CSSA/
SSSA, 1989. p.139-156.
LASCANO, C.E. Selective grazing on grass-legume mixtures in tropical pastures. In: LEMAIRE, G.; HODGSON, J.; MORAES, A. et al. (Eds.) G r a s s l a n d e c o p h y s i o l o g y a n d g r a z i n g ecology. Wallingford: CAB International, 2000. p.249-263. LEMAIRE, G. The physiology of grass growth under grazing: tissue turnover. In: SIMPÓSIO INTERNACIONAL SOBRE PRODUÇÃO ANIMAL EM PASTEJO, 1997, Viçosa, MG.
Anais... Viçosa, MG: DZO/UFV, 1997. p.117-144.
PEREIRA, J.M. Leguminosas forrageiras em sistemas de produção de ruminantes: onde estamos? para onde vamos? In: SIMPÓSIO SOBRE MANEJO ESTRATÉGICO DE PASTAGENS, 1., 2002, Viçosa, MG. Anais... Viçosa, MG: DZO/UFV, 2002. p.109-147.
PEREIRA, J.M.; NASCIMENTO JÚNIOR, D.; SANTANA, J.R. Disponibilidade e composição botânica da forragem disponível em pastagens de Brachiaria humidicola (Rendle) Schweickt,
em monocultivo ou consorciado com leguminosas, submetidas a diferentes taxas de lotação. R e v i s t a d a S o c i e d a d e Brasileira de Zootecnia, v.21, n.1, p.90-103, 1992.
PEREIRA, J.M.; SANTANA, J.R. Produtividade de pastagem de
Brachiaria decumbens com a introdução de leguminosa e
fertilização nitrogenada. In: RED INTERNACIONAL DE EVALUACIÓN DE PASTOS TROPICALES – Amazonia, 1., 1990, Lima. Anais... Cali: CIAT, 1990. v.2, p.581-585.
PÉREZ, R.A.; LASCANO, C.E. Potencial de producción animal de asociaciones de gramíneas y leguminosas promisorias en el piedemonte de la Orinoquia Colombiana. In: RED INTERNACIONAL DE EVALUACIÓN DE PASTOS TROPICALES – Sabanas, 1., 1992, Brasília. Anais... Cali: CIAT, 1992. p.585-593.
SANTANA, J.R.; PEREIRA, J.M.; RESENDE, C.P. Avaliação da consorciação de Brachiaria dictyoneura Stapf com Arachis pintoi Krapov & Gregory sob pastejo. In: REUNIÃO ANUAL
DA SOCIEDADE BRASILEIRA DE ZOOTECNIA, 35., 1998, Botucatu. Anais… Botucatu: SBZ, 1998. (1 CD-ROM). SKERMAN, P.J. Tropical forage legumes. Roma: FAO, 1977.
609p.
SOUZA FILHO, A.P.S.; ALVES, S.M.; DUTRA, S. Estádio de desenvolvimento e estresse hídrico e as potencialidades alelopáticas do capim-marandu. Planta daninha, v.20, n.1, 2002. Available at: <http://www.scielo.br/scielo.php?script =sci_ arttext&pid=S0100-83582002000100004 &lng=en&nrm=iso>. Accessed on: Oct. 11, 2010.
VALENTIM, J.F.; ANDRADE, C.M.S. Perspectives of grass-legume pastures for sustainable animal production in the
t r o p i c s . I n : R E U N I Ã O A N N U A L D A S O C I E D A D E BRASILEIRA DE ZOOTECNIA, 40., 2004, Campo Grande.
Anais... Campo Grande: SBZ/Embrapa Gado de Corte, 2004. p . 1 4 2 - 1 5 4 .
VALENTIM, J.F.; ANDRADE, C.M.S.; FEITOZA, J.E. et al.
Métodos de introdução do amendoim forrageiro em pastagens já estabelecidas no Acre. Rio Branco: Embrapa Acre, 2002. 6p. (Comunicado Técnico, 152).
WHALLEY, R.D.B.; HARDY, M.B. Measuring botanical composition of grasslands. In: MANNETJE, L.’t; JONES, R.M. (Eds.) Field and laboratory methods for grassland and animal production research. Wallingford: CAB International, 2000. p.67-102.